donsutherland1
-
Posts
24,137 -
Joined
Content Type
Profiles
Blogs
Forums
American Weather
Media Demo
Store
Gallery
Everything posted by donsutherland1
-
Parts of the region again saw temperatures surge into the 90s. However, a cold front that has already triggered thunderstorms will break the heat in much of the region. 90° Days for Select Cities (through July 17): Albany: 4 (2020: 13 days; 5-Year Average: 13.6 days) Allentown: 15 (2020: 24 days; 5-Year Average: 27.6 days) Baltimore: 26 (2020: 46 days; 5-Year Average: 44.6 days) Boston: 14 (2020: 14 days; 5-Year Average: 17.2 days) Bridgeport: 7 (2020: 11 days; 5-Year Average: 13.4 days) Burlington: 7 (2020: 20 days; 5-Year Average: 13.0 days) Harrisburg: 19 (2020: 35 days; 5-Year Average: 30.6 days) Hartford: 15 (2020: 39 days; 5-Year Average: 29.0 days) Islip: 3 (2020: 8 days; 5-Year Average: 9.4 days) New York City-JFK: 5 (2020: 12 days; 5-Year Average: 10.2 days) New York City-LGA: 15 (2020: 34 days; 5-Year Average: 29.4 days) New York City-NYC: 12 (2020: 20 days; 5-Year Average: 18.2 days) Newark: 24 (2020: 31 days; 5-Year Average: 31.2 days) Philadelphia: 20 (2020: 36 days; 5-Year Average: 34.6 days) Scranton: 12 (2020: 25 days; 5-Year Average: 16.4 days) Washington, DC: 22 (2020: 46 days; 5-Year Average: 50.8 days) New York City-Newark Average: 14 (2020: 22 days) ...Expected: 15 (based on regression equation tied to JFK-LGA-EWR data) Tomorrow will start out with clouds and possible showers and thundershowers. The clouds could break during the afternoon and humidity levels could fall. It will be cooler than today. In the long-range, August could wind up warmer to perhaps much warmer than normal based on the evolution of the MJO. The MJO was in Phase 1 with an amplitude between 1.500 and 2.000 on multiple days during the June 20-30 period. There were 8 prior cases similar to 2021. mean temperature for August was 77.1° following such cases. The 1991-20 mean temperature for was 76.0° for August. 88% of the August cases were warmer than the 1991-20 mean temperatures. Early prospects for a very warm second half of July have diminished on account of the MJO's having moved back into Phase 2 from Phase 3. Out West, some of the long-range guidance, including the latest EPS weeklies, suggest that a new expansive heat dome could develop over the western third of the United States and Canada toward the end of July or during the first week of August and then persist toward mid-month. The ENSO Region 1+2 anomaly was +0.1°C and the Region 3.4 anomaly was 0.0°C for the week centered around July 7. For the past six weeks, the ENSO Region 1+2 anomaly has averaged 0.10°C and the ENSO Region 3.4 anomaly has averaged -0.13°C. Neutral ENSO conditions will likely prevail through August. The SOI was +30.41 today. This was the third consecutive day on which the SOI was at +30.00 or above. The last time that happened was during December 17-19, 2020 when the SOI was at or above +30.00 for three consecutive days. The preliminary Arctic Oscillation (AO) figure was +1.363 today. On July 15 the MJO was in Phase 4 at an amplitude of 0.967 (RMM). The July 14-adjusted amplitude was 0.970 (RMM). In late April, the MJO moved through Phase 8 at an extreme amplitude (+3.000 or above). Only February 25, 1988 and March 18-19, 2015 had a higher amplitude at Phase 8. Both 1988 and 2015 went on to have an exceptionally warm July-August period. July-August 1988 had a mean temperature of 79.1°, which ranked 4th highest for that two-month period. July-August 2015 had a mean temperature of 78.9°, which ranked 5th highest for that two-month period. September 2015 was also the warmest September on record. The MJO's extreme passage through Phase 8 could provide the first hint of a hot summer. Since 1896, 76% of years that saw Phoenix reach 115° or above in June, as occurred this year, had a warmer than July-August in the Middle Atlantic region. The ratio of top 30 July-August temperatures relative to bottom 30 temperatures was 6:1 in favor of the warmth. Overall, the ingredients continue to fall into place for a warmer than normal to potentially hot summer. Based on sensitivity analysis applied to the latest guidance, there is an implied 65% probability that New York City will have a cooler than normal July (1991-2020 normal). July will likely finish with a mean temperature near 76.8° (0.7° below normal).
-
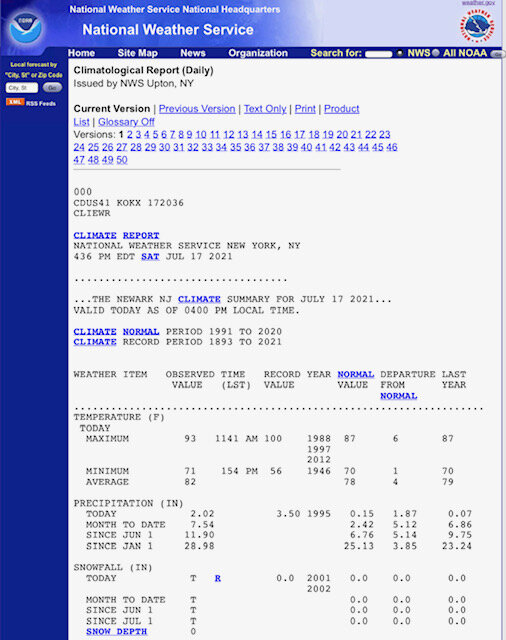
It’s not supposed to be listed as snow/sleet in the climate record. But the ASOS can’t distinguish between small hail and sleet.
-
Quality control needed. Note the snowfall section:
-
Thunderstorms grazed the New York Botanical Garden this afternoon knocking the temperature back into the 80s. Some light rain fell, but there were no downpours. The daylilies are now at or just past their peak bloom.


-
Yes, that's a black swallowtail.
-
Some photos from Robert Moses State Park yesterday. The sea breeze kept temperatures in the middle 80s.

-
Morning thoughts… It will be partly sunny and very warm today. An approaching cold front will trigger showers and thunderstorms, some of which could produce damaging winds and flooding downpours. Temperatures will likely reach the upper 80s and lower 90s in most of the region. Likely high temperatures around the region include: New York City (Central Park): 89° Newark: 94° Philadelphia: 93° Normals: New York City: 30-Year: 85.3°; 15-Year: 86.4° Newark: 30-Year: 87.3°; 15-Year: 88.6° Philadelphia: 30-Year: 88.1°; 15-Year: 89.2° Rain should end during tomorrow morning and clouds could break. It will be cooler.
-
Under mostly sunny skies, temperatures surged into the lower and middle 90s across the region. 90° Days for Select Cities (through July 16): Albany: 4 (2020: 13 days; 5-Year Average: 13.6 days) Allentown: 14 (2020: 24 days; 5-Year Average: 27.6 days) Baltimore: 25 (2020: 46 days; 5-Year Average: 44.6 days) Boston: 14 (2020: 14 days; 5-Year Average: 17.2 days) Bridgeport: 7 (2020: 11 days; 5-Year Average: 13.4 days) Burlington: 7 (2020: 20 days; 5-Year Average: 13.0 days) Harrisburg: 18 (2020: 35 days; 5-Year Average: 30.6 days) Hartford: 14 (2020: 39 days; 5-Year Average: 29.0 days) Islip: 3 (2020: 8 days; 5-Year Average: 9.4 days) New York City-JFK: 5 (2020: 12 days; 5-Year Average: 10.2 days) New York City-LGA: 14 (2020: 34 days; 5-Year Average: 29.4 days) New York City-NYC: 11 (2020: 20 days; 5-Year Average: 18.2 days) Newark: 23 (2020: 31 days; 5-Year Average: 31.2 days) Philadelphia: 19 (2020: 36 days; 5-Year Average: 34.6 days) Scranton: 11 (2020: 25 days; 5-Year Average: 16.4 days) Washington, DC: 21 (2020: 46 days; 5-Year Average: 50.8 days) New York City-Newark Average: 13 (2020: 22 days) ...Expected: 14 (based on regression equation tied to JFK-LGA-EWR data) The weekend could see more clouds and perhaps thundershowers. In the long-range, August could wind up warmer to perhaps much warmer than normal based on the evolution of the MJO. The MJO was in Phase 1 with an amplitude between 1.500 and 2.000 on multiple days during the June 20-30 period. There were 8 prior cases similar to 2021. mean temperature for August was 77.1° following such cases. The 1991-20 mean temperature for was 76.0° for August. 88% of the August cases were warmer than the 1991-20 mean temperatures. Early prospects for a very warm second half of July have diminished on account of the MJO's having moved back into Phase 2 from Phase 3. Out West, some of the long-range guidance, including the latest EPS weeklies, suggest that a new expansive heat dome could develop over the western third of the United States and Canada toward the end of July or during the first week of August and then persist toward mid-month. The ENSO Region 1+2 anomaly was +0.1°C and the Region 3.4 anomaly was 0.0°C for the week centered around July 7. For the past six weeks, the ENSO Region 1+2 anomaly has averaged 0.10°C and the ENSO Region 3.4 anomaly has averaged -0.13°C. Neutral ENSO conditions will likely prevail through August. The SOI was +33.05 today. This was the second consecutive day on which the SOI was at +30.00 or above. The last time that happened was during December 17-19, 2020 when the SOI was at or above +30.00 for three consecutive days. The preliminary Arctic Oscillation (AO) figure was +1.363 today. On July 14 the MJO was in Phase 2 at an amplitude of 0.970 (RMM). The July 13-adjusted amplitude was 0.939 (RMM). In late April, the MJO moved through Phase 8 at an extreme amplitude (+3.000 or above). Only February 25, 1988 and March 18-19, 2015 had a higher amplitude at Phase 8. Both 1988 and 2015 went on to have an exceptionally warm July-August period. July-August 1988 had a mean temperature of 79.1°, which ranked 4th highest for that two-month period. July-August 2015 had a mean temperature of 78.9°, which ranked 5th highest for that two-month period. September 2015 was also the warmest September on record. The MJO's extreme passage through Phase 8 could provide the first hint of a hot summer. Since 1896, 76% of years that saw Phoenix reach 115° or above in June, as occurred this year, had a warmer than July-August in the Middle Atlantic region. The ratio of top 30 July-August temperatures relative to bottom 30 temperatures was 6:1 in favor of the warmth. Overall, the ingredients continue to fall into place for a warmer than normal to potentially hot summer. Based on sensitivity analysis applied to the latest guidance, there is an implied 60% probability that New York City will have a cooler than normal July (1991-2020 normal). July will likely finish with a mean temperature near 76.9° (0.6° below normal).
-
Morning thoughts… A hot and humid day lies ahead. It will be partly sunny and hot. A few locations could see an afternoon or evening thundershower. Temperatures will likely reach the lower and middle 90s in most of the region. Likely high temperatures around the region include: New York City (Central Park): 92° Newark: 97° Philadelphia: 93° Normals: New York City: 30-Year: 85.2°; 15-Year: 86.3° Newark: 30-Year: 87.3°; 15-Year: 88.5° Philadelphia: 30-Year: 88.1°; 15-Year: 89.2° Tomorrow will be variably cloudy and very warm with an increasing chance of showers and thunderstorms.
-
Some climate data for Billings:
-
The thermometer soared into the upper 80s and lower 90s across the region today. 90° Days for Select Cities (through July 15): Albany: 4 (2020: 13 days; 5-Year Average: 13.6 days) Allentown: 13 (2020: 24 days; 5-Year Average: 27.6 days) Baltimore: 24 (2020: 46 days; 5-Year Average: 44.6 days) Boston: 13 (2020: 14 days; 5-Year Average: 17.2 days) Bridgeport: 6 (2020: 11 days; 5-Year Average: 13.4 days) Burlington: 7 (2020: 20 days; 5-Year Average: 13.0 days) Harrisburg: 17 (2020: 35 days; 5-Year Average: 30.6 days) Hartford: 13 (2020: 39 days; 5-Year Average: 29.0 days) Islip: 3 (2020: 8 days; 5-Year Average: 9.4 days) New York City-JFK: 5 (2020: 12 days; 5-Year Average: 10.2 days) New York City-LGA: 13 (2020: 34 days; 5-Year Average: 29.4 days) New York City-NYC: 10 (2020: 20 days; 5-Year Average: 18.2 days) Newark: 22 (2020: 31 days; 5-Year Average: 31.2 days) Philadelphia: 18 (2020: 36 days; 5-Year Average: 34.6 days) Scranton: 11 (2020: 25 days; 5-Year Average: 16.4 days) Washington, DC: 20 (2020: 46 days; 5-Year Average: 50.8 days) New York City-Newark Average: 13 (2020: 22 days) ...Expected: 13 (based on regression equation tied to JFK-LGA-EWR data) Tomorrow will be another very warm and humid day with highs in the upper 80s and lower 90s. The weekend could see more clouds and perhaps thundershowers. In the long-range, August could wind up warmer to perhaps much warmer than normal based on the evolution of the MJO. The MJO was in Phase 1 with an amplitude between 1.500 and 2.000 on multiple days during the June 20-30 period. There were 8 prior cases similar to 2021. mean temperature for August was 77.1° following such cases. The 1991-20 mean temperature for was 76.0° for August. 88% of the August cases were warmer than the 1991-20 mean temperatures. Early prospects for a very warm second half of July have diminished on account of the MJO's having moved back into Phase 2 from Phase 3. The ENSO Region 1+2 anomaly was +0.1°C and the Region 3.4 anomaly was 0.0°C for the week centered around July 7. For the past six weeks, the ENSO Region 1+2 anomaly has averaged 0.10°C and the ENSO Region 3.4 anomaly has averaged -0.13°C. Neutral ENSO conditions will likely prevail through August. The SOI was +37.86 today. That is the highest SOI value since January 15, 2014 when the SOI was +50.17. The preliminary Arctic Oscillation (AO) figure was +1.750 today. On July 13 the MJO was in Phase 2 at an amplitude of 0.941 (RMM). The July 12-adjusted amplitude was 1.091 (RMM). In late April, the MJO moved through Phase 8 at an extreme amplitude (+3.000 or above). Only February 25, 1988 and March 18-19, 2015 had a higher amplitude at Phase 8. Both 1988 and 2015 went on to have an exceptionally warm July-August period. July-August 1988 had a mean temperature of 79.1°, which ranked 4th highest for that two-month period. July-August 2015 had a mean temperature of 78.9°, which ranked 5th highest for that two-month period. September 2015 was also the warmest September on record. The MJO's extreme passage through Phase 8 could provide the first hint of a hot summer. Since 1896, 76% of years that saw Phoenix reach 115° or above in June, as occurred this year, had a warmer than July-August in the Middle Atlantic region. The ratio of top 30 July-August temperatures relative to bottom 30 temperatures was 6:1 in favor of the warmth. Overall, the ingredients continue to fall into place for a warmer than normal to potentially hot summer. Based on sensitivity analysis applied to the latest guidance, there is an implied 63% probability that New York City will have a cooler than normal July (1991-2020 normal). July will likely finish with a mean temperature near 76.9° (0.6° below normal).
-
Morning thoughts… A very warm and humid day lies ahead. It will be partly cloudy and very warm today. Temperatures will likely reach the upper 80s and lower 90s in most of the region. Likely high temperatures around the region include: New York City (Central Park): 89° Newark: 93° Philadelphia: 93° Normals: New York City: 30-Year: 85.2°; 15-Year: 86.3° Newark: 30-Year: 87.3°; 15-Year: 88.5° Philadelphia: 30-Year: 88.1°; 15-Year: 89.2° Tomorrow will be partly sunny and hot.
-
Washington, DC to Newark saw temperatures rise into the 90s. Tomorrow will be another steamy day with highs in the upper 80s and lower 90s. Through Friday, temperatures will continue to top out mainly in the upper 80s and lower 90s. The weekend could see more clouds and perhaps thundershowers. In the long-range, August could wind up warmer to perhaps much warmer than normal based on the evolution of the MJO. The MJO was in Phase 1 with an amplitude between 1.500 and 2.000 on multiple days during the June 20-30 period. There were 8 prior cases similar to 2021. mean temperature for August was 77.1° following such cases. The 1991-20 mean temperature for was 76.0° for August. 88% of the August cases were warmer than the 1991-20 mean temperatures. Early prospects for a very warm second half of July have diminished on account of the MJO's having moved back into Phase 2 from Phase 3. The ENSO Region 1+2 anomaly was +0.1°C and the Region 3.4 anomaly was 0.0°C for the week centered around July 7. For the past six weeks, the ENSO Region 1+2 anomaly has averaged 0.10°C and the ENSO Region 3.4 anomaly has averaged -0.13°C. Neutral ENSO conditions will likely prevail through August. The SOI was +26.22 today. The preliminary Arctic Oscillation (AO) figure was +1.496 today. On July 12 the MJO was in Phase 2 at an amplitude of 1.091 (RMM). The July 11-adjusted amplitude was 1.391 (RMM). In late April, the MJO moved through Phase 8 at an extreme amplitude (+3.000 or above). Only February 25, 1988 and March 18-19, 2015 had a higher amplitude at Phase 8. Both 1988 and 2015 went on to have an exceptionally warm July-August period. July-August 1988 had a mean temperature of 79.1°, which ranked 4th highest for that two-month period. July-August 2015 had a mean temperature of 78.9°, which ranked 5th highest for that two-month period. September 2015 was also the warmest September on record. The MJO's extreme passage through Phase 8 could provide the first hint of a hot summer. Since 1896, 76% of years that saw Phoenix reach 115° or above in June, as occurred this year, had a warmer than July-August in the Middle Atlantic region. The ratio of top 30 July-August temperatures relative to bottom 30 temperatures was 6:1 in favor of the warmth. Overall, the ingredients continue to fall into place for a warmer than normal to potentially hot summer. Based on sensitivity analysis applied to the latest guidance, there is an implied 58% probability that New York City will have a cooler than normal July (1991-2020 normal). July will likely finish with a mean temperature near 77.1° (0.4° below normal).
-
Morning thoughts… A steamy day is in order. It will be partly cloudy and very warm today. There could be some scattered showers or thundershowers in parts of the region. Temperatures will likely reach the upper 80s and lower 90s in most of the region. Likely high temperatures around the region include: New York City (Central Park): 88° Newark: 93° Philadelphia: 90° Normals: New York City: 30-Year: 85.2°; 15-Year: 86.2° Newark: 30-Year: 87.3°; 15-Year: 88.5° Philadelphia: 30-Year: 88.1°; 15-Year: 89.1° Tomorrow will be partly sunny and hot.
-
Warmer air was confined to Philadelphia and southward. While Baltimore hit 96°, New York City's Central Park rose only to 72°. The warm front will gradually move northward tonight and tomorrow. As a result, tomorrow will be variably cloudy and noticeably warmer. Showers or thundershowers are possible. The remainder of the work week will see temperatures mainly in the upper 80s and lower 90s. The second half of July and August could wind up warmer to perhaps much warmer than normal based on the evolution of the MJO. The MJO was in Phase 1 with an amplitude between 1.500 and 2.000 on multiple days during the June 20-30 period. There were 8 prior cases similar to 2021. The mean temperature for New York City during the July 16-31 period was 79.4° and the mean temperature for August was 77.1° following such cases. The 1991-20 mean temperature for July 16-31 was 77.9° and 76.0° for August. 75% of the July 16-31 cases and 88% of the August cases were warmer than the 1991-20 mean temperatures. The ENSO Region 1+2 anomaly was +0.1°C and the Region 3.4 anomaly was 0.0°C for the week centered around July 7. For the past six weeks, the ENSO Region 1+2 anomaly has averaged 0.10°C and the ENSO Region 3.4 anomaly has averaged -0.13°C. Neutral ENSO conditions will likely prevail through August. The SOI was +17.24 today. The preliminary Arctic Oscillation (AO) figure was +1.369 today. On July 11 the MJO was in Phase 2 at an amplitude of 1.391 (RMM). The July 10-adjusted amplitude was 1.382 (RMM). In late April, the MJO moved through Phase 8 at an extreme amplitude (+3.000 or above). Only February 25, 1988 and March 18-19, 2015 had a higher amplitude at Phase 8. Both 1988 and 2015 went on to have an exceptionally warm July-August period. July-August 1988 had a mean temperature of 79.1°, which ranked 4th highest for that two-month period. July-August 2015 had a mean temperature of 78.9°, which ranked 5th highest for that two-month period. September 2015 was also the warmest September on record. The MJO's extreme passage through Phase 8 could provide the first hint of a hot summer. Since 1896, 76% of years that saw Phoenix reach 115° or above in June, as occurred this year, had a warmer than July-August in the Middle Atlantic region. The ratio of top 30 July-August temperatures relative to bottom 30 temperatures was 6:1 in favor of the warmth. Overall, the ingredients continue to fall into place for a warmer than normal to potentially hot summer. Based on sensitivity analysis applied to the latest guidance, there is an implied 44% probability that New York City will have a warmer than normal July (1991-2020 normal). July will likely finish with a mean temperature near 77.2° (0.3° below normal).
-
It’s more than likely that any NWS outreach occurred prior to Mr. Ceglarek’s tenure, possibly the late 1990s or early 2000s.
-
Morning thoughts… It will be mostly cloudy and somewhat cooler today. There could still be a scattered shower or thundershower. Temperatures will likely reach the upper 70s and lower 80s in most of the region. Philadelphia to Washington, DC will see readings in the 90s. Likely high temperatures around the region include: New York City (Central Park): 78° Newark: 82° Philadelphia: 91° Normals: New York City: 30-Year: 85.1°; 15-Year: 86.1° Newark: 30-Year: 87.3°; 15-Year: 88.4° Philadelphia: 30-Year: 88.1°; 15-Year: 89.1° Tomorrow will be partly sunny and warmer.
-
Under partly sunny skies, temperatures surged into the 80s in the northern Mid-Atlantic region. South of there, especially from Newark, temperatures rose into the 90s. 90° Days for Select Cities (through July 12): Albany: 4 (2020: 13 days; 5-Year Average: 13.6 days) Allentown: 13 (2020: 24 days; 5-Year Average: 27.6 days) Baltimore: 21 (2020: 46 days; 5-Year Average: 44.6 days) Boston: 13 (2020: 14 days; 5-Year Average: 17.2 days) Bridgeport: 6 (2020: 11 days; 5-Year Average: 13.4 days) Burlington: 7 (2020: 20 days; 5-Year Average: 13.0 days) Harrisburg: 15 (2020: 35 days; 5-Year Average: 30.6 days) Hartford: 13 (2020: 39 days; 5-Year Average: 29.0 days) Islip: 3 (2020: 8 days; 5-Year Average: 9.4 days) New York City-JFK: 5 (2020: 12 days; 5-Year Average: 10.2 days) New York City-LGA: 11 (2020: 34 days; 5-Year Average: 29.4 days) New York City-NYC: 10 (2020: 20 days; 5-Year Average: 18.2 days) Newark: 20 (2020: 31 days; 5-Year Average: 31.2 days) Philadelphia: 16 (2020: 36 days; 5-Year Average: 34.6 days) Scranton: 11 (2020: 25 days; 5-Year Average: 16.4 days) Washington, DC: 17 (2020: 46 days; 5-Year Average: 50.8 days) New York City-Newark Average: 12 (2020: 22 days) ...Expected: 12 (based on regression equation tied to JFK-LGA-EWR data) Tomorrow will be variably cloudy and cooler in the northern Mid-Atlantic region. Showers and thundershowers are possible. Washington, DC to Philadelphia will likely see readings surge into the lower and middle 90s. In the long-range, the second half of July and August could wind up warmer to perhaps much warmer than normal based on the evolution of the MJO. The MJO was in Phase 1 with an amplitude between 1.500 and 2.000 on multiple days during the June 20-30 period. There were 8 prior cases similar to 2021. The mean temperature for New York City during the July 16-31 period was 79.4° and the mean temperature for August was 77.1° following such cases. The 1991-20 mean temperature for July 16-31 was 77.9° and 76.0° for August. 75% of the July 16-31 cases and 88% of the August cases were warmer than the 1991-20 mean temperatures. The ENSO Region 1+2 anomaly was +0.1°C and the Region 3.4 anomaly was 0.0°C for the week centered around July 7. For the past six weeks, the ENSO Region 1+2 anomaly has averaged 0.10°C and the ENSO Region 3.4 anomaly has averaged -0.13°C. Neutral ENSO conditions will likely prevail through August. The SOI was +17.24 today. The preliminary Arctic Oscillation (AO) figure was +1.253 today. On July 10 the MJO was in Phase 2 at an amplitude of 1.381 (RMM). The July 9-adjusted amplitude was 1.329 (RMM). In late April, the MJO moved through Phase 8 at an extreme amplitude (+3.000 or above). Only February 25, 1988 and March 18-19, 2015 had a higher amplitude at Phase 8. Both 1988 and 2015 went on to have an exceptionally warm July-August period. July-August 1988 had a mean temperature of 79.1°, which ranked 4th highest for that two-month period. July-August 2015 had a mean temperature of 78.9°, which ranked 5th highest for that two-month period. September 2015 was also the warmest September on record. The MJO's extreme passage through Phase 8 could provide the first hint of a hot summer. Since 1896, 76% of years that saw Phoenix reach 115° or above in June, as occurred this year, had a warmer than July-August in the Middle Atlantic region. The ratio of top 30 July-August temperatures relative to bottom 30 temperatures was 6:1 in favor of the warmth. Overall, the ingredients continue to fall into place for a warmer than normal to potentially hot summer. Based on sensitivity analysis applied to the latest guidance, there is an implied 46% probability that New York City will have a warmer than normal July (1991-2020 normal). July will likely finish with a mean temperature near 77.3° (0.2° below normal).
-
A recent paper: https://sciencebrief.org/uploads/reviews/ScienceBrief_Review_RAINFALL_Jun2021.pdf
- 382 replies
-
- 1
-

-
- flash flooding
- severewx
- (and 1 more)
-
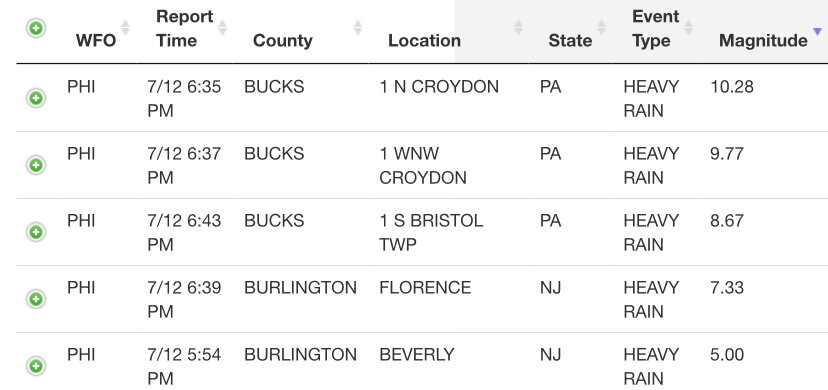
July rainfall and monthly rankings under select rainfall scenarios:
- 382 replies
-
- 2
-
-
- flash flooding
- severewx
- (and 1 more)
-
Morning thoughts… Between 2 am and 3 am, Central Park received 1.35” of rain. Since hourly data was first recorded in 1943, there have been only 12 such days (including today). This is the first time two such deluges occurred within the same month, with 1.56” hourly rainfall on July 8 and 1.35” today. 2006 is the only prior year with two such amounts, but the first event occurred on June 2 and the second occurred on August 10. As a result of this morning’s rainfall, July 2021 now ranks as the 7th wettest July on record. Records go back to 1869. It will be partly to mostly cloudy. Heavy showers and thundershowers are likely across a slowly advancing warm front. Flash flooding is possible in some locations. Temperatures will likely reach the lower and middle 80s in most places today. Likely high temperatures around the region include: New York City (Central Park): 84° Newark: 89° Philadelphia: 91° Normals: New York City: 30-Year: 85.1°; 15-Year: 86.0° Newark: 30-Year: 87.2°; 15-Year: 88.3° Philadelphia: 30-Year: 88.1°; 15-Year: 89.0° Additional rain is likely tomorrow.
-
Clouds yielded to some sunshine this afternoon sending temperatures into the upper 70s and lower 80s. The humidity made temperatures feel closer to 90° in many spots. Tomorrow will be partly to mostly cloudy. Showers and heavy thunderstorms could develop producing flooding in poor drainage areas and adjacent to streams and rivers following the wettest first 10 days on record in July in parts of the region. Out West, another bout of extreme heat is underway. Already, some impressive high temperatures have occurred. Select readings today included: Death Valley, CA: 128° (old record: 127°, 2002)* Las Vegas: 114° Needles, CA: 116° Phoenix: 111° * - 129° in 1913 is unreliable. Tomorrow will be another scorching day. Afterward, the heat will ease. By the end of the heatwave, Death Valley could be near or even above its annual record of 10 125° or above days. That record was set in 1913 (unreliable) and then tied in 2013 and 2017. In the long-range, the second half of July and August could wind up warmer to perhaps much warmer than normal based on the evolution of the MJO. The MJO was in Phase 1 with an amplitude between 1.500 and 2.000 on multiple days during the June 20-30 period. There were 8 prior cases similar to 2021. The mean temperature for New York City during the July 16-31 period was 79.4° and the mean temperature for August was 77.1° following such cases. The 1991-20 mean temperature for July 16-31 was 77.9° and 76.0° for August. 75% of the July 16-31 cases and 88% of the August cases were warmer than the 1991-20 mean temperatures. The ENSO Region 1+2 anomaly was +0.3°C and the Region 3.4 anomaly was -0.1°C for the week centered around June 30. For the past six weeks, the ENSO Region 1+2 anomaly has averaged 0.00°C and the ENSO Region 3.4 anomaly has averaged -0.18°C. Neutral ENSO conditions will likely prevail through August. The SOI was +14.96 today. The preliminary Arctic Oscillation (AO) figure was +0.913 today. On July 9 the MJO was in Phase 3 at an amplitude of 1.333 (RMM). The July 8-adjusted amplitude was 1.000 (RMM). In late April, the MJO moved through Phase 8 at an extreme amplitude (+3.000 or above). Only February 25, 1988 and March 18-19, 2015 had a higher amplitude at Phase 8. Both 1988 and 2015 went on to have an exceptionally warm July-August period. July-August 1988 had a mean temperature of 79.1°, which ranked 4th highest for that two-month period. July-August 2015 had a mean temperature of 78.9°, which ranked 5th highest for that two-month period. September 2015 was also the warmest September on record. The MJO's extreme passage through Phase 8 could provide the first hint of a hot summer. Since 1896, 76% of years that saw Phoenix reach 115° or above in June, as occurred this year, had a warmer than July-August in the Middle Atlantic region. The ratio of top 30 July-August temperatures relative to bottom 30 temperatures was 6:1 in favor of the warmth. Overall, the ingredients continue to fall into place for a warmer than normal to potentially hot summer. Based on sensitivity analysis applied to the latest guidance, there is an implied 50% probability that New York City will have a warmer than normal July (1991-2020 normal). July will likely finish with a mean temperature near 77.5° (near normal).
-
Severe June 2021 Heatwave in Phoenix and Tucson
donsutherland1 replied to donsutherland1's topic in Climate Change
Today will very likely be hotter than tomorrow. The 134F is a flawed report. So is the 131F that was reported in Tunisia.- 33 replies
-
- 2
-
-
- heatwave
- extreme heat event
- (and 5 more)