

donsutherland1
-
Posts
23,761 -
Joined
Content Type
Profiles
Blogs
Forums
American Weather
Media Demo
Store
Gallery
Everything posted by donsutherland1
-
Yes, JFK hit 90 yesterday. Central Park could only manage 89.
-
Morning thoughts… Today will be mostly sunny and hot. High temperatures will likely reach the lower 90s in most of the region with some places topping out in the middle 90s. Likely high temperatures around the region include: New York City (Central Park): 90° Newark: 95° Philadelphia: 95° Normals: New York City: 30-Year: 82.3°; 15-Year: 82.0° Newark: 30-Year: 83.6°; 15-Year: 83.1° Philadelphia: 30-Year: 84.8°; 15-Year: 84.4° The very warm weather will continue through Friday before it turns cooler for the weekend.
-
Much of the region saw temperatures rise into the upper 80s and lower 90s. 90° Days for Select Cities (through August 24): Albany: 4 (2020: 13 days; 5-Year Average: 13.6 days) Allentown: 21 (2020: 24 days; 5-Year Average: 27.6 days) Baltimore: 45 (2020: 46 days; 5-Year Average: 44.6 days) Boston: 21 (2020: 14 days; 5-Year Average: 17.2 days) Bridgeport: 10 (2020: 11 days; 5-Year Average: 13.4 days) Burlington: 12 (2020: 20 days; 5-Year Average: 13.0 days) Harrisburg: 31 (2020: 35 days; 5-Year Average: 30.6 days) Hartford: 21 (2020: 39 days; 5-Year Average: 29.0 days) Islip: 6 (2020: 8 days; 5-Year Average: 9.4 days) New York City-JFK: 9 (2020: 12 days; 5-Year Average: 10.2 days) New York City-LGA: 22 (2020: 34 days; 5-Year Average: 29.4 days) New York City-NYC: 14 (2020: 20 days; 5-Year Average: 18.2 days) Newark: 36 (2020: 33 days; 5-Year Average: 31.2 days) Philadelphia: 32 (2020: 36 days; 5-Year Average: 34.6 days) Scranton: 16 (2020: 25 days; 5-Year Average: 16.4 days) Washington, DC: 41 (2020: 46 days; 5-Year Average: 50.8 days) New York City-Newark Average: 20 (2020: 22 days) ...Expected: 22 (based on regression equation tied to JFK-LGA-EWR data) Tomorrow could be a degree or two warmer. In addition, the humidity will begin to increase. Much of the remainder of this week will feature unseasonably warm temperatures. The ENSO Region 1+2 anomaly was -0.1°C and the Region 3.4 anomaly was -0.9°C for the week centered around August 18. For the past six weeks, the ENSO Region 1+2 anomaly has averaged +0.41°C and the ENSO Region 3.4 anomaly has averaged -0.43°C. Neutral ENSO conditions will likely prevail into mid-September. Afterward, La Niña could begin to develop. The SOI was +12.20 today. The preliminary Arctic Oscillation (AO) figure was -0.976 today. On August 22 the MJO was in Phase 2 at an amplitude of 0.675 (RMM). The August 21-adjusted amplitude was 0.962 (RMM). Based on sensitivity analysis applied to the latest guidance, there is an implied 87% probability that New York City will have a warmer than normal August (1991-2020 normal). August will likely finish with a mean temperature near 77.3° (1.3° above normal).
-
That may have been a cold core storm that developed a warm core along its unusual path.
-
Even more remarkable, no tropical storms or hurricanes made U.S. landfall.
-
I hope it does, but my thinking is that it won’t reach or exceed 10”.
-
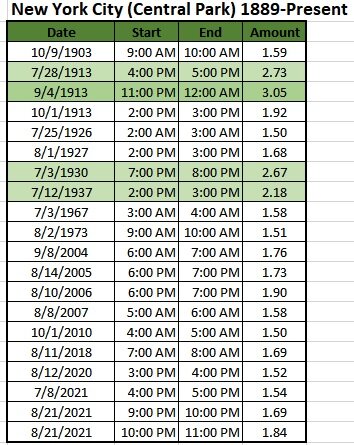
After reviewing hourly .PDF data that goes back to 1889, an extended Central Park record of hourly rainfall of 1.50” or above. The electronic database only goes back to 1943. Note: all hours are in standard time.
-
Morning thoughts… The rain has departed, but heat and humidity have arrived… Today will be mostly sunny and very warm. High temperatures will likely reach the upper 80s and lower 90s in most of the region. Likely high temperatures around the region include: New York City (Central Park): 89° Newark: 94° Philadelphia: 93° Normals: New York City: 30-Year: 82.5°; 15-Year: 82.2° Newark: 30-Year: 83.8°; 15-Year: 83.8° Philadelphia: 30-Year: 85.0°; 15-Year: 84.6° The very warm weather will continue through Friday.
-
It’s here between 4 pm and 5 pm: https://www.ncei.noaa.gov/pub/orders/IPS/IPS-74711DFB-9854-456D-9E64-CB10A972122E.pdf 9/4/1913 has 3.05” between 11 pm and 12 am.
-
There was a 2.73” hourly amount on July 28, 1913.
-
Henri moved away from the region after producing the highest 3-day summer rainfall on record in Central Park. During August 21-23, 8.19" of rain was measured. That easily surpassed the prior 3-day summer record of 7.20" from August 11-13, 1955. South of New York City, temperatures soared well into the 80s and 90s. Baltimore, Harrisburg, Newark, Philadelphia, and Washington, DC all saw the thermometer reach 90° or above. That heat will move northward tomorrow. Much of the remainder of this week will feature unseasonably warm temperatures. 90° Days for Select Cities (through August 23): Albany: 4 (2020: 13 days; 5-Year Average: 13.6 days) Allentown: 21 (2020: 24 days; 5-Year Average: 27.6 days) Baltimore: 44 (2020: 46 days; 5-Year Average: 44.6 days) Boston: 20 (2020: 14 days; 5-Year Average: 17.2 days) Bridgeport: 10 (2020: 11 days; 5-Year Average: 13.4 days) Burlington: 9 (2020: 20 days; 5-Year Average: 13.0 days) Harrisburg: 29 (2020: 35 days; 5-Year Average: 30.6 days) Hartford: 21 (2020: 39 days; 5-Year Average: 29.0 days) Islip: 6 (2020: 8 days; 5-Year Average: 9.4 days) New York City-JFK: 8 (2020: 12 days; 5-Year Average: 10.2 days) New York City-LGA: 21 (2020: 34 days; 5-Year Average: 29.4 days) New York City-NYC: 14 (2020: 20 days; 5-Year Average: 18.2 days) Newark: 34 (2020: 32 days; 5-Year Average: 31.2 days) Philadelphia: 32 (2020: 36 days; 5-Year Average: 34.6 days) Scranton: 16 (2020: 25 days; 5-Year Average: 16.4 days) Washington, DC: 40 (2020: 46 days; 5-Year Average: 50.8 days) New York City-Newark Average: 20 (2020: 22 days) ...Expected: 21 (based on regression equation tied to JFK-LGA-EWR data) The ENSO Region 1+2 anomaly was -0.1°C and the Region 3.4 anomaly was -0.9°C for the week centered around August 18. For the past six weeks, the ENSO Region 1+2 anomaly has averaged +0.41°C and the ENSO Region 3.4 anomaly has averaged -0.43°C. Neutral ENSO conditions will likely prevail into mid-September. Afterward, La Niña could begin to develop. The SOI was +5.04 today. The preliminary Arctic Oscillation (AO) figure was -1.173 today. On August 21 the MJO was in Phase 2 at an amplitude of 0.963 (RMM). The August 20-adjusted amplitude was 1.443 (RMM). Based on sensitivity analysis applied to the latest guidance, there is an implied 83% probability that New York City will have a warmer than normal August (1991-2020 normal). August will likely finish with a mean temperature near 77.3° (1.3° above normal).
-
This report suggests that 1.46” was the hourly figure on 8/12/1926 not 2.48” (p.91).
-
This shows that there is potentially a lot of good information that could become accessible to researchers and the public with a large-scale digitization effort.
-
You’re welcome. In the end, yesterday saw 2.67” of rain (very little prior to 9 am).
-
Central Park has 3-day rainfall of 8.05” through 10 am.
- 1,603 replies
-
- 2
-

-
- hurricane gusts
- flooding rains
- (and 2 more)
-
Yes. That’s correct.
-
Morning thoughts… More August rainfall records are being washed away at Central Park this morning… The August 21-22, 2021 rainfall total of 7.12” swept away the old 2-day August record of 6.87”, which was set during August 27-28, 2011. Through 7 am EDT, New York City’s 3-day total had reached 7.92”. That easily surpasses the old 3-day August mark of 7.20”, which was set during August 11-13, 1955. Additional rain and showers are likely in the northern Middle Atlantic region and southern New England as Henri gradually moves away from the region. Farther south, clouds will break this morning. New York City could see clouds break during the afternoon or evening. High temperatures will likely reach the upper 70s to middle 80s in most of the region. Likely high temperatures around the region include: New York City (Central Park): 79° Newark: 85° Philadelphia: 86° Normals: New York City: 30-Year: 82.6°; 15-Year: 82.3° Newark: 30-Year: 84.0°; 15-Year: 84.0° Philadelphia: 30-Year: 85.0°; 15-Year: 84.7° Tomorrow mostly sunny and very warm.
-
That source is way off for today’s rainfall. At 4 pm, the daily climate summary showed 1.90”. More fell since then. 000 CDUS41 KOKX 222034 CLINYC CLIMATE REPORT NATIONAL WEATHER SERVICE NEW YORK, NY 434 PM EDT SUN AUG 22 2021 ................................... ...THE CENTRAL PARK NY CLIMATE SUMMARY FOR AUGUST 22 2021... VALID TODAY AS OF 0400 PM LOCAL TIME. CLIMATE NORMAL PERIOD 1991 TO 2020 CLIMATE RECORD PERIOD 1869 TO 2021 WEATHER ITEM OBSERVED TIME RECORD YEAR NORMAL DEPARTURE LAST VALUE (LST) VALUE VALUE FROM YEAR NORMAL ................................................................... TEMPERATURE (F) TODAY MAXIMUM 76 408 AM 95 1916 83 -7 88 MINIMUM 71 253 PM 52 1895 68 3 73 AVERAGE 74 76 -2 81 PRECIPITATION (IN) TODAY 1.90R 1.85 1994 0.14 1.76 T MONTH TO DATE 7.81 3.31 4.50 4.24 SINCE JUN 1 21.52 12.45 9.07 12.58 SINCE JAN 1 39.42 31.62 7.80 26.97
-
There will probably be a pause in NYC until Henri starts heading east again.
- 1,603 replies
-
- 2
-
-
- hurricane gusts
- flooding rains
- (and 2 more)
-
The generated chart is what is in the database. I am not sure where the differences arise.
- 1,603 replies
-
- 1
-

-
- hurricane gusts
- flooding rains
- (and 2 more)
-
New York City's Central Park received its largest 2-day August rainfall on record. Through 8 pm, 7.04" had fallen. That broke the previous 2-day August record of 6.87", which was set on August 27-28, 2011. In addition, Central Park set a new hourly mark of 1.94" rain yesterday. Daily rainfall records included: Hartford: 3.15" (old record: 1.95", 1937) New York City-JFK: 2.26" (old record: 2.00", 1994) New York City-NYC: 2.59" (old record: 1.85", 1994) Newark: 2.39" (old record: 1.70", 1994) Tomorrow will see clouds break for sunshine. It will turn noticeably warmer. There could still be a shower or thunderstorm. The ENSO Region 1+2 anomaly was +0.1°C and the Region 3.4 anomaly was -0.4°C for the week centered around August 11. For the past six weeks, the ENSO Region 1+2 anomaly has averaged +0.45°C and the ENSO Region 3.4 anomaly has averaged -0.28°C. Neutral ENSO conditions will likely prevail into mid-September. The SOI was +3.46 today. The preliminary Arctic Oscillation (AO) figure was -0.833 today. On August 20 the MJO was in Phase 2 at an amplitude of 1.447 (RMM). The August 19-adjusted amplitude was 1.637 (RMM). Based on sensitivity analysis applied to the latest guidance, there is an implied 83% probability that New York City will have a warmer than normal August (1991-2020 normal). August will likely finish with a mean temperature near 77.3° (1.3° above normal).
-
No. From 10-11 pm, 1.38” fell. From 11 pm-midnight 1.94” fell.
- 1,603 replies
-
- 1
-
-
- hurricane gusts
- flooding rains
- (and 2 more)
-
Large parts of the parkway are now flooded.
- 1,603 replies
-
- 1
-

-
- hurricane gusts
- flooding rains
- (and 2 more)