

donsutherland1
-
Posts
23,782 -
Joined
Content Type
Profiles
Blogs
Forums
American Weather
Media Demo
Store
Gallery
Everything posted by donsutherland1
-
Hopefully, it will hold to the EPO- idea. Unfortunately, the long-range EPS is often prone to show an EPO- that ultimately does not materialize. We'll probably know more in a few more days.
-
Probably.
-
Yes.
-
FYI, the NWS is looking into the difference. As soon as I learn more, I will post the outcome.
-
Yes, I am aware of it. However, Denver's media outlets have also gone with 232 days (which fits the daily data I noted). That's why I think the site is in error. One example: https://www.9news.com/article/weather/weather-colorado/203-days-no-snow-in-denver/73-5acd5882-1d50-4862-80fa-56b669f25343
-
That seems to be an error. The daily data shows 0.1” on March 4, 1887 and 0.3” on October 23, 1887. That is 232 days without measurable snowfall.
-
The longest stretch between measurable snowfalls is 232 days. Measurable snowfall is likely very late Thursday or on Friday.
-
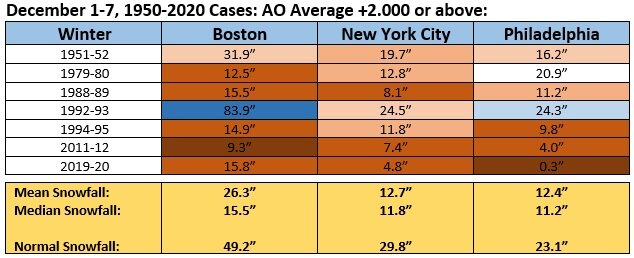
The preliminary December 1-7 average for the Arctic Oscillation (AO) is +2.570. Historically, that has been an ominous indication that seasonal snowfall in the major cities of the Northeast (from Philadelphia to Boston) would come in below to much below normal.
-
Morning thoughts… Today will be partly to occasionally mostly cloudy and noticeably cooler. High temperatures will likely reach the lower and middle 40s in most of the region. Likely high temperatures around the region include: New York City (Central Park): 42° Newark: 45° Philadelphia: 45° Normals: New York City: 30-Year: 46.7°; 15-Year: 47.2° Newark: 30-Year: 47.2°; 15-Year: 47.9° Philadelphia: 30-Year: 48.4°; 15-Year: 49.1° A system will likely bring some light snow or flurries to the region tomorrow. Little or no accumulation (0.5” or less) is likely in most of the region. Eastern New England could see 1”-3”.
-
Not in 2009-10. DC got more than Denver in 1910-11.
-
That has occurred 10 times. The most recent winter was 2009-10 when Washington, DC received 56.1” of snow and Boston saw 35.7”.
-
It’s rare. Denver has never had to wait so long for its first measurable snowfall, which should finally occur later this week. There is one winter where Washington, DC saw more snowfall than Denver (1910-11).
-
Cooler air will return tonight and tomorrow. Afterward, a system could bring light snow to parts of the region on Wednesday. A coating to an inch is possible even in Newark, New York City, and Philadelphia. Some pockets of 1"-3" amounts are possible. Eastern New England will likely see 1"-3" with some locally higher amounts. No Arctic blasts appear likely for the foreseeable future. Overall, through December 20th, temperatures will likely be warmer than normal in the means with some short-lived cool shots. First measurable snowfall statistics for select cities: Allentown: Normal: December 6; 2020-21: December 9 Bridgeport: Normal: December 3; 2020-21: December 16 Islip: Normal: December 10; 2020-21: December 16 New York City: Normal: December 13; 2020-21: December 16 Newark: Normal: December 9; 2020-21: December 9; 2021-22: November 28 Philadelphia: Normal: December 19; 2020-21: December 16 Out West, Denver has yet to see its first measurable snowfall through December 5. The previous record latest first measurable snowfall occurred on November 21, 1934. The progression of Denver's latest first measurable snowfall of the season is as follows: November 11, 1882 November 16, 1894 November 19, 1931 November 21, 1934 The base case is that the closing 10 days of December could turn cooler, though not necessarily cold. Uncertainty is higher than usual. The evolution of the EPO and AO beyond mid-month will likely determine the outcome for much of the remainder of the month. Although the MJO moved into Phase 6 at a very high amplitude in recent days, the sample size of cases where the MJO moved into Phase 6 at an amplitude of 1.75 or above during December 1-15 is very small (n=5). Moreover, just a single case occurred during a predominantly EPO+/AO+ pattern and none occurred during a La Niña. Among those five cases, two had a cold or very cold December 21-31 period, one saw near normal conditions, and two had warm conditions. In short, the current high amplitude MJO does not provide a clear signal where things are headed. Following very wet July-September periods, winter (December-February) precipitation has typically been near or below normal. The most recent exception was winter 2018-19. The ENSO Region 1+2 anomaly was -1.1°C and the Region 3.4 anomaly was -0.9°C for the week centered around December 1. For the past six weeks, the ENSO Region 1+2 anomaly has averaged -0.87°C and the ENSO Region 3.4 anomaly has averaged -0.92°C. La Niña conditions will likely persist into at least late winter. The SOI was +16.66 today. The preliminary Arctic Oscillation (AO) figure was +3.061 today On December 4 the MJO was in Phase 6 at an amplitude of 2.199 (RMM). The December 3-adjusted amplitude was 2.280 (RMM).
-
The AmericanWx.com consensus for the December temperature anomalies (widespread warm anomalies) is looking good. https://www.americanwx.com/bb/topic/56292-december-2021-temperature-forecast-contest-and-winter-snowfall-contest/?do=findComment&comment=6197054
-
It is. That’s what one would expect: warmer autumns and a warmer start to winter.
-
The warming of December temperatures is also well-reflected in the number of 40-degree Decembers. Since 1869, there have been 22 such cases. 11 have occurred since 1990 with 7 having occurred since 2000.
-
Morning thoughts… Today will be mostly cloudy and unseasonably warm. Showers are likely early this morning and again later in the day. High temperatures will likely reach the lower and middle 60s in most of the region. Likely high temperatures around the region include: New York City (Central Park): 61° Newark: 65° Philadelphia: 66° Normals: New York City: 30-Year: 47.1°; 15-Year: 47.5° Newark: 30-Year: 47.6°; 15-Year: 48.2° Philadelphia: 30-Year: 48.7°; 15-Year: 49.4° Tomorrow will be noticeably cooler. A system could bring a coating to 1” of snow to parts of the region on Wednesday.
-
Very likely, but it isn’t responsible nor professional. It puts marketing ahead of scientific integrity.
-
Moving from a possible coating to an inch to 1”-3” does not translate into a significant snowfall.
-
From the related article: Wednesday has the potential to cause a bit of havoc for the tri-state with the chance of the city and surrounding counties seeing "significant" snowfall if the current incoming system stays the course, Storm Team 4 says. Three factors argue for a very low probability of significant (6” or greater) snowfall: 1. The current pattern. The fast flow and absence of blocking will not allow any system to stay around sufficiently long to produce a significant snowfall. 2. The most snowfall for NYC during the December 1-20 period with an EPO+, AO+, PNA- was 4.7”. One would need very strong evidence to set aside historic experience. Such evidence does not exist (see #3). 3. Aside from two GFS runs, the guidance favors a light event. Out of the 51 EPS members, just one shows 3” of snow and 3 show 1” or more. 26 show no measurable snowfall (12/5 12z run). The headline and article do not serve the NYC area well.
-
The January and February ECMWF monthlies aren’t very encouraging either. Fortunately, much can change between now and January/February.
-
Following some overnight showers, temperatures could soar into the 60s in much of the region tomorrow before cooler air returns. Afterward, a system could bring light rain and snow to parts of the region on Wednesday. A small accumulation is possible even in Newark and New York City. No Arctic blasts appear likely for the foreseeable future. Overall, through December 20th, temperatures will likely be warmer than normal in the means with some short-lived cool shots. First measurable snowfall statistics for select cities: Allentown: Normal: December 6; 2020-21: December 9 Bridgeport: Normal: December 3; 2020-21: December 16 Islip: Normal: December 10; 2020-21: December 16 New York City: Normal: December 13; 2020-21: December 16 Newark: Normal: December 9; 2020-21: December 9; 2021-22: November 28 Philadelphia: Normal: December 19; 2020-21: December 16 Out West, Denver has yet to see its first measurable snowfall through December 4. The previous record latest first measurable snowfall occurred on November 21, 1934. The progression of Denver's latest first measurable snowfall of the season is as follows: November 11, 1882 November 16, 1894 November 19, 1931 November 21, 1934 The base case is that the closing 10 days of December could turn cooler, though not necessarily cold. Uncertainty is higher than usual. The evolution of the EPO and AO beyond mid-month will likely determine the outcome for much of the remainder of the month. Although the MJO moved into Phase 6 at a very high amplitude in recent days, the sample size of cases where the MJO moved into Phase 6 at an amplitude of 1.75 or above during December 1-15 is very small (n=5). Moreover, just a single case occurred during a predominantly EPO+/AO+ pattern and none occurred during a La Niña. Among those five cases, two had a cold or very cold December 21-31 period, one saw near normal conditions, and two had warm conditions. In short, the current high amplitude MJO does not provide a clear signal where things are headed. Following very wet July-September periods, winter (December-February) precipitation has typically been near or below normal. The most recent exception was winter 2018-19. The ENSO Region 1+2 anomaly was -1.0°C and the Region 3.4 anomaly was -0.7°C for the week centered around November 24. For the past six weeks, the ENSO Region 1+2 anomaly has averaged -0.80°C and the ENSO Region 3.4 anomaly has averaged -0.90°C. La Niña conditions will likely persist into at least late winter. The SOI was +15.67 today. The preliminary Arctic Oscillation (AO) figure was +2.499 today On December 3 the MJO was in Phase 6 at an amplitude of 2.274 (RMM). The December 2-adjusted amplitude was 2.072 (RMM).
-
At present, things still appear on track for a light accumulation. But we’ll have a far better idea within 48-72 hours.
-
Morning thoughts… Today will be partly cloudy and pleasant. High temperatures will likely reach the upper 40s and lower 50s in most of the region. Likely high temperatures around the region include: New York City (Central Park): 48° Newark: 51° Philadelphia: 52° Normals: New York City: 30-Year: 47.4°; 15-Year: 47.8° Newark: 30-Year: 47.9°; 15-Year: 48.5° Philadelphia: 30-Year: 49.0°; 15-Year: 49.7° Tomorrow will be very mild, but cooler air will return afterward. A system could bring some snow to the region on Wednesday.
-
It’s a low probability situation, but some snow would still be better than none. I am looking forward to tonight’s guidance.


