

donsutherland1
-
Posts
23,758 -
Joined
Content Type
Profiles
Blogs
Forums
American Weather
Media Demo
Store
Gallery
Everything posted by donsutherland1
-
2025-2026 ENSO
donsutherland1 replied to 40/70 Benchmark's topic in Weather Forecasting and Discussion
Beware of the latest ill-informed Social Media hype: No "big" snowstorm is likely for the Northeast during January 15-16. Key factors argue against it: 1) The AO-/PNA+ pattern is just getting established. The trough is not likely to be sufficiently sharp. 2) There are numerous areas of vorticity competing with one another. The probability that the various areas of vorticity will develop into a single consolidated low that takes an ideal track for a classic NE snowstorm is low. Notice that only the operational GFS was shown. Moreover, large splashes of color on vorticity maps don't always translate into surface potential. There's a lot involved for the upper levels and surface to become aligned. 3) The realistic scenarios have been available for some time, even as the exact solution cannot yet be pinned down. During the 1/11 0z EPS cycle, a single ensemble member had 6"+ snow (none had 10"+) and during the 1/11 12z EPS cycle, no ensemble members had 6"+ snowfall in New York City. For Boston, the figures were 6 and 4 members respectively. Bottom line: the probability of a significant NE snowstorm is low; the probability of a major NE snowstorm is extremely low. What's far more likely than a big snowstorm is the idea that there will be periods of precipitation that transition to periods of snow, as some areas could start as light rain. A light accumulation is plausible in the New York City area. Details are uncertain, but a 1"-3"/2"-4" type snowfall would be vastly more likely than a 6"+ one. Southeast New England has a better chance of seeing a moderate accumulation. Even if some areas of 6" or above snows develop over a portion of SE New England, the areal coverage of such amounts will likely be limited. By no definition will this be a classic NE snowstorm. It won't be something that would be placed in the iconic KU Northeast Snowstorms books. Best guess from this far out: At most, maybe one of the following locations will see 6" or above snowfall during January 15-16: Baltimore, Boston, New York City, Newark, Philadelphia, Washington, DC. Most will see < 3" of snow. That's not a "big one." By the way, that's the same outfit that ignored the guidance and also failed to understand how a PNA- teleconnection translates downstream (SE ridge/warmth in the SE), and said that places like Atlanta would have a much colder than normal January. January 1-10 has a mean anomaly just above 12° above normal in Atlanta. Just for January 2026 to reach normal, Atlanta would need to experience its coldest January 11-31 since 1985! Again, as noted ad nauseum, anyone can play forecaster on social media. There, "clicks" and "views," not knowledge, skill, or accuracy are the currency of value. Entertainment value not quality of information is promoted and monetized. Hence, it's no surprise whatsover that what might become a moderate storm, if things work out (still not assured), is being hyped as a potential "big one."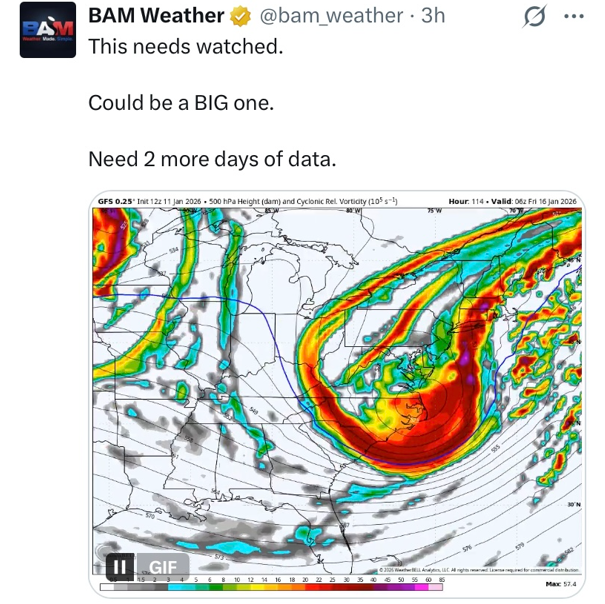
-
A snow squall has moved into the Binghamton area. Rain and snow showers remain possible across the NYC area later this afternoon or early this evening with the frontal passage.

-
The model should use the 4dVAR initialization scheme used by the leading models (ECMWF, GGEM, UKMET). It's difficult to justify not using the best-in-field initialization at this point in time. The inferior initialization puts the model at a disadvantage right from the start. Once the GGEM moved to the 4dVAR initialization, along with other changes that were made, it rocketed to the #2 model in terms of key verification metrics.
-
Barring some big changes in the guidance, it continues to appear that the Thursday-Friday period will see some precipitation, but probably < 0.50". A series of waves should move along a slow-moving front, but the consolidated low will likely develop too far offshore for a more significant impact. Larger impacts remain more likely across southeastern and eastern New England. Currently, fewer than 20% of EPS ensemble members show 0.50" or more QPF for the New York City area. The 1/11 0z EPS ensemble mean QPF was pretty close to the 16z NBM output. Overall, there remains little evidence that a pattern conducive to large snowstorms coupled with the ingredients necessary will be in place by the January 15-16 timeframe. Nevertheless, rain showers could transition to snow showers or even some periods snow around the New York City area and its immediate suburbs. A light accumulation of snow is plausible. More immediately, a line of rain and/or snow showers accompanying a frontal passage appears likely to cross the region late this afternoon or early this evening coupled with gusty winds. No accumulation is likely in and around NYC, but temperatures should fall from the middle 40s into the upper 30s or lower 40s during the frontal passage.
-
2025-2026 ENSO
donsutherland1 replied to 40/70 Benchmark's topic in Weather Forecasting and Discussion
Amidst all the discussion of a possible strong WWB this month, the development of a pretty strong EWB slipped under the radar. In fact, the past two days have seen the SOI at or above +20. Interestingly enough, a slightly weaker EWB (just below +20) preceded the record-January WWB of 2017 by about a week. -
Yesterday, JFK Airport, LaGuardia Airport, and Newark all had highs of 53°. That followed their having identical highs of 54° a day earlier. The last time all three sites had identical highs on two consecutive days was November 11-12, 2025 when the highs were 42° and 51° respectively.
-
2025-2026 ENSO
donsutherland1 replied to 40/70 Benchmark's topic in Weather Forecasting and Discussion
Right now, the NAO still appears likely to be mainly positive. It wouldn't be a "deal-breaker."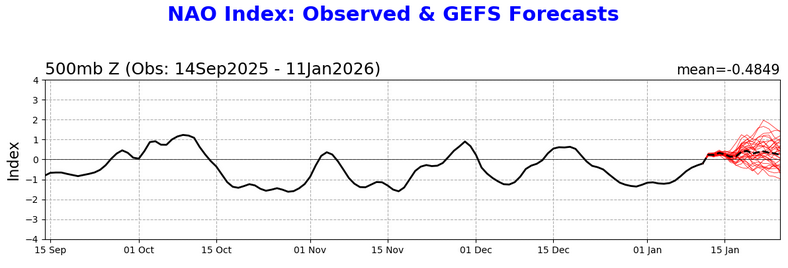
-
2025-2026 ENSO
donsutherland1 replied to 40/70 Benchmark's topic in Weather Forecasting and Discussion
The PNA has gone positive with a value of +0.173. As noted previously, all 10 long-duration winter PNA- regimes (25 or more consecutive days) have been followed by a regime change to positive with more than two-thirds of the succeeding 30 days being above 0.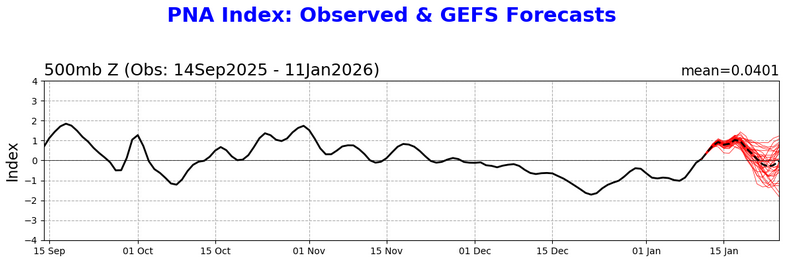
-
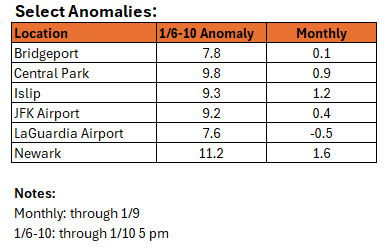
Here you go. Note: I don't have data for Morristown.
-
An orderly pattern progression remains underway. The warm anomalies peaked yesterday with temperatures running 12.6° above normal in Central Park. In the extended range, that progression should culminate in a return to colder weather with persistently below normal temperatures. Rain and showers will end early tomorrow. Rainfall remains on track for a storm-total 0.50"-1.00" rainfall across much of the region by the time the last showers depart early tomorrow. Through the middle of next week, highs will generally reach the 40s during the daytime and 30s for lows in New York City. Somewhat colder readings are likely outside the City and in areas where strong radiational cooling takes place. After the middle of next week, temperatures will "step down" with highs mainly in the middle and upper 30s in New York City and lows in the middle and upper 20s. Some light precipitation is possible on Friday. No significant Arctic blasts or significant snowfalls are likely through at least mid-January. Afterward, conditions might become more favorable for both cold and snowfall, especially if the PNA goes positive. PNA-related developments would have larger implications for snowfall. A persistently positive PNA would have above climatological risk of moderate or significant snowfalls. A mainly negative PNA would favor mainly small snowfalls. It will likely be another day or two before the guidance reaches the high-skill timeframe for teleconnection forecasts. The ENSO Region 1+2 anomaly was -0.7°C and the Region 3.4 anomaly was -0.5°C for the week centered around December 31. For the past six weeks, the ENSO Region 1+2 anomaly has averaged -0.37°C and the ENSO Region 3.4 anomaly has averaged -0.63°C. La Niña conditions will likely continue into at least late winter. The SOI was +21.91 today. The preliminary Arctic Oscillation (AO) was -2.082 today. Based on sensitivity analysis applied to the latest guidance, there is an implied near 58% probability that New York City will have a cooler than normal January (1991-2020 normal). January will likely finish with a mean temperature near 33.3° (-0.4° below normal). Supplemental Information: The projected mean would be 0.7° above the 1981-2010 normal monthly value.
-
That CPC had no heavy snowfall threats on its 3-7 day hazards outlook suggestes that the CPC also believes the latter system poses a greater winter weather risk.
-
This morning's AFD form NWS New York essentially underscores the point made yesterday that at the timeframes involved for potential events (earliest being January 15-16), the guidance cannot reliably resolve the synoptic details. Ultimately, those details are crucial. There's better confidence in the overall longwave pattern, but that's not enough to get to specific forecasting details. In this context, when using 500 mb vorticity maps, they currently provide insight more along the lines of what could happen vs. what is likely to happen. Over the next 48-72 hours, reliability and model skill will rise to the point where details can be resolved. Having said this, based on the continuing pattern evolution, my thinking remains that it will be tough to get everything aligned for a significant (6" or above) snowfall Thursday-Friday. Nothing new or significant has emerged to change that general idea. The potential follow-up wave has a better chance of producing measurable and perhaps even a moderate snowfall. More of the 1/10 0z EPS and GEFS individual ensemble members favored the second wave. None of them showed a major snowstorm for either wave. A small handful suggested that the second wave could be significant. NWS: Towards Wednesday night into early Thursday the longwave pattern amplifies as the ridge out west sharpens, and the trough in the east amplifies in turn. This amplification is supported by the consensus of global NWP and AI guidance. At this time it is difficult to time the wave packets, and thus the timing, position and strength of storm development. Much of the guidance is suggesting the frontal boundary slowing and the development of low pressure with the amplification of the pattern with the upper level flow becoming more or less parallel to the front. Suffice it to say there remains a chance of precipitation, with precipitation type remaining uncertain during this time frame. Therefore impacts are not known at this time.
-
2025-2026 ENSO
donsutherland1 replied to 40/70 Benchmark's topic in Weather Forecasting and Discussion
The preliminary value for the PNA has risen to -0.019. Based on the final December data and preliminary January data, today is the 34th consecutive day that the PNA has been negative. That streak will likely end tomorrow. All 10 long-duration winter PNA- regimes (25 or more consecutive days) have been followed by a regime change to positive with more than two-thirds of the succeeding 30 days being above 0. The outcome will have potentially large implications for the risk of significant or greater snowstorms in the East, especially the Mid-Atlantic Region. For example, for Baltimore, New York City, Philadelphia, and Washington, DC, there have been 9 storms since 1950 that brought 6" or more snow to three or all four of those cities. None had a PNA-. For the 14 cases where 2 of those cities saw 6" or more snow, 10/14 (71%) of those storms had a PNA+. The most recent PNA- event was the long-duration January 31-February 4, 2021 storm. There were no cases where 2 or more of those cities saw 10" or more snow when the PNA was < 0.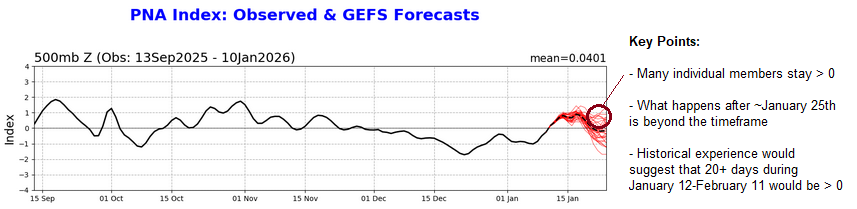
-
Central Park, JFK Airport, LaGuardia Airport, and Newark had identical high temperatures yesterday. The last time that occurred was July 26, 2025 when all four locations had highs of 85°. Yesterday was the fifth time that all four locations had identical highs of 54°. Those dates were: November 4, 1949 March 23, 1954 February 19, 2011 March 9, 2015 January 9, 2026
-
2025-2026 ENSO
donsutherland1 replied to 40/70 Benchmark's topic in Weather Forecasting and Discussion
I sure hope not. -
January 2026 regional war/obs/disco thread
donsutherland1 replied to Baroclinic Zone's topic in New England
I'm sorry to read about the counterproductive nature of a deleted post here. I believe it's fantastic that meteorologists such as @brooklynwx99 share their thoughts, insights, and expertise here. Their time is valuable. Their freely sharing thoughts and exchanging ideas in the forums and subforums is highly generous. They are under no obligation to do so. Their contributions make AmericanWx more than a mere discussion board. If one disagrees with a participant's ideas, there are respectful ways to express dissent, if one feels the need to do so. Civility is not difficult. Moreover, one is always free to offer his or her own ideas. In most professional settings, the existence of differing views is a powerful organizational asset. Moreover, because organizational culture is intangible in nature, it can be a tremendous and sustainable source of competitive advantage. After all, when employees and teams feel comfortable in sharing their ideas, are sufficiently mature to respect differences in thinking, and focused on the larger organizational goals, which drive them to develop common solutions by leveraging the full range of thinking, they tend to be better problem-solvers, more creative, more productive, and more satisfied. The company also tends to do better on financial and non-financial metrics than would otherwise be the case. Everyone has blind spots. A larger range of ideas can fill those spots and also help one improve one's own thinking. Certainly, many of the posts, meteorologists and other members here have allowed me to do so. I can never thank them enough. -
An orderly pattern progression remains underway. In the extended range, that progression should culminate in a return to colder weather with persistently below normal temperatures. A storm heading through the Great Lakes will bring rain tomorrow into early Sunday. A general 0.50"-1.00" rainfall appears likely across much of the region. Through the middle of next week, highs will generally reach the 40s during the daytime and 30s for lows in New York City. Somewhat colder readings are likely outside the City and in areas where strong radiational cooling takes place. After the middle of next week, temperatures will "step down" with highs mainly in the middle and upper 30s in New York City and lows in the middle and upper 20s. No significant Arctic blasts or significant snowfalls are likely through at least mid-January. Afterward, conditions might become more favorable for both cold and snowfall, especially if the PNA goes positive. PNA-related developments would have larger implications for snowfall. A persistently positive PNA would have above climatological risk of moderate or significant snowfalls. A mainly negative PNA would favor mainly small snowfalls. It will likely be a few more days before the guidance reaches the high-skill timeframe for teleconnection forecasts. The ENSO Region 1+2 anomaly was -0.7°C and the Region 3.4 anomaly was -0.5°C for the week centered around December 31. For the past six weeks, the ENSO Region 1+2 anomaly has averaged -0.37°C and the ENSO Region 3.4 anomaly has averaged -0.63°C. La Niña conditions will likely continue into at least late winter. The SOI was +4.62 today. The preliminary Arctic Oscillation (AO) was -1.466 today. Based on sensitivity analysis applied to the latest guidance, there is an implied near 55% probability that New York City will have a cooler than normal January (1991-2020 normal). January will likely finish with a mean temperature near 33.4° (-0.3° below normal). Supplemental Information: The projected mean would be 0.8° above the 1981-2010 normal monthly value.
-
2025-2026 ENSO
donsutherland1 replied to 40/70 Benchmark's topic in Weather Forecasting and Discussion
Like you, I expect that a shift in ENSO should break the drought/persistent dryness. -
Although the events are still outside ability of the operational guidance to reliably resolve the synoptic details, the 12z guidance continues to be encouraging. It it consistent with the ongoing and incredibly orderly pattern evolution that has been underway since the start of January. In that evolution, cold should begin to return next week. Afterward, as the PNA rises, opportunities for snowfall should begin to increase. As noted previously, both severe cold and significant snowfall are unlikely through at least mid-January. The transition to a more wintry pattern probably won't be completed by then. But shortly afterward, the probability of snowfall should increase. The probability of moderate or significant snowfalls would be higher if a PNA+ can develop and then be sustained. Arctic air might begin to get involved around or after January 20th. The overall consensus in the guidance is that a general WPO-/EPO-/AO- pattern will develop just after mid-month. Such patterns in combination with a PNA+ are 1.7 times more likely to see one or more days with a 4" or above snowfall than when combined with a PNA-. Regardless of the state of the PNA, those patterns have seen measurable snowfall nearly once every five days, which is 1.6X climatology (1980-2025). As for the 12z GFS's systems during the roughly 168-hour and 222-hour timeframes, it's far too soon to resolve details. That there's activity is sufficient. In general, if things progress as has often occurred during the kind of pattern evolution described above, a delay in the first event would allow the trough more time to sharpen before the storm's development/arrival. That would increase prospects of its having a more impactful track than shown on the 12z GFS. The second system, as things currently stands, likely has the higher probability of taking an impactful track. Although its solution is different, the latter timeframe has support from the GGEM. Model skill at that timeframe is low. For now, it's more useful to stick with the overall pattern progression described above, avoid speculating over synoptic details that the guidance cannot resolve at these timeframes, and leave the details concerning potential events for later. That there's potential is what's both important and encouraging.
-
2025-2026 ENSO
donsutherland1 replied to 40/70 Benchmark's topic in Weather Forecasting and Discussion
Social media noise about pattern chaos and dramatic shifts in social media videos notwithstanding, I am impressed how drama-free and orderly the pattern progression has been so far this month. The East was supposed to experience a thaw of about a week or so. That's playing out nicely. Afterward, a gradual transition toward colder but not severely cold weather was expected to occur. That's poised to play out. Most of the southern tier with the exception of the Southwest where a well-signaled intrusion of cold is now underway, was expected to stay mild. It has. Going forward, the progression toward cold from the Great Lakes to the Northeast (Mid-Atlantic and New England) remains on course. No significant Arctic outbreaks or snowstorms are likely through mid-month. Afterward, there is potential for the cold pattern to become snowy, but that's where the largest uncertainty rests. If the PNA undergoes a regime change to predominantly positive values near or after mid-month, prospects for East Coast snowstorms would increase. If not, frequent, but smaller snowfalls would be the norm. An WPO-/EPO-/AO- pattern is generally cold regardless of the PNA except in the Southeast (PNA+ is cold). By the end of this weekend, one should have higher confidence in the PNA evolution. Historically, a regime change is favored following the break in long-duration winter PNA- periods. But one cannot rule out a more unusual situation where the PNA only briefly goes positive before returning to its mainly negative state. However, extended range PNA forecasts which have low skill are insufficient. Overall, January still appears on course for a colder than normal outcome from the Great Lakes to New England. The southern tier from the desert southwest across to the Southeast will likely wind up with warm anomalies. Cold shots will still be possible, particularly in the Southeast as the month advances. Finally, with respect to the La Niña, the atmosphere remains well-coupled. The AAM- is powerful proof that things remain coupled. Nevertheless, the La Niña continues to fade, and that process will continue through the winter. Weekly figures could begin to reach values just below La Niña threshold during late January. A significant WWB is possible this month. If it occurs, it would be unusual but not unprecedented. One such WWB occurred during Winter 2016-17. That a WWB might occur won't necessarily mean that February has to be cold. February 2017 wound up being exceptionally warm. I do not expect that scenario this time around. The full range of variables easing influence of ENSO, teleconnections, etc., will determine the February 2026 outcome. -
A milder pattern is now in place. The remainder of the week will see generally above normal temperatures. A few showers are possible tomorrow. A more significant rainfall is likely Saturday into Sunday. Then, rainfall amounts will generally be between 0.50"-1.00". The work week will conclude with highs finishing in the 50s across much of the region tomorrow. Cooler air will likely return Sunday or Monday. No significant Arctic blasts or significant snowfalls are likely through at least mid-January. Afterward, conditions might become more favorable for both cold and snowfall, especially if the PNA goes positive. PNA-related developments would have larger implications for snowfall. A persistently positive PNA would have above climatological risk of moderate or significant snowfalls. A mainly negative PNA would favor mainly small snowfalls. It will likely be a few more days before the guidance reaches the high-skill timeframe for teleconnection forecasts. The ENSO Region 1+2 anomaly was -0.7°C and the Region 3.4 anomaly was -0.5°C for the week centered around December 31. For the past six weeks, the ENSO Region 1+2 anomaly has averaged -0.37°C and the ENSO Region 3.4 anomaly has averaged -0.63°C. La Niña conditions will likely continue into at least late winter. The SOI was +3.54 today. The preliminary Arctic Oscillation (AO) was -0.167 today. Based on sensitivity analysis applied to the latest guidance, there is an implied near 50% probability that New York City will have a cooler than normal January (1991-2020 normal). January will likely finish with a mean temperature near 33.5° (-0.2° below normal). Supplemental Information: The projected mean would be 0.9° above the 1981-2010 normal monthly value.
-
2025-2026 ENSO
donsutherland1 replied to 40/70 Benchmark's topic in Weather Forecasting and Discussion
Of course. WPO-/EPO- can force cold outcomes even with a positive AO and NAO. But if one is referring only to the general AO/NAO state, positive states are typically warmer, not colder regardless of ENSO. Other variables weren’t noted. -
2025-2026 ENSO
donsutherland1 replied to 40/70 Benchmark's topic in Weather Forecasting and Discussion
Cold is not favored in the East during February AO+/NAO+ dates. Nearly two thirds are warmer than normal. -
A milder pattern is now in place. The remainder of the week will see generally above normal temperatures. Some rain is likely Saturday into Sunday. Rainfall amounts will generally be between 0.50"-1.00". The week will conclude with highs finishing in the 50s across much of the region on Friday and Saturday. Cooler air will likely return Sunday or Monday. No significant Arctic blasts or significant snowfalls are likely through at least mid-January. Afterward, conditions might become more favorable for both cold and snowfall, especially if the PNA goes positive. PNA-related developments would have larger implications for snowfall. A persistently positive PNA would have above climatological risk of moderate or significant snowfalls. A mainly negative PNA would favor mainly small snowfalls. It will likely be a few more days before the guidance reaches the high-skill timeframe for teleconnection forecasts. The ENSO Region 1+2 anomaly was -0.7°C and the Region 3.4 anomaly was -0.5°C for the week centered around December 31. For the past six weeks, the ENSO Region 1+2 anomaly has averaged -0.37°C and the ENSO Region 3.4 anomaly has averaged -0.63°C. La Niña conditions will likely continue into at least late winter. The SOI was +2.31 today. The preliminary Arctic Oscillation (AO) was +0.377 today. Based on sensitivity analysis applied to the latest guidance, there is an implied near 50% probability that New York City will have a cooler than normal January (1991-2020 normal). January will likely finish with a mean temperature near 33.7° (at normal). Supplemental Information: The projected mean would be 1.1° above the 1981-2010 normal monthly value.
-
Great find, Tip. The underlying paper is here for anyone looking for a quick link: https://www.nature.com/articles/s41586-025-09895-y


