donsutherland1
-
Posts
23,765 -
Joined
Content Type
Profiles
Blogs
Forums
American Weather
Media Demo
Store
Gallery
Everything posted by donsutherland1
-
Generally near normal readings will prevail through the remainder of July. An offshore system will bring clouds and some showers tomorrow into Tuesday. Steadier rain is possible on Wednesday. Heat will likely return during the first week in August. The latest summer guidance continues to suggest a warmer to much warmer than normal summer lies ahead. The extended range guidance suggests that August will likely be warmer than normal. The ENSO Region 1+2 anomaly was -0.5°C and the Region 3.4 anomaly was 0.2°C for the week centered around July 17. For the past six weeks, the ENSO Region 1+2 anomaly has averaged -0.47°C and the ENSO Region 3.4 anomaly has averaged +0.25°C. Neutral ENSO conditions will likely evolve into a La Niña event during the late summer or early fall. The SOI was -23.95 today. The preliminary Arctic Oscillation (AO) was +0.975 today. Based on sensitivity analysis applied to the latest guidance, there is an implied near 100% probability that New York City will have a warmer than normal July (1991-2020 normal). July will likely finish with a mean temperature near 79.5° (2.0° above normal).
-
Generally near normal readings will prevail through the weekend. An offshore system could bring clouds and some showers early next week, but it remains possible that the storm will pass far enough to the east to avoid bringing showers to much of the region. Heat will likely return during the first week in August. The latest summer guidance continues to suggest a warmer to much warmer than normal summer lies ahead. Some of the extended range guidance suggests that August could be warmer to much warmer than normal. The ENSO Region 1+2 anomaly was -0.5°C and the Region 3.4 anomaly was 0.2°C for the week centered around July 17. For the past six weeks, the ENSO Region 1+2 anomaly has averaged -0.47°C and the ENSO Region 3.4 anomaly has averaged +0.25°C. Neutral ENSO conditions will likely evolve into a La Niña event during the late summer or early fall. The SOI was -1.17 today. The preliminary Arctic Oscillation (AO) was +1.002 today. Based on sensitivity analysis applied to the latest guidance, there is an implied near 100% probability that New York City will have a warmer than normal July (1991-2020 normal). July will likely finish with a mean temperature near 79.6° (2.1° above normal).
-
Phoenix Experiences its Hottest June on Record
donsutherland1 replied to donsutherland1's topic in Climate Change
Portland is also seeing a noticeable increase in 90-degree days.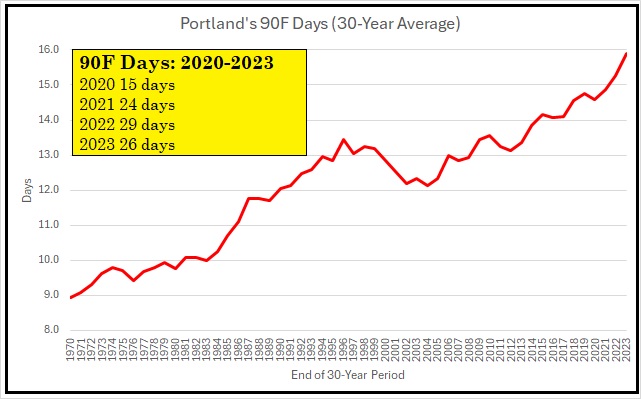
-
Generally near normal readings will prevail through the weekend. An offshore system could bring clouds and some showers early next week, but it remains possible that the storm will pass far enough to the east to avoid bringing showers to much of the region. Heat will likely return during the first week in August. The latest summer guidance continues to suggest a warmer to much warmer than normal summer lies ahead. Some of the extended range guidance suggests that August could be warmer to much warmer than normal. The ENSO Region 1+2 anomaly was -0.5°C and the Region 3.4 anomaly was 0.2°C for the week centered around July 17. For the past six weeks, the ENSO Region 1+2 anomaly has averaged -0.47°C and the ENSO Region 3.4 anomaly has averaged +0.25°C. Neutral ENSO conditions will likely evolve into a La Niña event during the late summer or early fall. The SOI was +14.22 today. The preliminary Arctic Oscillation (AO) was +1.002 today. Based on sensitivity analysis applied to the latest guidance, there is an implied near 99% probability that New York City will have a warmer than normal July (1991-2020 normal). July will likely finish with a mean temperature near 79.7° (2.2° above normal).
-
A veil of thin wildfire smoke is moving through the region. That area of smoke will be driven well offshore overnight. Generally near normal readings will prevail through the week. Warmer air will begin to arrive to close the weekend. There is some potential that the month could end on a hot note. Heat will likely return during the first week in August. The latest summer guidance continues to suggest a warmer to much warmer than normal summer lies ahead. Some of the extended range guidance suggests that August could be warmer to much warmer than normal. The ENSO Region 1+2 anomaly was -0.5°C and the Region 3.4 anomaly was 0.2°C for the week centered around July 17. For the past six weeks, the ENSO Region 1+2 anomaly has averaged -0.47°C and the ENSO Region 3.4 anomaly has averaged +0.25°C. Neutral ENSO conditions will likely evolve into a La Niña event during the late summer or early fall. The SOI was +14.22 today. The preliminary Arctic Oscillation (AO) was +0.803 today. Based on sensitivity analysis applied to the latest guidance, there is an implied near 96% probability that New York City will have a warmer than normal July (1991-2020 normal). July will likely finish with a mean temperature near 79.8° (2.3° above normal). That would tie 2024 with 2013 as the 10th hottest July on record.
-
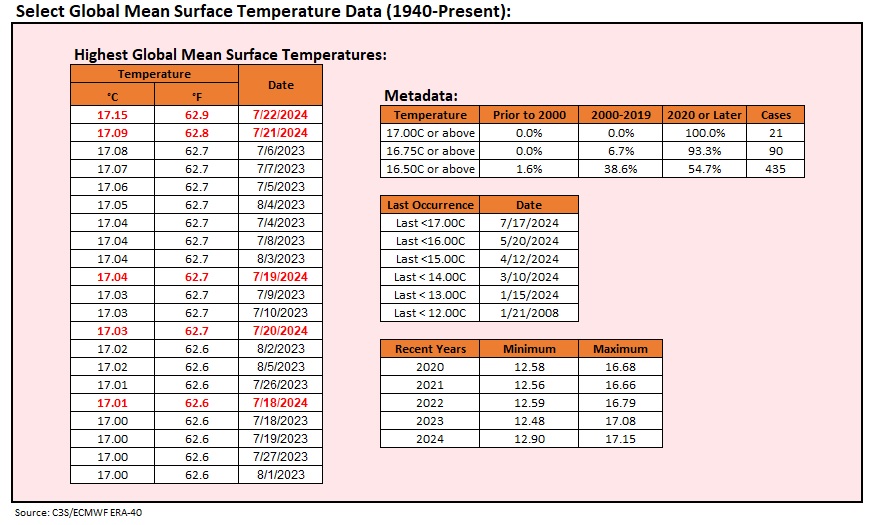
Note: The preliminary 7/22 global mean surface temperature was finalized at 17.16C. Today's preliminary value is 17.15C.
-
Near normal readings will prevail through the week. Showers and thundershowers are likely tonight through Thursday. Warmer air will begin to arrive to close the weekend. There is some potential that the month could end on a hot note. The latest summer guidance continues to suggest a warmer to much warmer than normal summer lies ahead. Some of the extended range guidance suggests that August could be warmer to much warmer than normal. The ENSO Region 1+2 anomaly was -0.5°C and the Region 3.4 anomaly was 0.2°C for the week centered around July 17. For the past six weeks, the ENSO Region 1+2 anomaly has averaged -0.47°C and the ENSO Region 3.4 anomaly has averaged +0.25°C. Neutral ENSO conditions will likely evolve into a La Niña event during the late summer or early fall. The SOI was +2.15 today. The preliminary Arctic Oscillation (AO) was +0.497 today. Based on sensitivity analysis applied to the latest guidance, there is an implied near 95% probability that New York City will have a warmer than normal July (1991-2020 normal). July will likely finish with a mean temperature near 79.9° (2.4° above normal). That would rank 2024 as the 10th hottest July on record.
-
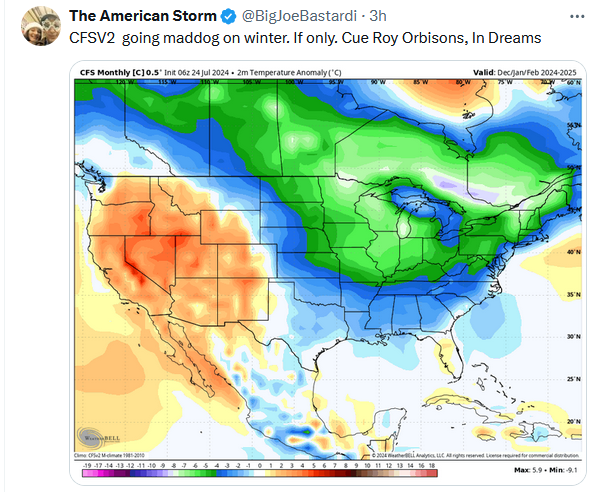
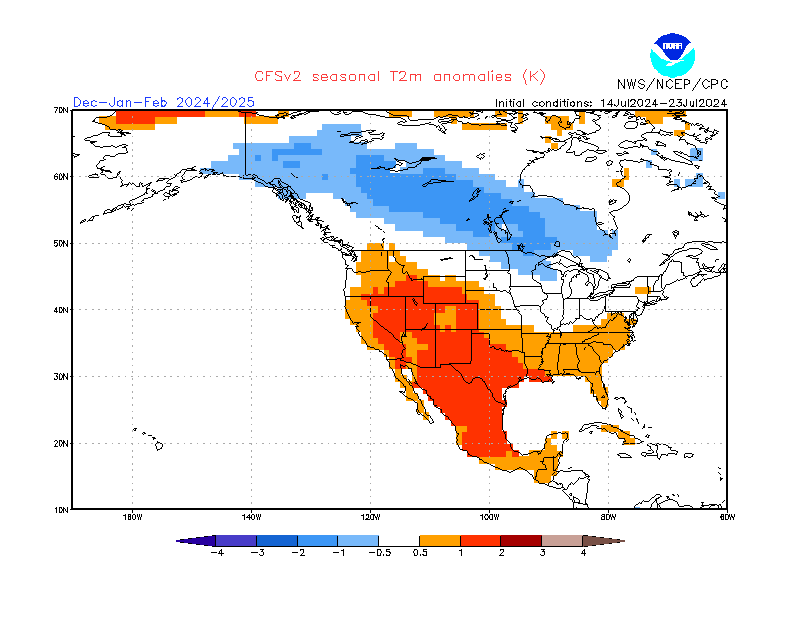
For those who are interested, Joe Bastardi is continuing to point to a cold winter in the East. He used one specific run of the CFSv2. Here's what the CFSv2 looks like on the NCEP page when using a fixed range of initialization cycles (one should not use a single initialization for the tool). Of course, skill is low from this timeframe. Last year, the CFSv2 had the East near normal for Winter 2023-24. It turned out to be among the warmest winters on record.
-
Some global temperature data:
-
Near normal readings will prevail through the week. Showers and thundershowers are likely tonight through Thursday. Warmer air will begin to arrive to close the weekend. There is some potential that the month could end on a hot note. The latest summer guidance continues to suggest a warmer to much warmer than normal summer lies ahead. Some of the extended range guidance suggests that August could be warmer to much warmer than normal. The ENSO Region 1+2 anomaly was -0.5°C and the Region 3.4 anomaly was 0.2°C for the week centered around July 17. For the past six weeks, the ENSO Region 1+2 anomaly has averaged -0.47°C and the ENSO Region 3.4 anomaly has averaged +0.25°C. Neutral ENSO conditions will likely evolve into a La Niña event during the late summer or early fall. The SOI was +4.00 today. The preliminary Arctic Oscillation (AO) was +0.170 today. Based on sensitivity analysis applied to the latest guidance, there is an implied near 95% probability that New York City will have a warmer than normal July (1991-2020 normal). July will likely finish with a mean temperature near 80.0° (2.5° above normal). That would tie 2024 with 1908 and 2020 as the 8th hottest July on record.
-
Near normal readings will prevail through the week. Showers and thundershowers are likely tonight through Thursday. There is some potential that the month could end on a hot note. The latest summer guidance continues to suggest a warmer to much warmer than normal summer lies ahead. Some of the extended range guidance suggests that August could be warmer to much warmer than normal. The ENSO Region 1+2 anomaly was -0.5°C and the Region 3.4 anomaly was 0.2°C for the week centered around July 17. For the past six weeks, the ENSO Region 1+2 anomaly has averaged -0.47°C and the ENSO Region 3.4 anomaly has averaged +0.25°C. Neutral ENSO conditions will likely evolve into a La Niña event during the late summer or early fall. The SOI was +5.35 today. The preliminary Arctic Oscillation (AO) was +0.325 today. Based on sensitivity analysis applied to the latest guidance, there is an implied near 95% probability that New York City will have a warmer than normal July (1991-2020 normal). July will likely finish with a mean temperature near 80.1° (2.6° above normal). That would tie 2024 with 1993 as the 7th hottest July on record.
-
Generally fair and near normal readings will prevail through the week. Some showers or thundershowers could become likely toward midweek. The latest summer guidance continues to suggest a warmer to much warmer than normal summer lies ahead. Some of the extended range guidance suggests that August could be warmer to much warmer than normal. The ENSO Region 1+2 anomaly was -0.2°C and the Region 3.4 anomaly was 0.3°C for the week centered around July 10. For the past six weeks, the ENSO Region 1+2 anomaly has averaged -0.47°C and the ENSO Region 3.4 anomaly has averaged +0.23°C. Neutral ENSO conditions will likely evolve into a La Niña event during the late summer or early fall. The SOI was -5.11 today. The preliminary Arctic Oscillation (AO) was +0.152 today. Based on sensitivity analysis applied to the latest guidance, there is an implied near 93% probability that New York City will have a warmer than normal July (1991-2020 normal). July will likely finish with a mean temperature near 80.1° (2.6° above normal). That would tie 2024 with 1993 as the 7th hottest July on record.
-
Generally fair and somewhat warmer than normal readings will prevail into next week. Some showers or thundershowers could become likely toward the middle of next week. The latest summer guidance continues to suggest a warmer to much warmer than normal summer lies ahead. Some of the extended range guidance suggests that August could be warmer to much warmer than normal. The ENSO Region 1+2 anomaly was -0.2°C and the Region 3.4 anomaly was 0.3°C for the week centered around July 10. For the past six weeks, the ENSO Region 1+2 anomaly has averaged -0.47°C and the ENSO Region 3.4 anomaly has averaged +0.23°C. Neutral ENSO conditions will likely evolve into a La Niña event during the late summer or early fall. The SOI was -22.47 today. The preliminary Arctic Oscillation (AO) was -0.013 today. Based on sensitivity analysis applied to the latest guidance, there is an implied near 94% probability that New York City will have a warmer than normal July (1991-2020 normal). July will likely finish with a mean temperature near 80.2° (2.7° above normal). That would tie 2024 with 2011 as the 6th hottest July on record.
-
Phoenix Experiences its Hottest June on Record
donsutherland1 replied to donsutherland1's topic in Climate Change
Probably, around half given trends at some rural sites. Unfortunately, there are no nearby USCRN sites. Growing urbanization has played an important role in driving the warming in Las Vegas and Reno, on top of background warming from climate change. -
Phoenix Experiences its Hottest June on Record
donsutherland1 replied to donsutherland1's topic in Climate Change
Yes. Phoenix has broken records for its hottest summer in 1981, 2007, 2013, 2020, and 2023. 2024 is on track to set a new record. A similar story holds true for Las Vegas, with summer records being set in 1994, 2007, 2016, 2017, and 2018. 2024 is also on track to become its hottest summer on record. We'll have to see if monsoonal moisture in August tempers the warmth enough to avoid setting new records. Even if it does, both cities will probably set new records before the decade is over. -
Phoenix Experiences its Hottest June on Record
donsutherland1 replied to donsutherland1's topic in Climate Change
Charts that illustrate Las Vegas' unprecedented extreme heat: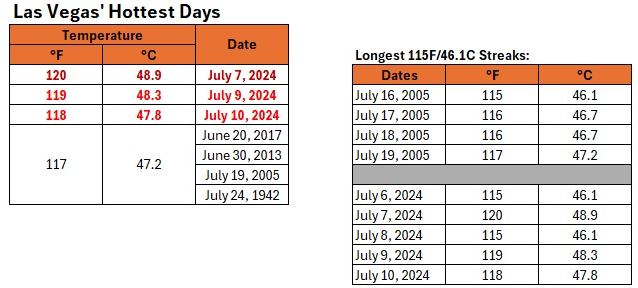
-
Phoenix Experiences its Hottest June on Record
donsutherland1 replied to donsutherland1's topic in Climate Change
On account of its warming climate, what was once a record-breaking summer prior to 2000 has become a routine summer today. The trendline for mean summer temperatures now exceeds the figure for the hottest summer on record prior to 2000.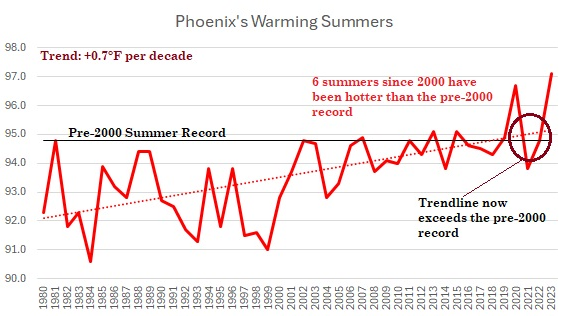
-
Under bright sunshine and low humidity, the temperature rose into the lower and middle 80s in the Middle Atlantic Region. Meanwhile, out west, Seattle recorded its 16th consecutive 80° day. That broke the record of 15 days set during July 30-August 13, 1977 and tied during June 25-July 9, 2015. Generally fair and somewhat warmer than normal readings will prevail through the weekend. Some showers or thundershowers could become likely toward the middle of next week. The latest summer guidance continues to suggest a warmer to much warmer than normal summer lies ahead. The ENSO Region 1+2 anomaly was -0.2°C and the Region 3.4 anomaly was 0.3°C for the week centered around July 10. For the past six weeks, the ENSO Region 1+2 anomaly has averaged -0.47°C and the ENSO Region 3.4 anomaly has averaged +0.23°C. Neutral ENSO conditions will likely evolve into a La Niña event during the late summer or early fall. The SOI was -30.41 today. The preliminary Arctic Oscillation (AO) was -0.241 today. Based on sensitivity analysis applied to the latest guidance, there is an implied near 93% probability that New York City will have a warmer than normal July (1991-2020 normal). July will likely finish with a mean temperature near 80.2° (2.7° above normal). That would tie 2024 with 2011 as the 6th hottest July on record.
-
Occasional Thoughts on Climate Change
donsutherland1 replied to donsutherland1's topic in Climate Change
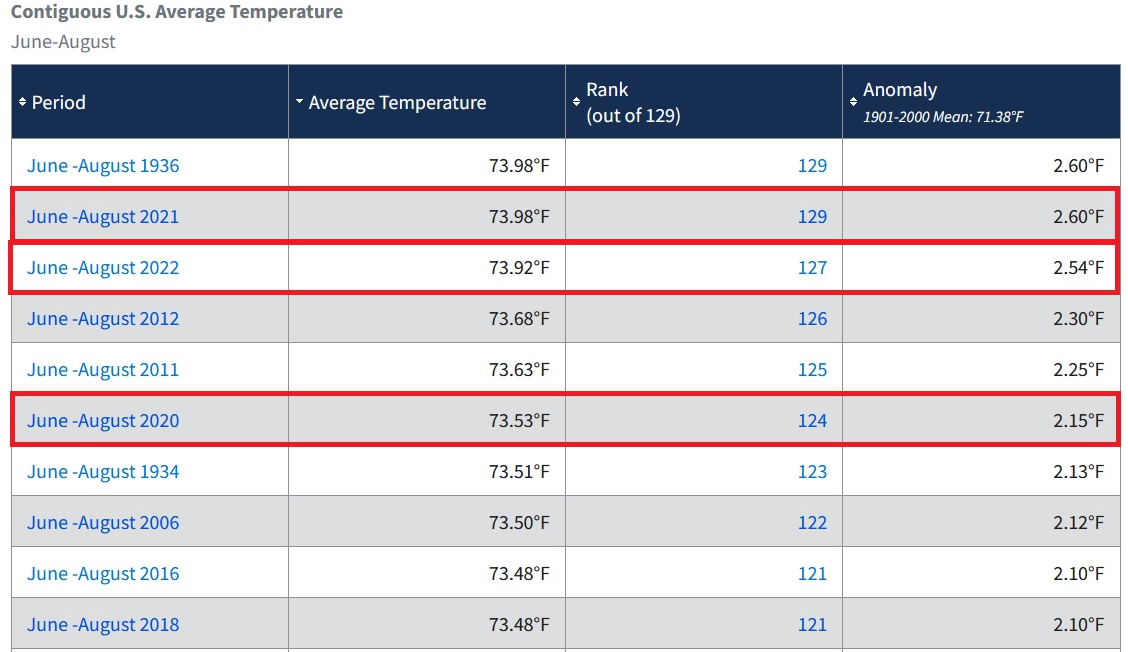
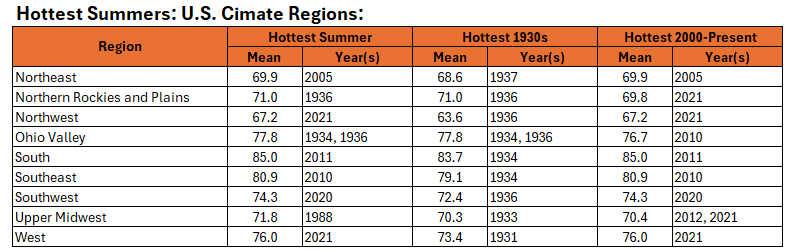
The Dust Bowl Era of the 1930s illustrates the kind of extremes that can take place in an aridification scenario. Conditions for exceptional heat resulted from the combination of persistent drought and low soil moisture from bad farming practices/soil management. That 1930s extremes are beginning to be challenged in the Plains States in the absence of such conditions illustrates the reality that a warming climate is bringing temperatures toward levels that once occurred under extraordinary conditions. In terms of larger regions and the contiguous U.S., recent summers have generally exceeded those of the 1930s. In fact, 3 of the 10 hottest summers have all occurred since 2020 on a national basis. In addition, 1930s figures have been surpassed in all but two climate regions.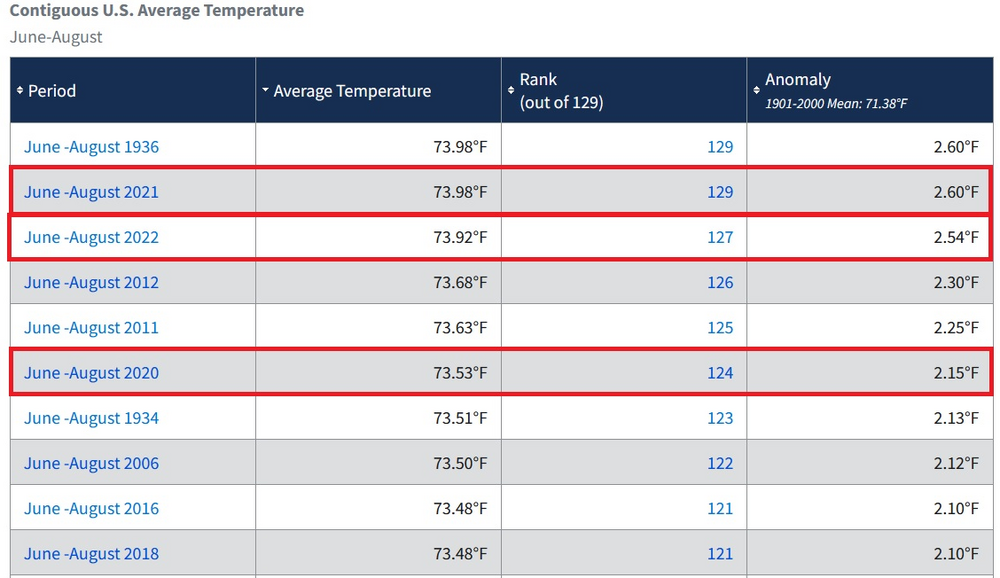
-
Generally fair and somewhat warmer than normal readings will prevail through the weekend. Some showers or thundershowers could become likely toward the middle of next week. The latest summer guidance continues to suggest a warmer to much warmer than normal summer lies ahead. The ENSO Region 1+2 anomaly was -0.2°C and the Region 3.4 anomaly was 0.3°C for the week centered around July 10. For the past six weeks, the ENSO Region 1+2 anomaly has averaged -0.47°C and the ENSO Region 3.4 anomaly has averaged +0.23°C. Neutral ENSO conditions will likely evolve into a La Niña event during the late summer or early fall. The SOI was -31.27 today. The preliminary Arctic Oscillation (AO) was -0.244 today. Based on sensitivity analysis applied to the latest guidance, there is an implied near 90% probability that New York City will have a warmer than normal July (1991-2020 normal). July will likely finish with a mean temperature near 80.2° (2.7° above normal). That would tie 2024 with 2011 as the 6th hottest July on record.
-
A line of thunderstorms dumped 1.13” of rain in New York City during the past hour. Since 1889, 30% of 1” or more hourly rainfall amounts have occurred in July.
-
Temperatures soared into the 90s across many parts of the Middle Atlantic region today. High temperatures included: Baltimore: 100° New York City: 90° Newark: 91° Philadelphia: 95° Washington, DC: 101° Baltimore and Washington, DC both recorded their record-tying fourth consecutive 100° or above days. Somewhat cooler air will arrive overnight and tomorrow following showers and thunderstorms. Nevertheless, temperatures will generally run somewhat above normal through the remainder of the week and weekend. The latest summer guidance continues to suggest a warmer to much warmer than normal summer lies ahead. The ENSO Region 1+2 anomaly was -0.2°C and the Region 3.4 anomaly was 0.3°C for the week centered around July 10. For the past six weeks, the ENSO Region 1+2 anomaly has averaged -0.47°C and the ENSO Region 3.4 anomaly has averaged +0.23°C. Neutral ENSO conditions will likely evolve into a La Niña event during the late summer or early fall. The SOI was -25.30 today. The preliminary Arctic Oscillation (AO) was -0.279 today. Based on sensitivity analysis applied to the latest guidance, there is an implied near 90% probability that New York City will have a warmer than normal July (1991-2020 normal). July will likely finish with a mean temperature near 80.2° (2.7° above normal). That would tie 2024 with 2011 as the 6th hottest July on record.
-
Temperatures soared well into the 90s across many parts of the Middle Atlantic region today. A southeasterly wind helped cap temperatures in New York City during the afternoon. High temperatures included: Baltimore: 104° (tied record set in 1988) Bridgeport: 92° Islip: 93° New York City: 94° Newark: 99° Philadelphia: 98° Washington, DC: 104° (tied record set in 1988) Tomorrow will again see hot and humid conditions. Widespread 90s likely. An approaching cold front will likely bring heavy thunderstorms to the region during the afternoon or evening. Cooler air will arrive afterward. The latest summer guidance continues to suggest a warmer to much warmer than normal summer lies ahead. The ENSO Region 1+2 anomaly was -0.2°C and the Region 3.4 anomaly was 0.3°C for the week centered around July 10. For the past six weeks, the ENSO Region 1+2 anomaly has averaged -0.47°C and the ENSO Region 3.4 anomaly has averaged +0.23°C. Neutral ENSO conditions will likely evolve into a La Niña event during the late summer or early fall. The SOI was -10.28 today. The preliminary Arctic Oscillation (AO) was +0.019 today. Based on sensitivity analysis applied to the latest guidance, there is an implied near 87% probability that New York City will have a warmer than normal July (1991-2020 normal). July will likely finish with a mean temperature near 80.1° (2.6° above normal). That would tie 2024 with 1993 as the 7th hottest July on record.
-
Temperatures soared well into the 90s across many parts of the Middle Atlantic region today. High temperatures included: Atlantic City: 95° Baltimore: 102° (tied record set in 1995) Harrisburg: 99° (tied record set in 1995) New York City: 91° Newark: 94° Norfolk: 98° Philadelphia: 97° Raleigh: 101° (old record: 99°, 1979 and 1999) Richmond: 97° Washington, DC: 102° (old record: 100°, 1988) Wilmington, DE: 96° Tomorrow and Wednesday will see very hot and humid conditions. Widespread 95°-100° high temperatures are likely. An approaching cold front could bring heavy thunderstorms to the region during on Wednesday afternoon or evening. Cooler air will arrive afterward. The latest summer guidance continues to suggest a warmer to much warmer than normal summer lies ahead. The ENSO Region 1+2 anomaly was -0.2°C and the Region 3.4 anomaly was 0.3°C for the week centered around July 10. For the past six weeks, the ENSO Region 1+2 anomaly has averaged -0.47°C and the ENSO Region 3.4 anomaly has averaged +0.23°C. Neutral ENSO conditions will likely evolve into a La Niña event during the late summer or early fall. The SOI was +1.78 today. The preliminary Arctic Oscillation (AO) was +0.188 today. Based on sensitivity analysis applied to the latest guidance, there is an implied near 85% probability that New York City will have a warmer than normal July (1991-2020 normal). July will likely finish with a mean temperature near 80.1° (2.6° above normal). That would tie 2024 with 1993 as the 7th hottest July on record.
-
Heat returned to the Middle Atlantic region today. High temperatures included: Baltimore: 101° (tied record set in 1954) New York City: 90° Newark: 90° Philadelphia: 94° Washington, DC: 101° (old record: 100°, 1954) Tomorrow through Wednesday will see very hot and humid conditions. Widespread 95°-100° high temperatures are likely. An approaching cold front could bring heavy thunderstorms to the region during on Wednesday afternoon or evening. Cooler air will arrive afterward. The latest summer guidance continues to suggest a warmer to much warmer than normal summer lies ahead. The ENSO Region 1+2 anomaly was 0.0°C and the Region 3.4 anomaly was 0.3°C for the week centered around July 3. For the past six weeks, the ENSO Region 1+2 anomaly has averaged -0.62°C and the ENSO Region 3.4 anomaly has averaged +0.20°C. Neutral ENSO conditions will likely evolve into a La Niña event during the late summer or early fall. The SOI was -4.68 today. The preliminary Arctic Oscillation (AO) was +0.248 today. Based on sensitivity analysis applied to the latest guidance, there is an implied near 84% probability that New York City will have a warmer than normal July (1991-2020 normal). July will likely finish with a mean temperature near 80.1° (2.6° above normal). That would tie 2024 with 1993 as the 7th hottest July on record.