donsutherland1
-
Posts
24,186 -
Joined
12 Followers


About donsutherland1

-
DCA _ NYC _ BOS _ ORD _ ATL _ IAH _ DEN _ PHX _ SEA 0.3 0.3 0.8 1.5 2.0 0.5 2.0 2.0 1.6
-
Occasional Thoughts on Climate Change
donsutherland1 replied to donsutherland1's topic in Climate Change
The extreme heat was more the focus of climate change in my post, which merely noted that France was "wildfire-swept." At least for now, my understanding is that the connection between climate change and extreme heatwaves is stronger than the more complex linkage between climate change and wildfires. Nevertheless, there is a fairly prominent link. Since my initial post, World Weather Attribution (WWA) has published a rapid attribution report. Consistent with the expectations from a growing body of scientific literature, including one Nature piece talking about the future that I posted, climate change contributed. Excerpts: In Spain, January 2026 was the wettest January of the last quarter of a century (AEMET, 2026). In particular, in the area affected by the Ávila–Madrid–Toledo fire, rainfall was 175% higher than usual, which allowed a great accumulation of plant biomass. The summer of 2026 began with record-breaking temperatures and a severe drought, both conditions exacerbated by human-caused climate change (WWA, 2026a; WWA, 2026b). This sequence resulted in high fuel loads that then dried to become highly flammable, increasing the intensity of the fires... In 2025, WWA conducted two rapid attribution studies on fires in Spain and Portugal (WWA, 2025a) and Turkiye, Cyprus and Greece (WWA, 2025b), alongside a retrospective analysis of the entire wildfire season in several European regions (Keeping et al., 2026b). Across all three studies, we found that human-caused climate change was a key driver of the fire weather conditions, primarily through its influence on exceptionally high temperatures, but also by exacerbating drought conditions... The weeks leading up to the fires were characterised by a succession of extreme heatwaves and low rainfall across much of Western Europe, despite it still being comparably early in the season. Recent studies have shown human-caused climate change increased the likelihood of these hot and dry antecedent conditions, which were essential for the development of the extreme fire weather that enabled the fires... In both study regions observations show strong trends of increasing likelihood and severity with global warming. DSR7x values as extreme as those observed in central Spain in July 2026 are now at least 20 times more likely than in a pre-industrial climate. In the French regions the statistical model fits the data less closely and may underestimate the return period of the event, thus the result of an increase in likelihood by at least a factor two in southwest France is a conservative estimate... A recent attribution study has shown that climate change is increasing the likelihood of severe soil moisture drought through higher atmospheric evaporative demand, while the same sequence of above-average winter rainfall followed by exceptional spring drying was identified as a key driver of the 2025 Iberian wildfires. Finally, the WWA rapid attribution report cites and links to a fairly large number of papers on fire weather in Europe, many of which have relevance to the impact of climate change. -
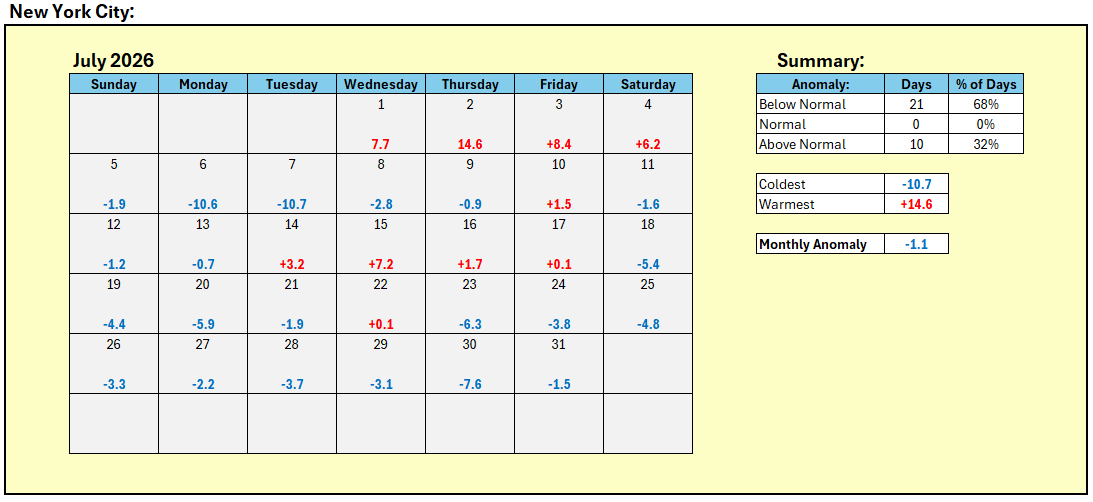
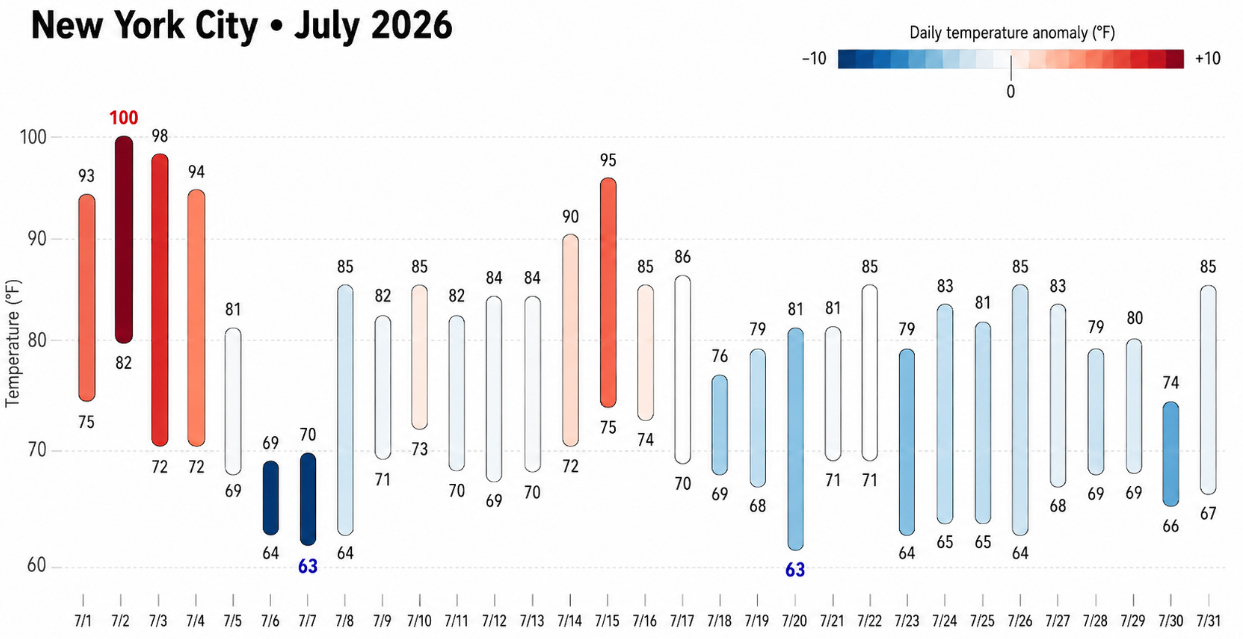
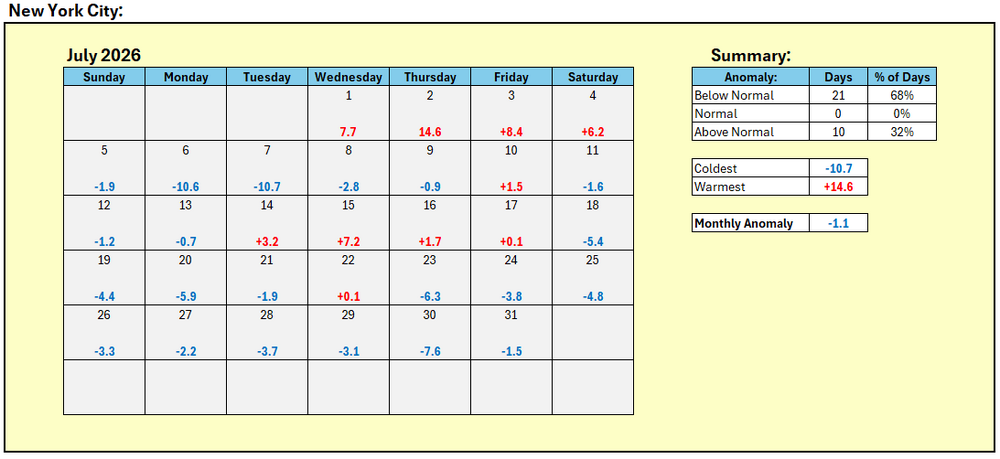
July 2026 finished with a monthly mean temperature of 76.4°, which was 1.1° below normal (0.1° below the 1981-2010 baseline).

-
New York City (Central Park) is finishing July with a monthly mean temperature of 76.4°. Despite the hot start to the month, that is 1.1° below normal (0.1° below the older 1981-2010 baseline). Temperatures could return to near seasonable levels for a time this weekend. Sunday could be a bit cooler than normal. Another moderate to potentially significant rainfall is likely Monday into Tuesday. No exceptional heat is likely through the first week of August. The ENSO Region 1+2 anomaly was +3.8°C and the Region 3.4 anomaly was +2.2°C for the week centered around July 23. For the past six weeks, the ENSO Region 1+2 anomaly has averaged +3.38°C and the ENSO Region 3.4 anomaly has averaged +1.92°C. The ongoing strong El Niño will continue to strengthen through the summer. The SOI was -26.84 today. The preliminary Arctic Oscillation (AO) was -0.295 today.
-
Occasional Thoughts on Climate Change
donsutherland1 replied to donsutherland1's topic in Climate Change
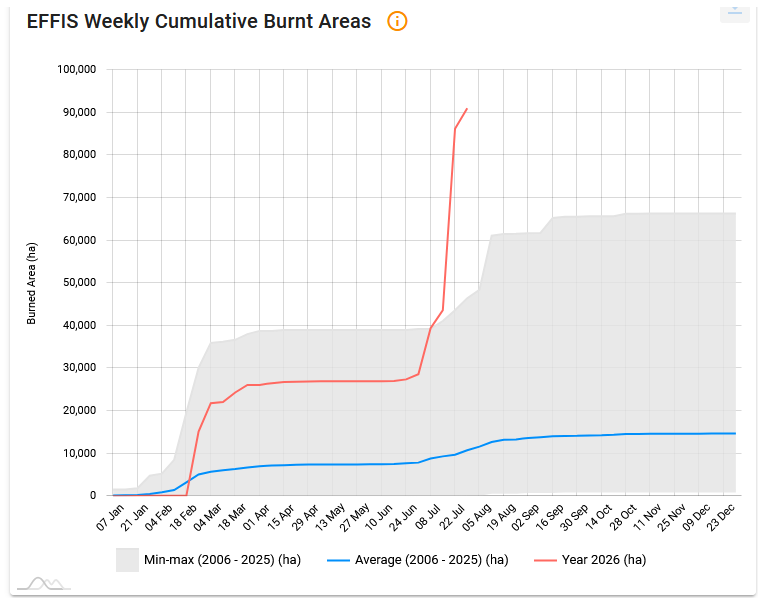
You objected to my description of "wildfire-swept France" with a map that was largely irrelevant to the issue at hand. The 2026 wildfire season has been very severe in France and also a bad one in the European Union. My providing information about France and the European Union to address the flaws in the chart that was used to object to my point about France does not argue that climate-change effects stop at the EU or that they exclude Russia. The posted chart was not appropriate for judging the severity of the fire season in France. More data are not automatically better if that additional data is irrelevant to the question at hand. Excluding the irrelevant data that had nothing to do with France wasn't "cherry picking." Including irrelevant data to dismiss the narrowly focused point concerning France creates a misleading picture. -
Occasional Thoughts on Climate Change
donsutherland1 replied to donsutherland1's topic in Climate Change
I was still editing and added an opening paragraph. This is projected to happen during climate change. I am not certain about seasonal variations, though June 2026 has been quite wet. A Finland publication describing climate change refers to increasing winter rains. https://itameri.fi/en/state-of-the-baltic-sea/climate-change/ This year, January-February were drier than normal in Scandinavia, but March was wetter than normal. -
Occasional Thoughts on Climate Change
donsutherland1 replied to donsutherland1's topic in Climate Change
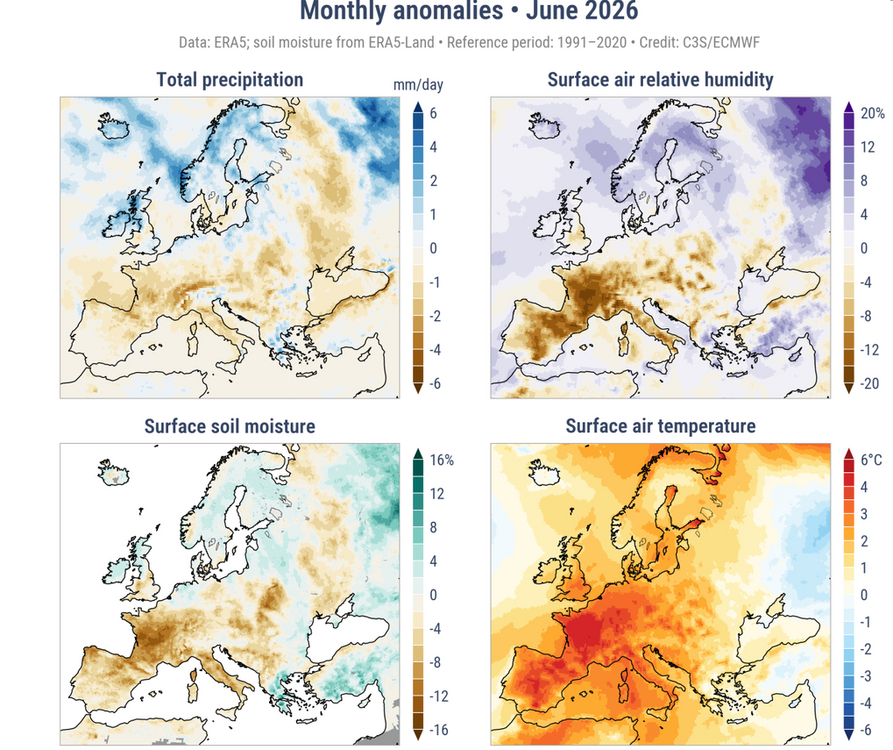
The Baltics and Scandinavia are projected to grow warmer and wetter from climate change. The 10-year precipitation anomalies suggest that this process may be ongoing. I am not sure whether it's just winters or overall. June has been wetter than normal this year. In terms of fire weather given the introduction of European data that included Russia, the Copernicus provides data showing that European Russia had near to above normal precipitation during spring 2026. The part that had been somewhat dry during spring saw much above normal precipitation in June. Compare and contrast the surface air relative humidity in Russia vs. France/Spain both in Spring and then June. The data suggested that France/Spain had explosive fire potential given the dry conditions that had emerged there. June 2026: It should also be noted that a wet conditions followed by drought lead to the worst fire potential. Europe saw a severe drought develop this spring. Relevant excerpt from the scientific literature: "The combination of abundant fuel (resulting of the 2025 wet spring; Fig. S3d), exceptional heat, and severe summer drought fueled the intense fires that raged across northwestern Spain last year." https://www.nature.com/articles/s41598-026-61756-4
-
Occasional Thoughts on Climate Change
donsutherland1 replied to donsutherland1's topic in Climate Change
World Weather Attribution has now released an analysis concerning the wildfires in France and Spain. https://www.worldweatherattribution.org/climate-change-increases-likelihood-of-compounding-drivers-of-severe-wildfire-conditions-in-france-and-spain/ -
Occasional Thoughts on Climate Change
donsutherland1 replied to donsutherland1's topic in Climate Change
Several things: 1) Your posted chart includes Russia. It has been an above average fire season in the European Union so far. As per Copernicus: 2) France is having its worst fire season (Copernicus) in some two decades: 3) Climate change has contributed through its impact on heat/drought, which increased the vapor pressure deficit (dried the vegetation). The impact of climate change--how much more likely, how much worse, etc.--the fires would have been has not yet been assessed in the attribution studies. It's had a contribution. The extent of the contribution remains to be determined. 4) Climate change is expected to lead to an increase in extreme wildfires. https://www.nature.com/articles/s41612-024-00575-8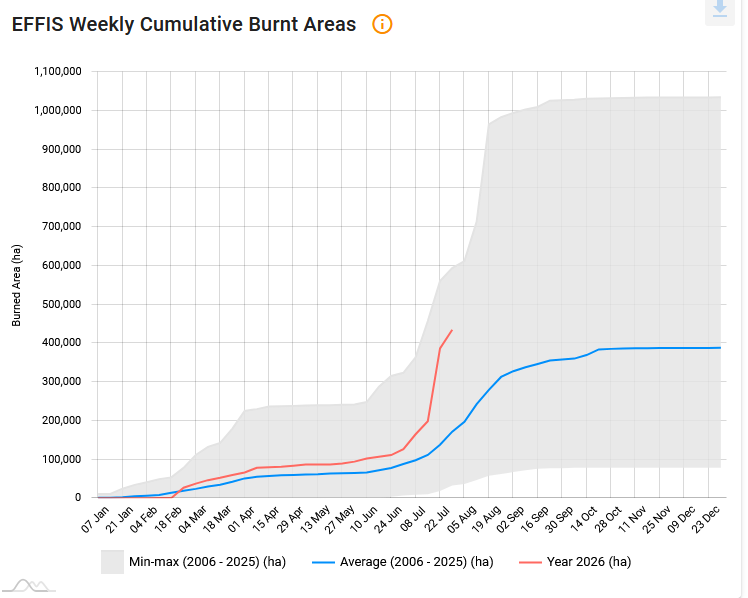
-
A few additional showers are possible this evening into tonight. Tomorrow will see a continuation of below normal readings. Temperatures could return to near seasonable levels for the weekend. The ENSO Region 1+2 anomaly was +3.8°C and the Region 3.4 anomaly was +2.2°C for the week centered around July 23. For the past six weeks, the ENSO Region 1+2 anomaly has averaged +3.38°C and the ENSO Region 3.4 anomaly has averaged +1.92°C. The ongoing strong El Niño will continue to strengthen through the summer. The SOI was -23.76 today. The preliminary Arctic Oscillation (AO) was -0.223 today. Based on sensitivity analysis applied to the latest guidance, there is an implied near 100% probability that New York City will have a cooler than normal July (1991-2020 normal). July will likely finish with a mean temperature near 76.4° (1.1° below normal). Supplemental Information: The projected mean would be 0.1° below the 1981-2010 normal monthly value.
-
309 NOUS41 KALY 292002 PNSALY CTZ001-013-MAZ001-025-NYZ032-033-038>043-047>054-058>061-063>066-082>084- VTZ013>015-300802- Public Information Statement National Weather Service Albany NY 402 PM EDT Wed Jul 29 2026 ...LATEST PRECIPITATION REPORTS (STORM TOTAL)... Location Amount Time/Date Provider ...Connecticut... ...Litchfield County... Falls Village 3.60 in 0300 PM 07/29 Trained Spotter ...Massachusetts... ...Berkshire County... 2 SW Pittsfield 3.28 in 0354 PM 07/29 ASOS 2 ESE Williamstown 3.14 in 0352 PM 07/29 ASOS ...New York... ...Albany County... Clarksville 7.50 in 0202 PM 07/29 Public 2 SSW Voorheesville 7.02 in 0205 PM 07/29 Public 2 W Voorheesville 6.81 in 0330 PM 07/29 Mesonet 2 NE Colonie 6.65 in 0351 PM 07/29 ASOS 3 WNW Cohoes 5.60 in 1230 PM 07/29 NWS Employee 3 NE Preston Hollow 5.58 in 0330 PM 07/29 Mesonet ...Columbia County... 1 NNW Kinderhook 11.37 in 0330 PM 07/29 Mesonet 4 ENE Philmont 7.80 in 0145 PM 07/29 Trained Spotter Livingston 5.35 in 0230 PM 07/29 Trained Spotter 3 NNE Copake 4.90 in 0330 PM 07/29 Mesonet ...Dutchess County... 1 NW Red Hook 5.37 in 0330 PM 07/29 Mesonet 2 N Dover Plains 4.39 in 0330 PM 07/29 Mesonet 2 NNE Beacon 4.37 in 0330 PM 07/29 Mesonet 2 SSW Red Oaks Mill 2.96 in 0356 PM 07/29 ASOS ...Fulton County... Broadalbin 5.55 in 1200 PM 07/29 Public Broadalbin 5.34 in 0243 PM 07/29 Trained Spotter 4 N Saint Johnsville 1.83 in 0330 PM 07/29 Mesonet ...Greene County... 2 SE Tannersville 8.47 in 0330 PM 07/29 Mesonet ...Hamilton County... 2 NNE Piseco 2.89 in 0330 PM 07/29 Mesonet 2 ENE Indian Lake 1.96 in 0330 PM 07/29 Mesonet 2 ENE Raquette Lake 1.27 in 0330 PM 07/29 Mesonet ...Herkimer County... 1 WNW Herkimer 1.57 in 0330 PM 07/29 Mesonet 3 ENE Cold Brook 0.98 in 0330 PM 07/29 Mesonet 2 N Old Forge 0.73 in 0330 PM 07/29 Mesonet ...Montgomery County... 3 N Tribes Hill 3.05 in 0330 PM 07/29 Mesonet 4 ESE Canajoharie 1.76 in 0330 PM 07/29 Mesonet ...Rensselaer County... 4 ESE Castleton-on-Hudso 11.47 in 0330 PM 07/29 Mesonet 1 W Schaghticoke 6.06 in 0330 PM 07/29 Mesonet 4 NNE New Lebanon 3.77 in 0330 PM 07/29 Mesonet ...Saratoga County... Gansevoort 6.76 in 0200 PM 07/29 Trained Spotter Saratoga Springs 6.55 in 1200 PM 07/29 Public 2 NW Ballston Spa 4.91 in 0330 PM 07/29 Mesonet 1 NNE Schuylerville 4.19 in 0330 PM 07/29 Mesonet 1 W Edinburg 3.28 in 0330 PM 07/29 Mesonet ...Schenectady County... 3 WSW Rotterdam 5.00 in 0315 PM 07/29 Trained Spotter 1 ESE Niskayuna 4.44 in 0205 PM 07/29 NWS Employee 3 WSW Rotterdam 4.25 in 1201 PM 07/29 Trained Spotter 3 SW Mariaville 2.70 in 0330 PM 07/29 Mesonet ...Schoharie County... 1 W Cobleskill 1.29 in 0330 PM 07/29 Mesonet ...Ulster County... 7 NNW Sundown 6.47 in 0330 PM 07/29 Mesonet 4 SW Tillson 2.31 in 0330 PM 07/29 Mesonet 2 NNE Wallkill 1.39 in 0330 PM 07/29 Mesonet ...Warren County... 3 NNW Hudson Falls 4.23 in 0330 PM 07/29 Mesonet 9 NW Bolton Landing 2.15 in 0330 PM 07/29 Mesonet ...Washington County... 5 S Whitehall 3.63 in 0330 PM 07/29 Mesonet ...Vermont... ...Bennington County... 2 WNW Old Bennington 3.31 in 0354 PM 07/29 ASOS &&
-
529 NOUS41 KOKX 300055 PNSOKX CTZ005>012-NJZ002-004-006-103>108-NYZ067>075-078>081-176>179-301222- Public Information Statement National Weather Service New York NY 855 PM EDT Wed Jul 29 2026 ...PRECIPITATION REPORTS... Location Amount Time/Date Provider ...Connecticut... ...Fairfield County... Fairfield 3.61 in 0700 AM 07/29 COCORAHS Fairfield 3.59 in 0701 PM 07/29 CWOP Fairfield 3.54 in 0705 PM 07/29 CWOP NEWTOWN 3.47 in 0710 PM 07/29 CWOP Westport 3.27 in 0700 PM 07/29 CWOP SHELTON 2.89 in 0938 AM 07/29 CWOP 2 ENE Newtown 2.88 in 0113 PM 07/29 Public Stamford 2.68 in 0710 PM 07/29 AWS 4 NNW New Fairfield 2.66 in 0420 PM 07/29 Shelton 2.63 in 0713 PM 07/29 AWS Shelton 2.62 in 0710 PM 07/29 AWS Trumbull 2.6 SSE 2.62 in 0500 PM 07/29 COCORAHS 1 WNW Redding 2.46 in 0950 AM 07/29 AWS Bethel 2.27 in 0826 AM 07/29 COCORAHS Ridgefield 2.21 in 0953 AM 07/29 AWS Bridgeport Airport 2.16 in 0710 PM 07/29 ASOS REDDING 2.14 in 0948 AM 07/29 CWOP Bethel 4.5 SSE 2.06 in 0714 AM 07/29 COCORAHS Stratford 2.04 in 0731 AM 07/29 COCORAHS Sandy Hook 1.98 in 0744 AM 07/29 COCORAHS Greenwich 1.96 in 0950 AM 07/29 CWOP Stratford 3.7 N 1.96 in 0700 AM 07/29 COCORAHS Redding Ridge 1.94 in 0700 PM 07/29 CWOP Danbury 1.86 in 0945 AM 07/29 CWOP Newtown 5.3 S 1.83 in 0700 AM 07/29 COCORAHS Bethel 1.81 in 0700 AM 07/29 COCORAHS Greenwich 1.81 in 0947 AM 07/29 CWOP Ridgefield 2.4 NNE 1.81 in 0700 AM 07/29 COCORAHS Shelton 1.3 W 1.74 in 0800 AM 07/29 COCORAHS Ridgefield 1.71 in 0910 AM 07/29 AWS Darien 1.70 in 0700 AM 07/29 COCORAHS Norwalk 1.70 in 0700 AM 07/29 COCORAHS Weston 1.70 in 0715 PM 07/29 AWS Danbury 1.63 in 0930 AM 07/29 CWOP New Canaan 1.62 in 0800 AM 07/29 COCORAHS NEW CANAAN 1.53 in 0949 AM 07/29 CWOP 3 N New Canaan 1.53 in 0955 AM 07/29 AWS Danbury Airport 1.48 in 0953 AM 07/29 ASOS Darien 3.6 N 1.45 in 0650 AM 07/29 COCORAHS 1 N Stamford 1.45 in 0710 PM 07/29 AWS STAMFORD 1.40 in 0705 PM 07/29 CWOP Ridgefield 1.37 in 0630 AM 07/29 COCORAHS Brookfield 1.35 in 0700 AM 07/29 COCORAHS Sherman 1.2 E 1.35 in 0700 AM 07/29 COCORAHS Stamford 1.14 in 0715 PM 07/29 AWS 2 E Greenwich 1.10 in 0715 PM 07/29 AWS ...Middlesex County... 3.5 NW Durham 1.67 in 0700 PM 07/29 HADS Westbrook 1.26 in 0945 AM 07/29 CWOP Durham 1.19 in 0947 AM 07/29 CWOP MOODUS 1.01 in 0706 PM 07/29 CWOP Saybrook Manor 0.98 in 0715 PM 07/29 AWS Cromwell 0.4 WNW 0.88 in 0900 AM 07/29 COCORAHS Clinton 0.82 in 0710 PM 07/29 AWS 3.3 N Moodus 0.76 in 0615 PM 07/29 HADS ...New Haven County... Milford 2.91 in 0705 PM 07/29 CWOP Derby 1.0 SSE 2.43 in 1000 AM 07/29 COCORAHS ORANGE 2.27 in 0708 PM 07/29 CWOP Bethany 2.06 in 0950 AM 07/29 CWOP Milford 2.03 in 0706 PM 07/29 CWOP WOODBRIDGE 1.94 in 0710 PM 07/29 CWOP HAMDEN 1.89 in 0945 AM 07/29 CWOP Southbury 2.3 W 1.83 in 0800 AM 07/29 COCORAHS Oxford 1.82 in 0703 PM 07/29 CWOP Guilford 1.63 in 1129 AM 07/29 CO-OP Observer BRANFORD 1.51 in 0710 PM 07/29 CWOP Waterbury 1.35 in 0800 AM 07/29 COCORAHS PROSPECT 1.30 in 0706 PM 07/29 CWOP WALLINGFORD 1.26 in 0708 PM 07/29 CWOP Wallingford 1.17 in 0700 PM 07/29 CWOP NORTH PORT 1.03 in 0700 PM 07/29 CWOP New Haven 1.00 in 0715 PM 07/29 AWS Branford 0.98 in 0945 AM 07/29 CWOP Branford 0.96 in 0700 PM 07/29 CWOP Guilford Center 2.7 WSW 0.86 in 0830 AM 07/29 COCORAHS Meriden Airport 0.83 in 0653 PM 07/29 ASOS Outer Island, Branford 0.82 in 0715 PM 07/29 AWS Hamden 0.78 in 0719 AM 07/29 COCORAHS 1.1 W Wallingford 0.72 in 0700 PM 07/29 HADS Yalesville 0.61 in 0725 AM 07/29 COCORAHS Stony Creek 0.53 in 0706 PM 07/29 CWOP Madison Center 1.3 N 0.52 in 0700 AM 07/29 COCORAHS ...New London County... Norwich 3.78 in 0710 PM 07/29 AWS 3.1 NW Hopkinton 1.68 in 0945 AM 07/29 HADS Jewett City 3.0 ESE 1.42 in 0100 PM 07/29 COCORAHS Salem 3.6 SE 1.23 in 1200 PM 07/29 COCORAHS New London 1.19 in 0700 PM 07/29 CWOP Lyme 1.11 in 0700 PM 07/29 CWOP Waterford 2.3 S 1.07 in 0917 AM 07/29 COCORAHS GROTON 0.97 in 0700 PM 07/29 CWOP Lisbon 0.94 in 0710 PM 07/29 CWOP 1 SSE Ledyard Center 0.92 in 0118 PM 07/29 Public Old Lyme 0.81 in 0900 AM 07/29 COCORAHS Pawcatuck 0.77 in 0705 PM 07/29 CWOP Groton 0.70 in 0705 PM 07/29 CWOP Groton Airport 0.56 in 0704 PM 07/29 ASOS ...New Jersey... ...Bergen County... New Milford 6.19 in 0950 AM 07/29 AWS River Edge 1.1 N 6.06 in 0700 AM 07/29 COCORAHS River Edge 0.4 NNE 5.00 in 0700 AM 07/29 COCORAHS Fair Lawn 4.55 in 0830 AM 07/29 COCORAHS Hackensack 1.3 N 4.38 in 0700 AM 07/29 COCORAHS River Edge 0.7 SSW 4.17 in 0720 AM 07/29 COCORAHS Bergenfield 3.69 in 0945 AM 07/29 CWOP River Vale Twp 1.5 S 3.65 in 0800 AM 07/29 COCORAHS Montvale 1.8 ESE 3.12 in 0800 AM 07/29 COCORAHS Paramus 3.12 in 0955 AM 07/29 AWS Tenafly 3.07 in 0945 AM 07/29 CWOP 0.6 W Oakland 3.03 in 0600 PM 07/29 HADS Bogota 2.84 in 0713 PM 07/29 AWS Oakland 2.69 in 0950 AM 07/29 CWOP Emerson 2.64 in 0941 AM 07/29 CWOP Hasbrouck Heights 2.62 in 0949 AM 07/29 CWOP Hasbrouck Heights 0.9 SW 2.54 in 0700 AM 07/29 COCORAHS Oakland 2.45 in 0800 AM 07/29 COCORAHS Tenafly 2.45 in 0941 AM 07/29 CWOP Lyndhurst Twp 1.6 NW 2.07 in 0700 AM 07/29 COCORAHS Teterboro Airport 2.01 in 0851 AM 07/29 ASOS Leonia 1.97 in 0715 PM 07/29 AWS 1 SSE Franklin Lakes 1.94 in 0645 PM 07/29 IFLOWS Palisades Park 1.85 in 0900 AM 07/29 COCORAHS Lyndhurst 1.64 in 0955 AM 07/29 AWS North Arlington 1.59 in 0715 PM 07/29 AWS ...Essex County... West Orange Twp 0.6 WNW 4.53 in 0700 AM 07/29 COCORAHS CEDAR GROVE 4.20 in 0947 AM 07/29 CWOP Orange Reservoir 3.60 in 0700 PM 07/29 IFLOWS Montclair 3.34 in 0800 AM 07/29 COCORAHS 0.6 SW Caldwell 3.08 in 0845 AM 07/29 IFLOWS Livingston Twp 2.0 NNE 2.97 in 0935 AM 07/29 COCORAHS West Caldwell Twp 1.3 NE 2.96 in 0900 AM 07/29 COCORAHS WEST CALDWELL 2.42 in 0945 AM 07/29 CWOP Caldwell 2.11 in 0953 AM 07/29 ASOS 1.6 W Millburn 1.98 in 0915 AM 07/29 HADS Fairfield 1.89 in 0955 AM 07/29 AWS Millburn 1.81 in 0955 AM 07/29 AWS Maplewood Twp 1.0 ESE 1.51 in 0700 AM 07/29 COCORAHS Maplewood 1.46 in 0700 AM 07/29 COCORAHS 1 W Newark 1.16 in 0950 AM 07/29 AWS ...Hudson County... Secaucus 1.94 in 0955 AM 07/29 AWS Kearny 1.25 in 0706 PM 07/29 CWOP KEARNY 1.19 in 0710 PM 07/29 CWOP Harrison 1.13 in 0700 AM 07/29 COCORAHS 1 WSW Hoboken 0.94 in 0800 AM 07/29 COCORAHS Hoboken 0.80 in 0947 AM 07/29 CWOP 1 W Hoboken 0.69 in 0955 AM 07/29 AWS ...Passaic County... Hawthorne 5.46 in 0700 AM 07/29 COCORAHS Hawthorne 4.48 in 0950 AM 07/29 CWOP North Haledon 3.99 in 0950 AM 07/29 CWOP 0.8 E West Paterson 3.26 in 0845 AM 07/29 HADS 1 NNE North Caldwell 3.14 in 0954 AM 07/29 AWS Little Falls 3.04 in 0800 AM 07/29 COCORAHS Pompton Lakes 1.1 S 3.02 in 0700 AM 07/29 COCORAHS WAYNE 2.74 in 0946 AM 07/29 CWOP West Milford 2.73 in 0700 AM 07/29 COCORAHS Wayne 2.71 in 0700 AM 07/29 COCORAHS Ringwood 3.0 SSE 2.69 in 0700 AM 07/29 COCORAHS Wayne 2.55 in 0945 AM 07/29 CWOP CLIFTON 2.53 in 0709 PM 07/29 CWOP Ringwood 2.41 in 0610 PM 07/29 RAWS Oak Ridge Reservoir 2.40 in 0845 AM 07/29 COOP Wayne 2.38 in 0945 AM 07/29 CWOP Charlottesburg Reservoir 2.28 in 0845 AM 07/29 COOP Clifton 1.96 in 0715 PM 07/29 AWS 1.5 SW Ringwood 1.96 in 0845 AM 07/29 IFLOWS West Milford 1.80 in 0645 PM 07/29 IFLOWS Passaic 1.38 in 0945 AM 07/29 CWOP 2 ESE Barry Lakes 1.33 in 0715 PM 07/29 AWS ...Union County... Springfield 1.89 in 0830 AM 07/29 COCORAHS Linden Airport 1.76 in 0955 AM 07/29 AWOS Clark 1.57 in 0729 AM 07/29 COCORAHS Mountainside 1.54 in 0630 PM 07/29 IFLOWS Linden 2.2 NW 1.51 in 0645 AM 07/29 COCORAHS New Providence 1.47 in 0730 AM 07/29 COCORAHS Cranford 1.32 in 0440 AM 07/29 COCORAHS Clark 1.29 in 0700 AM 07/29 COCORAHS Bayside 1.24 in 0950 AM 07/29 CWOP Cranford Twp 1.1 ESE 1.11 in 0700 AM 07/29 COCORAHS 1 NW Fanwood 1.11 in 0700 AM 07/29 COCORAHS Westfield 1.05 in 0645 AM 07/29 COCORAHS Westfield 0.8 WSW 0.91 in 0646 AM 07/29 COCORAHS Newark Airport 0.56 in 0651 PM 07/29 ASOS ...New York... ...Bronx County... 1 NE Harlem 0.66 in 0954 AM 07/29 AWS Fordham 0.57 in 0955 AM 07/29 NYSM ...Kings County... Sheepshead Bay 0.86 in 0700 PM 07/29 CWOP BROOKLYN 0.72 in 0945 AM 07/29 CWOP BROOKLYN 0.68 in 0709 PM 07/29 CWOP Brooklyn 0.65 in 0707 PM 07/29 CWOP Dyker Heights 0.64 in 0710 PM 07/29 CWOP Brooklyn 1.2 W 0.62 in 0700 AM 07/29 COCORAHS Prospect Park 0.57 in 0710 PM 07/29 AWS Brooklyn 2.1 WNW 0.54 in 0756 AM 07/29 COCORAHS South Slope 0.54 in 0947 AM 07/29 CWOP Brooklyn College 0.52 in 0715 PM 07/29 NYSM ...Nassau County... Bethpage 2.15 in 0953 AM 07/29 AWS Hicksville 1.79 in 0947 AM 07/29 CWOP North Massapequa 1.78 in 0945 AM 07/29 CWOP Massapequa Park 1.72 in 0945 AM 07/29 CWOP Massapequa Park 1.61 in 0700 AM 07/29 COCORAHS Levittown 1.57 in 0710 PM 07/29 AWS Farmingdale 1.55 in 0945 AM 07/29 CWOP 1 N Merrick 1.45 in 0950 AM 07/29 AWS Syosset 1.37 in 0950 AM 07/29 CWOP MASSAPEQUA 1.35 in 0950 AM 07/29 CWOP SYOSSET 1.32 in 0709 PM 07/29 CWOP Wantagh 1.30 in 0715 PM 07/29 NYSM Bellmore 1.26 in 0700 AM 07/29 COCORAHS MASSAPEQUA 1.22 in 0949 AM 07/29 CWOP Merrick 1.21 in 0710 PM 07/29 CWOP OLD WESTBURY 1.17 in 0945 AM 07/29 CWOP Bellmore 1.04 in 0709 PM 07/29 CWOP Oyster Bay 0.99 in 0700 PM 07/29 CWOP Freeport 0.95 in 0955 AM 07/29 AWS Muttontown 0.95 in 0710 PM 07/29 CWOP North Merrick 0.88 in 0945 AM 07/29 CWOP PORT WASHINGTON 0.67 in 0945 AM 07/29 CWOP Atoc - Plainview 0.65 in 0935 AM 07/29 RAWS LONG BEACH 0.63 in 0709 PM 07/29 CWOP Albertson 0.2 SSE 0.62 in 0700 AM 07/29 COCORAHS Port Washington 0.60 in 0715 PM 07/29 AWS East Rockaway 0.54 in 0709 PM 07/29 CWOP Herricks 0.52 in 0700 AM 07/29 COCORAHS Franklin Square 1.1 N 0.51 in 0700 AM 07/29 COCORAHS ...New York (Manhattan) County... Central Park 1.06 in 0715 PM 07/29 AWS Central Park 1.02 in 0951 AM 07/29 ASOS NEW YORK 0.83 in 0947 AM 07/29 CWOP New York 0.78 in 0700 PM 07/29 CWOP Washington Heights 0.71 in 0950 AM 07/29 AWS Midtown Manhattan 0.65 in 0710 PM 07/29 AWS Battery Park 0.60 in 0954 AM 07/29 AWS ...Orange County... US Military Academy 3.71 in 0855 AM 07/29 RAWS 0.8 N Port Jervis 2.54 in 0700 AM 07/29 COOP Monroe 0.8 N 2.13 in 0800 AM 07/29 COCORAHS Tuxedo Park 2.06 in 0955 AM 07/29 AWS Port Jervis 2.02 in 0946 AM 07/29 CWOP Port Jervis 1.95 in 0955 AM 07/29 AWS Port Jervis 1.93 in 0630 AM 07/29 COCORAHS CORNWALL ON HUDSON 1.91 in 0949 AM 07/29 CWOP NEW WINDSOR 1.91 in 0949 AM 07/29 CWOP Greenwood Lake 1.86 in 0815 AM 07/29 COCORAHS New Windsor 3.3 W 1.81 in 0808 AM 07/29 COCORAHS Otisville 1.77 in 0955 AM 07/29 NYSM Montgomery 1.73 in 0945 AM 07/29 CWOP 2.6 NW Tuxedo Park 1.68 in 0645 PM 07/29 HADS Vails Gate 1.67 in 0946 AM 07/29 CWOP Harriman 1.57 in 0955 AM 07/29 AWS Montgomery Airport 1.51 in 0954 AM 07/29 AWOS 4 SSE Middletown 1.47 in 0920 AM 07/29 AWS Warwick 1.46 in 0700 AM 07/29 COCORAHS Warwick 3.9 W 1.44 in 0600 AM 07/29 COCORAHS Chester 1.23 in 0950 AM 07/29 CWOP West Point 1.22 in 1127 PM 07/28 AWS Walden 1.06 in 0944 AM 07/29 CWOP ...Putnam County... Cold Spring 8.22 in 0700 AM 07/29 COCORAHS Nelsonville 0.3 S 6.36 in 0700 AM 07/29 COCORAHS Garrison 1.5 NE 5.61 in 0700 AM 07/29 COCORAHS Lake Carmel 0.7 NE 2.70 in 0700 AM 07/29 COCORAHS Lake Carmel 2.58 in 0707 PM 07/29 CWOP 3 NW Putnam Lake 2.12 in 1138 AM 07/29 COCORAHS Brewster 1.75 in 0955 AM 07/29 NYSM Mahopac 1.17 in 0955 AM 07/29 AWS ...Queens County... MIDDLE VILLAGE 1.95 in 0950 AM 07/29 CWOP Beechhurst 1.10 in 0950 AM 07/29 CWOP LONG ISLAND CITY 0.76 in 0945 AM 07/29 CWOP NYC/La Guardia 0.75 in 0651 PM 07/29 ASOS Howard Beach 0.74 in 0700 AM 07/29 COCORAHS OZONE PARK 0.74 in 0947 AM 07/29 CWOP Little Neck 0.3 SE 0.62 in 0530 AM 07/29 COCORAHS Kew Garden Hills 0.51 in 0955 AM 07/29 NYSM ...Richmond County... Eltingville 2.84 in 0945 AM 07/29 CWOP College of Staten Island 2.78 in 0955 AM 07/29 NYSM Staten Island (Willowbrook) 2.34 in 0700 AM 07/29 COCORAHS Staten Island 7.1 SW 0.90 in 0641 AM 07/29 COCORAHS ...Rockland County... New City 4.22 in 0953 AM 07/29 AWS Stony Point 4.16 in 0954 AM 07/29 AWS Spring Valley 1.7 SSW 3.94 in 0830 AM 07/29 COCORAHS Nanuet 3.77 in 0930 AM 07/29 IFLOWS Spring Valley 3.68 in 0945 AM 07/29 CWOP Bardonia 3.56 in 0953 AM 07/29 AWS 1 NW Stony Point 3.53 in 1100 AM 07/29 Cocorahs Pomona 3.47 in 0954 AM 07/29 AWS New Hempstead 0.6 SE 3.43 in 0928 AM 07/29 COCORAHS Suffern 3.41 in 0955 AM 07/29 NYSM Stony Point 3.22 in 0700 AM 07/29 COCORAHS Blauvelt 3.10 in 0945 AM 07/29 CWOP Montebello 2.98 in 0945 AM 07/29 CWOP 1 SSW Mount Ivy 2.95 in 0714 PM 07/29 AWS ...Suffolk County... SMITHTOWN 2.99 in 0700 PM 07/29 CWOP Stony Brook 2.90 in 0701 PM 07/29 CWOP Selden 1.6 ESE 2.82 in 0700 AM 07/29 COCORAHS Smithtown 2.0 SSW 2.69 in 0800 AM 07/29 COCORAHS Centereach 2.64 in 0700 AM 07/29 COCORAHS Setauket-East Setauket 2.1 W 2.54 in 0600 AM 07/29 COCORAHS COMMACK 2.51 in 0710 PM 07/29 CWOP Stony Brook 2.46 in 0715 PM 07/29 NYSM ISLIP 2.45 in 0700 PM 07/29 CWOP North Patchogue 2.43 in 0710 PM 07/29 CWOP Bay Shore 2.7 NNW 2.40 in 0810 AM 07/29 COCORAHS Old Field 2.40 in 0715 PM 07/29 AWS Blue Point 2.34 in 0700 PM 07/29 CWOP Setauket-East Setauket 0.7 S 2.28 in 0700 AM 07/29 COCORAHS Copiague 0.4 ENE 2.15 in 0800 AM 07/29 COCORAHS Saint James 2.15 in 0707 PM 07/29 CWOP Islip Airport 2.12 in 0800 PM 07/29 ASOS East Setauket 2.08 in 0949 AM 07/29 CWOP Mount Sinai 2.07 in 0800 AM 07/29 COOP Lindenhurst 1.0 NE 1.98 in 1100 AM 07/29 COCORAHS Patchogue 0.9 SE 1.95 in 0530 AM 07/29 COCORAHS Northport 1.93 in 0705 PM 07/29 CWOP Upton 1.90 in 0800 PM 07/29 COOP Center Moriches 1.89 in 0600 AM 07/29 COCORAHS Port Jefferson Station 1.85 in 0830 AM 07/29 COCORAHS Islip Terrace 0.5 W 1.81 in 0700 AM 07/29 COCORAHS Islip Terrace 1.80 in 0800 AM 07/29 COCORAHS 1 SSE Manorville 1.76 in 0800 AM 07/29 COCORAHS Centerport 1.1 SE 1.75 in 0700 AM 07/29 COCORAHS Miller Place 1.75 in 0945 AM 07/29 CWOP Amityville 0.3 NNW 1.71 in 0624 AM 07/29 COCORAHS Dix Hills 1.65 in 0949 AM 07/29 CWOP Manorville 2.8 NE 1.63 in 0900 AM 07/29 COCORAHS Melville 1.63 in 0945 AM 07/29 CWOP Amityville 1.61 in 0800 AM 07/29 COCORAHS Sayville 1.60 in 0710 PM 07/29 CWOP Sayville 0.0 N 1.58 in 0700 AM 07/29 COCORAHS Wading River 0.3 N 1.57 in 0700 AM 07/29 COCORAHS Shirley 1.49 in 0945 AM 07/29 CWOP Amityville 1.48 in 0800 AM 07/29 COCORAHS 2 E Dix Hills 1.45 in 0715 PM 07/29 AWS Kings Park 1.45 in 0700 PM 07/29 CWOP Remsenburg 1.44 in 0705 PM 07/29 CWOP Eastport 1.37 in 0645 PM 07/29 RAWS Brightwaters 1.35 in 0800 AM 07/29 COCORAHS 2 WNW Riverhead 1.35 in 0713 PM 07/29 AWS Nesconset 1.34 in 0903 AM 07/29 COCORAHS N. Babylon 1.30 in 0950 AM 07/29 CWOP West Gilgo Beach 1.30 in 0710 PM 07/29 CWOP Brightwaters 1.28 in 0700 AM 07/29 COCORAHS Centerport 1.26 in 0700 AM 07/29 COOP ORIENT 1.21 in 0710 PM 07/29 CWOP FAIR HARBOR 1.20 in 0708 PM 07/29 CWOP Remsenburg-Speonk 0.9 NE 1.20 in 0745 AM 07/29 COCORAHS Westhampton Airport 1.19 in 0653 PM 07/29 ASOS Shirley 1.11 in 0700 AM 07/29 COCORAHS West Islip 1.09 in 1212 PM 07/29 Trained Spotter East Hampton 1.05 in 0700 PM 07/29 CWOP Huntington 2.0 NNE 1.05 in 0830 AM 07/29 COCORAHS North Babylon 1.05 in 0545 PM 07/29 CWOP 1 E East Hampton Airport 1.02 in 0655 PM 07/29 AWOS Mattituck 1.02 in 0900 AM 07/29 COCORAHS Baiting Hollow 1.01 in 0700 AM 07/29 COOP Orient Point 1.00 in 0800 AM 07/29 COOP Orient 0.85 in 0950 AM 07/29 CWOP Farmingdale Airport 0.82 in 0953 AM 07/29 ASOS Mattituck 1.4 SSE 0.80 in 0907 AM 07/29 COCORAHS Southold 0.74 in 0705 PM 07/29 CWOP Southold 1.0 SW 0.56 in 0800 AM 07/29 COCORAHS Southold 0.6 S 0.53 in 0730 AM 07/29 COCORAHS Montauk Airport 0.51 in 0654 PM 07/29 ASOS Southold 1.5 NNE 0.50 in 0700 AM 07/29 COCORAHS ...Westchester County... 1 S Peekskill 6.04 in 0622 AM 07/29 Trained Spotter Shrub Oak 5.62 in 0700 AM 07/29 COCORAHS Yorktown Heights 2.7 NNW 5.62 in 0700 AM 07/29 COCORAHS Peekskill 2.8 NNE 5.52 in 0800 AM 07/29 COCORAHS Ossining 4.15 in 0948 AM 07/29 CWOP Somers 3.09 in 0955 AM 07/29 NYSM Briarcliff Manor 2.60 in 0700 AM 07/29 COCORAHS Yorktown Heights 2.58 in 0950 AM 07/29 AWS 1 S Peach Lake 2.00 in 0955 AM 07/29 AWS CHAPPAQUA 1.95 in 0949 AM 07/29 CWOP South Salem 1.83 in 0747 AM 07/29 COCORAHS Rye Brook 1.81 in 0954 AM 07/29 AWS Tarrytown 1.73 in 0707 PM 07/29 CWOP Pleasantville 1.71 in 0715 PM 07/29 AWS Thornwood 1.71 in 1102 AM 07/29 COCORAHS Armonk 1.62 in 0800 AM 07/29 COCORAHS Armonk 1.40 in 0945 AM 07/29 CWOP PORT CHESTER 1.37 in 0706 PM 07/29 CWOP 3 ESE Goldens Bridge 1.28 in 0955 AM 07/29 AWS 1 SSE Hartsdale 1.17 in 0955 AM 07/29 AWS 1 NW Rye 1.17 in 0953 AM 07/29 AWS Rye 0.86 in 0955 AM 07/29 AWS Bronxville 0.74 in 0713 PM 07/29 AWS Eastchester 0.6 WSW 0.71 in 0600 AM 07/29 COCORAHS SCARSDALE 0.71 in 0945 AM 07/29 CWOP New Rochelle 0.69 in 0945 AM 07/29 CWOP ...Maritime Stations... Annandale 0.9 WSW 2.87 in 0700 AM 07/29 COCORAHS Bay Shore 1.54 in 0705 PM 07/29 CWOP
-
Tomorrow and Friday will see a continuation of below normal readings. Temperatures could return to near seasonable levels for the weekend. The ENSO Region 1+2 anomaly was +3.8°C and the Region 3.4 anomaly was +2.2°C for the week centered around July 23. For the past six weeks, the ENSO Region 1+2 anomaly has averaged +3.38°C and the ENSO Region 3.4 anomaly has averaged +1.92°C. The ongoing strong El Niño will continue to strengthen through the summer. The SOI was -27.64 today. The preliminary Arctic Oscillation (AO) was -0.193 today. Based on sensitivity analysis applied to the latest guidance, there is an implied near 100% probability that New York City will have a cooler than normal July (1991-2020 normal). July will likely finish with a mean temperature near 76.3° (1.2° below normal). Supplemental Information: The projected mean would be 0.2° below the 1981-2010 normal monthly value.
-
Occasional Thoughts on Climate Change
donsutherland1 replied to donsutherland1's topic in Climate Change
Monthly and all-time record heat returned to heatwave- and wildfire-swept France today.
-
Occasional Thoughts on Climate Change
donsutherland1 replied to donsutherland1's topic in Climate Change
These latest findings aren't really a surprise. Jessica Tierney et al., came across cloud-related changes that amplified Eocene warming during a high CO2 regime. These findings suggest that the so-called "hot models" might be actually be the more realistic ones in simulating a high C02 climate with high sensitivity.