Jump to content

frd

Members
  • Posts

    7,202
  • Joined

  • Last visited

Everything posted by frd

  1. Also record negative streak possibly
  2. You can clearly see the epicenter of the wild fires in this animation if you look in the NW part of the video https://www.star.nesdis.noaa.gov/GOES/sector_band.php?sat=G19&sector=cgl&band=GEOCOLOR&length=24 or the still frame
  3. Looks like our area is worse tomorrow as well. Dense smoke plume arrives tomorrow. https://x.com/weather_buffalo/status/2077091092860694878 The latest HRRR shows some absolutely insane smoke on Thursday across WNY. If it comes to fruition it would be much worse than what we experienced a few years ago in 2023.
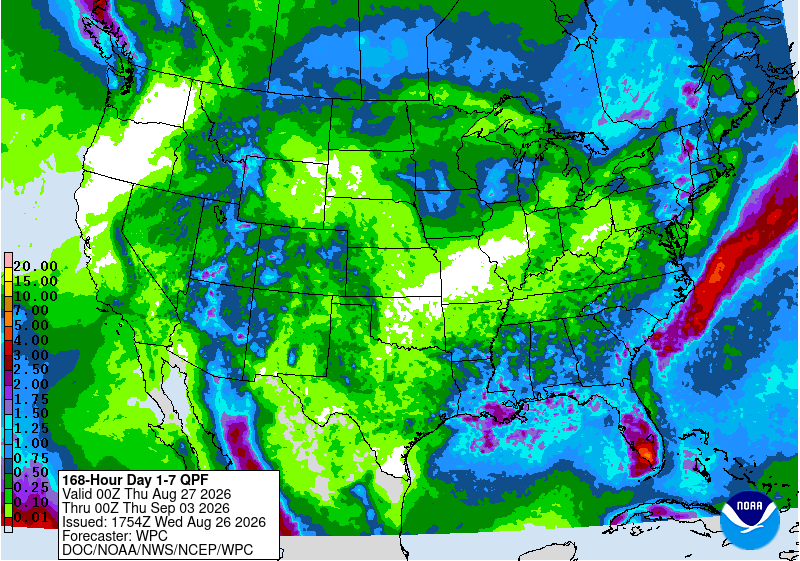
  4. I can certainly see that too. Maybe a couple of degrees cooler would be possible. Never hit the forecasted high here today. Tomorrow's HRR smoke forecast is even worse, but I have not looked at the latest update.
  5. That would be cool. Still looks active starting Saturday and continuing a while afterwards. We cool off and then maybe another heatwave early August looking at model clusters. Meanwhile, I believe I bserve smoke overhead. Skies are milky white. Currently here Current conditions at Wilmington Airport (KILG) Lat: 39.67°NLon: 75.61°WElev: 72ft. Fair 88°F 31°C Humidity 55% Wind Speed W 10 G 17 mph Barometer 30.12 in (1019.9 mb) Dewpoint 70°F (21°C) Visibility 10.00 mi Heat Index 93°F (34°C) Last update 14 Jul 12:51 pm EDT
  6. This is crazy too, but over the Atlantic, granted hour 288 but still.
  7. SOI Dashboard Latest Southern Oscillation Index values SOI values for 14 Jul, 2026 Average SOI for last 30 days -23.53 Average SOI for last 90 days -17.62 Daily contribution to SOI calculation -36.56 Monthly average SOI values Apr -9.88 May -13.22 Jun -22.69 Date Tahiti (hPa) Darwin (hPa) Daily Contribution 30 day Av. SOI 90 day Av. SOI 14 Jul 2026 1011.36 1016.35 -36.56 -23.53 -17.62 13 Jul 2026 1010.44 1015.10 -34.53 -23.20 -17.20 12 Jul 2026 1009.89 1015.20 -38.53 -23.21 -16.92 11 Jul 2026 1011.77 1015.80 -30.66 -23.06 -16.66 10 Jul 2026 1013.16 1015.45 -19.94 -22.84 -16.52 9 Jul 2026 1011.59 1014.45 -23.45 -22.68 -16.60 8 Jul 2026 1008.90 1015.20 -44.63 -22.32 -16.71 7 Jul 2026 1009.02 1015.35 -44.81 -21.68 -16.58 6 Jul 2026 1011.31 1015.45 -31.33 -21.34 -16.28 5 Jul 2026 1010.44 1015.25 -35.46 -21.21 -16.03 4 Jul 2026 1010.84 1015.20 -32.69 -21.02 -15.72 3 Jul 2026 1012.59 1014.20 -15.76 -21.11 -15.44 2 Jul 2026 1012.97 1013.80 -10.96 -21.75 -15.38 1 Jul 2026 1013.06 1012.90 -4.86 -22.28 -15.31 30 Jun 2026 1012.34 1013.05 -14.06 -22.69 -15.35 29 Jun 2026 1012.32 1013.40 -16.66 -22.71 -15.25 28 Jun 2026 1012.24 1013.25 -16.17 -23.03 -15.20 27 Jun 2026 1011.64 1014.05 -26.01 -23.61 -15.12 26 Jun 2026 1012.48 1015.20 -28.19 -23.51 -14.93 25 Jun 2026 1012.84 1015.15 -25.31 -22.78 -14.75 24 Jun 2026 1011.76 1015.15 -32.90 -22.11 -14.60 23 Jun 2026 1011.31 1015.45 -38.17 -21.86 -14.34 22 Jun 2026 1012.65 1016.30 -34.73 -21.65 -14.02 21 Jun 2026 1014.99 1017.00 -23.20 -21.10 -13.63 20 Jun 2026 1015.10 1016.25 -17.15 -20.98 -13.17 19 Jun 2026 1014.90 1014.50 -6.26 -21.36 -12.93 18 Jun 2026 1015.57 1014.80 -3.66 -21.66 -12.87 17 Jun 2026 1016.03 1015.35 -4.29 -21.73 -12.88 16 Jun 2026 1015.83 1014.90 -2.53 -21.79 -12.82 15 Jun 2026 1014.24 1014.70 -12.30 -22.62 -12.75
  8. Watch out for wildfire smoke today. https://x.com/troydweather/status/2076968763023294948 Canadian wildfire smoke heads into the upper Midwest and Northeast today! Look for hazy skies today from the smoke but a better chance it reaches the surface tomorrow night.
  9. Wetter period after the heat wave looking more likely.
  10. https://www.wpc.ncep.noaa.gov/discussions/hpcdiscussions.php?disc=pmdepd Multiple rounds of rain/thunderstorms are also possible from the Great Lakes and Ohio Valley to the East Coast as shortwaves and frontal systems focus moisture through the period. Marginal Risks of flash flooding are delineated for the Great Lakes/Ohio Valley to Appalachians on Friday, and stretching into the Mid-Atlantic on Saturday. Tate
  11. Ring of fire pathway 7 day totals
  12. Day 4 NSSL machine learning likes a day 4 threat and days 9, 10 and 11 as an active period. https://x.com/TylerSebreezy/status/2076303103263932677 The latest NSSL machine-learning severe probabilities highlight a potential northwest flow setup for a handful of days across the eastern U.S. The risk of some strong to severe storms appears evident at times.
  13. Max heat begins to move West later this week.
  14. https://www.spc.noaa.gov/products/exper/day4-8/# ... Friday/Day 6 -- Mid-Atlantic Region ... This evening's deterministic guidance suite (20260712 00 UTC), along with yesterday morning's deterministic guidance suite (20260711 12 UTC), is faster moving the surface boundary south than last night's guidance suite (20260711 00 UTC). However, the overall ensemble guidance continues to suggest severe potential across the region, owing to differences in the position of the surface boundary and the timing of mid-level vorticity maxima. Severe probabilities (15%) have been retained with this forecast in a nod to the ensemble guidance suite, but if the current trend of pushing the surface boundary farther south on Thursday (Day 5) continues, severe weather probabilities may need to be removed as the surface boundary will push south of the better deep-layer shear. ..Marsh.. 07/12/2026
  15. https://forecast.weather.gov/product.php?site=PHI&issuedby=PHI&product=AFD&format=CI&version=1&glossary=1&highlight=off KEY MESSAGE 4...Friday could be active and unsettled with a chance for showers and thunderstorms, some of which could be severe. We are still several days out but we are monitoring the severe weather setup on Friday. The Storm Prediction Center (SPC) has highlighted most of the area in a Slight Risk (15% chance of severe thunderstorms 25 miles from any point). Storms look to be driven by a strong cold front swinging in from the northwest and with ample daytime heating and instability, the ingredients are certainly there for strong to severe thunderstorms and damaging wind gusts. In their long term outlook, SPC did mention some small MCS potential during the day 7 to 10 period as some shortwaves are likely to ripple through the northwest flow. Again, still several days out, but we will have to monitor the severe weather potential for the end of the week and possibly next weekend.
  16. True, that is why I mentioned the area further upstream in PA. Yeah, its a considerable distance from you, but moving on a trajectory to head South and be on the Eastern Shore. Currently that area is warned with a STW and a FFW. ( More than likely that area may dissipate looking at the lastest trends. ) Storms that were headed towards me went poof.
  17. I hope you get nailed pretty good later. Would be great if the energy /storms near Lancaster, PA settled over you area later this evening.
  18. Without question storms are certainly firing up. When looking at the hi res radar you can see it perfectly. Pretty cool !
  19. Interesting boundary from the storms in South Jersey is moving SW through Northern DE into NE MD, causing storms to fire. I just missed one to my South.
×
×
  • Create New...