frd
-
Posts
6,643 -
Joined
-
Last visited
Content Type
Profiles
Blogs
Forums
American Weather
Media Demo
Store
Gallery
Everything posted by frd
-
Looking at the Dover radar some very isolated cells forming and moving NE from the central Chessy Bay. Looks to headed towards the upper Eastern Shore.
-
Your thinking that line out in Western PA. keeps together and drops South and East as the evening progresses ? Then I believe the general idea is it stalls, and depending where it stalls you then get that flood threat tomorrow late day and evening. As mentioned by Mount Holly. The system later in the week is progged to be a strong one, the last in the series. Saturday might be a great beach day. Then I see showers introduced into the forecasts again for Sunday. Not a long break in rainfall if indeed that is true.
-
Severe really of the table conus-wide as things have calmed down considerably.
-
My bad, sorry, I did not mean for that video to take up valuable space here, it was meant for banter.
- 2,802 replies
-
- 2
-

-
- severe
- thunderstorms
- (and 4 more)
-
@mappy I am guessing you missed the majority of the storms mappy ? I think you are located near the PA and MD line out West, and at the recent Southern boundary of the most active severe weather in PA, is that right ? One thing for sure, I did get a lot of rain yesterday, and I missed a warned celll to my South by a few miles.
-
Townsend/Warwick aera... Delaware to my South getting hit pretty good right now. To this day still figuring out why so many nasty storms miss to my South , maybe the canal ( C & D ) and waterway, not sure.
-
It sure has mappy. In my region last night I watched the movement of a radar indicated tornado in Cumberland county, NJ. as it tracked SE across extreme SW New Jersey. This morning I discovered it must have maintained itself or touched down again further SE over the waters near Fortescue, NJ. A fishing boat captain took this photo. Pretty cool image right there.
- 2,802 replies
-
- 4
-
-
- severe
- thunderstorms
- (and 4 more)
-
Great insights, thanks .....With all the media coverage by the local news networks, at least in my viewing area last evening, a lot of folks are on edge. Accu-weather was doing detailed play by play on hail cores, trajectories, rotations and other cool visuals. I enjoyed watching it. Its been a while where there have been several days in a row of severe weather in my parts, let alone tornadoes, water spouts and baseball size hail up North.
- 2,802 replies
-
- 1
-
-
- severe
- thunderstorms
- (and 4 more)
-
Looking at the radar over the Midwest at this time and the general complex's movement I would agree that just around DC., and to it's North would be in for the goods later. And wow to the rainfall potential as well. I actually wonder if some rogue storms hit early near and around Baltimore before the main show later.
-
In regards to what you were saying @mappy about watches .... I had several Bradford pear trees I had went down a couple years ago, in a storm that did not have even have a warning, quick moving discrete cell, estimated winds of over 70 mph. In 30 years only a few watches for my area yielded a severe event. But, I understand and appreciate the reasoning with watches, and it is always best to be prepared. We are talking life, loved ones and property here. Kudos the the NWS and the SPC for what they do.
-
Things may be moving faster than anticipated - implications for later Area Forecast Discussion National Weather Service Mount Holly NJ 657 AM EDT Tue May 28 2019 .NEAR TERM /UNTIL 6 PM THIS EVENING/... 630 AM Update...The decaying MCS is moving through the area faster than expected. This may lead to an increased severe weather threat later this afternoon and evening. Otherwise, the forecast is on track.
-
Missed the heavy storms that went South of me on weekend but this line should make it here. Seems to be getting stronger as it move East.
-
Nature's washing machine
-
Its a dust bowl out there now
-
Interesting comment by HM about yesterday's severe event . I believe it is directed at his area, but worth reading over regardless.
-
Looking at Sunday do you think there is at least potential, even if not severe, for rainfall in the Northern parts of the sub forum including my area and the Eastern Shore ? Thanks ( and those photoshopped amateurs need to at least pick more realistic "fake " photos to use )
-
Yep, just nuts !
- 2,802 replies
-
- 1
-
-
- severe
- thunderstorms
- (and 4 more)
-
That is saying a lot. Remember that like it was yesterday. Sounded like a freightr train for a good 15 minutes , took down countless 50 to 200 feet Pines on the road in front of our development. Took many days to recover in regards to tree clean-up, and getting power to those who did not have underground electric hook-up. Interesting the enhanced area today, to a degree today fizzled, where as the slight risk become the real deal. Maybe the heating, and more sun, not sure.
-
Props to @high risk Good job ! He said the line would intensify for some areas and it did so. Some pretty impressive wind gusts and damage reports comming in now for areas far to my SW.
- 2,802 replies
-
- 1
-
-
- severe
- thunderstorms
- (and 4 more)
-
For Northern Delaware the incoming line dissapated, maybe a trace of rain at my location. What a dissapointment. Looks like Philly got hit and you guys from Baltimore SW got it good. So then continues the now growing dry spell for the majority of the Northern 1/3 of the Delmarva.
-
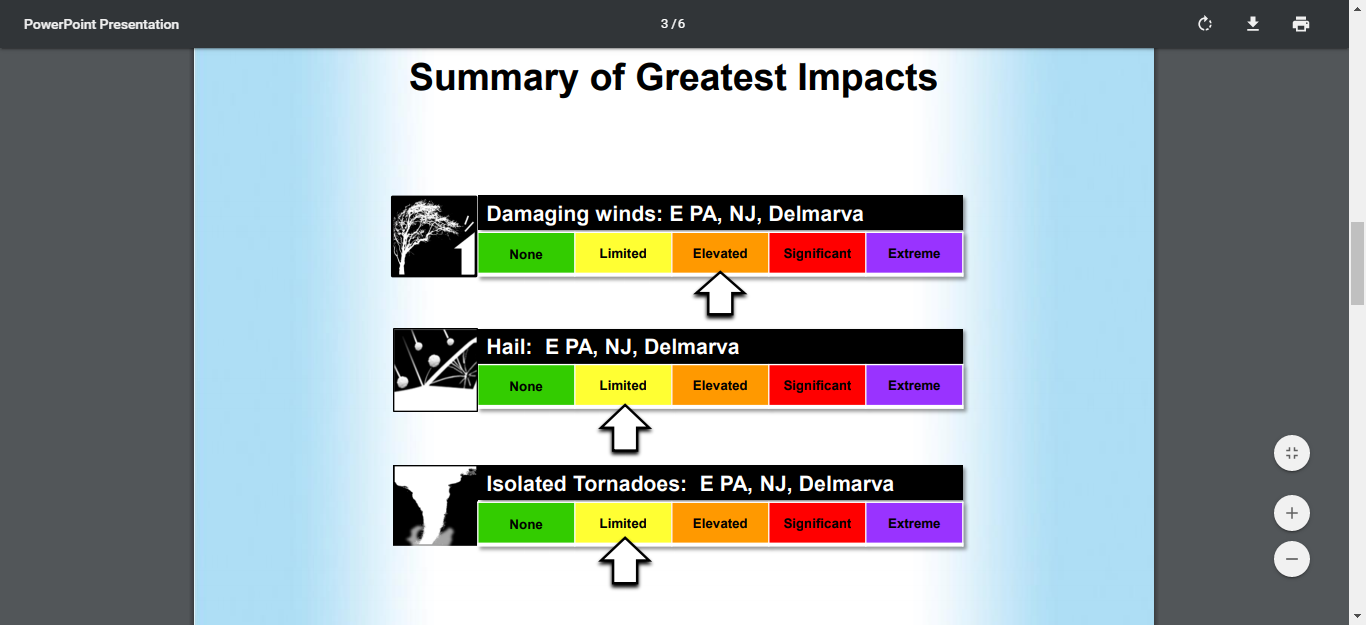
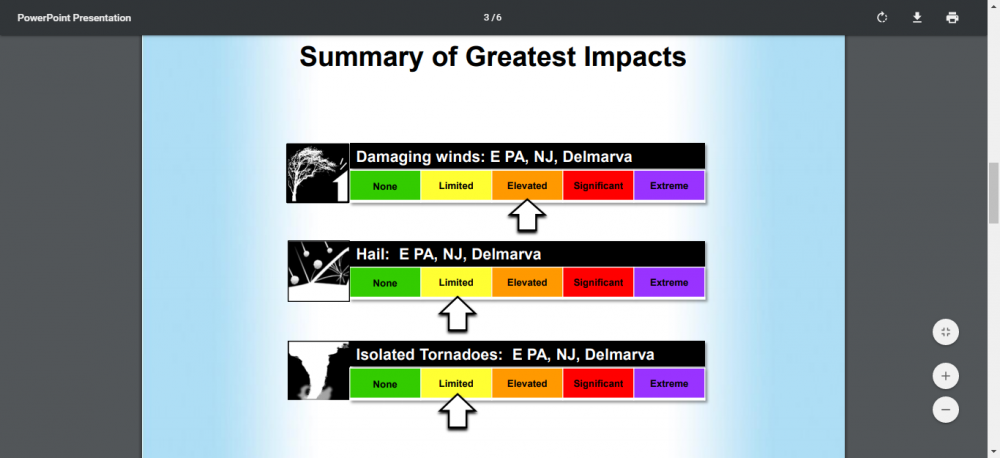
From Severe briefing NWS Mount Holly released this AM. For the NE part of the sub forum
-
I know your insight is much valued. But, maybe we can at least get some rainfall. In this case for the plants.
-
Wow, never knew that Moderate Risk only averages once every three years. That explains a lot about the frequency of severe weather in our parts.
-
Seems the HRRR idea of the mid afternoon storms having more impact than the Midwest complex slated for evening has gained a "bit" more support. But, as Mount Holly NWS states the Midwest complex needs to be watched Great job by Mount Holly in the discussion this AM. covers everything in detail ! This is just a snippet .NEAR TERM /UNTIL 6 PM THIS EVENING/... 630 update: Showers and thunderstorms will continue to move across northern portions of the forecast area (generally along and north of I-78) for the next couple hours. Occasional bursts of moderate rain will be the main concern with these AM storms. Regarding the stronger storm potential later in the day 06Z guidance has trended a bit more towards the HRRR solution in the morning discussion e.g. an initial line of stronger storms passing through the area mid-afternoon and then less activity in the evening (generally missing the area to the north). Consequently the line of storms currently extending through the Midwest will bear watching.
-
I know, but just mentioning be careful what you wish for. Already my garden is totally dry and top soil is very hard. It is amazing how quickly we lose ground moisture this time of year. Once-a- week rainfall would be awesome, but 14 days in summer in a row without rainfall is not great, if you have agriculture concerns, or have a garden. etc. Need to get my soaker hoses set up and straw or mulch the garden, it is about time shortly. Less rain has one advantage- less mosquittos - I hate them !