

OceanStWx
-
Posts
20,323 -
Joined
-
Last visited
Content Type
Profiles
Blogs
Forums
American Weather
Media Demo
Store
Gallery
Posts posted by OceanStWx
-
-
Just now, Damage In Tolland said:
What models besides the NAM and HREF which is NAM based ?
 It's 20% NAM.
-
 1
1
-
-
I think a good example is to watch the convection in the BGM CWA. It's not moving much. That is what will drift east over the next couple of days.
-
2
-
-

I'm just over here saying that whenever you see most (all?) of guidance spitting out some big numbers, it usually happens somewhere in a roughly CWA-sized area. The difficult part here is that this could be anywhere in the BOX/ALY/OKX CWAs.
-
3
-
 1
1
-
-
14 minutes ago, CoastalWx said:
The FF risk is wherever the warm front sets up. You aren’t getting 10” of deformation rain on 700 warm front.
I've seen enough guidance now though to think that 7+" is a reasonable max somewhere in the area.
-
1
-
1
-
-
2 minutes ago, Ginx snewx said:
Friend Kris sent this
Just came southbound on Route 32 and I have never seen anything damage wise like I just saw. It looks like a tornado went through the entire stretch from the 32 connector all the way up to Connecticut College, powerlines down, trees down everywhere. Roads are blocked off in some places and meanwhile at my house there’s not even a leaf that fell off a tree lol
Never say never, but I think this was good ol' fashioned straight line wind. That was a textbook bowing signature. You had a great signal for a rear inflow jet.
People are always surprised when they see real wind damage.
-
5
-
2
-
-
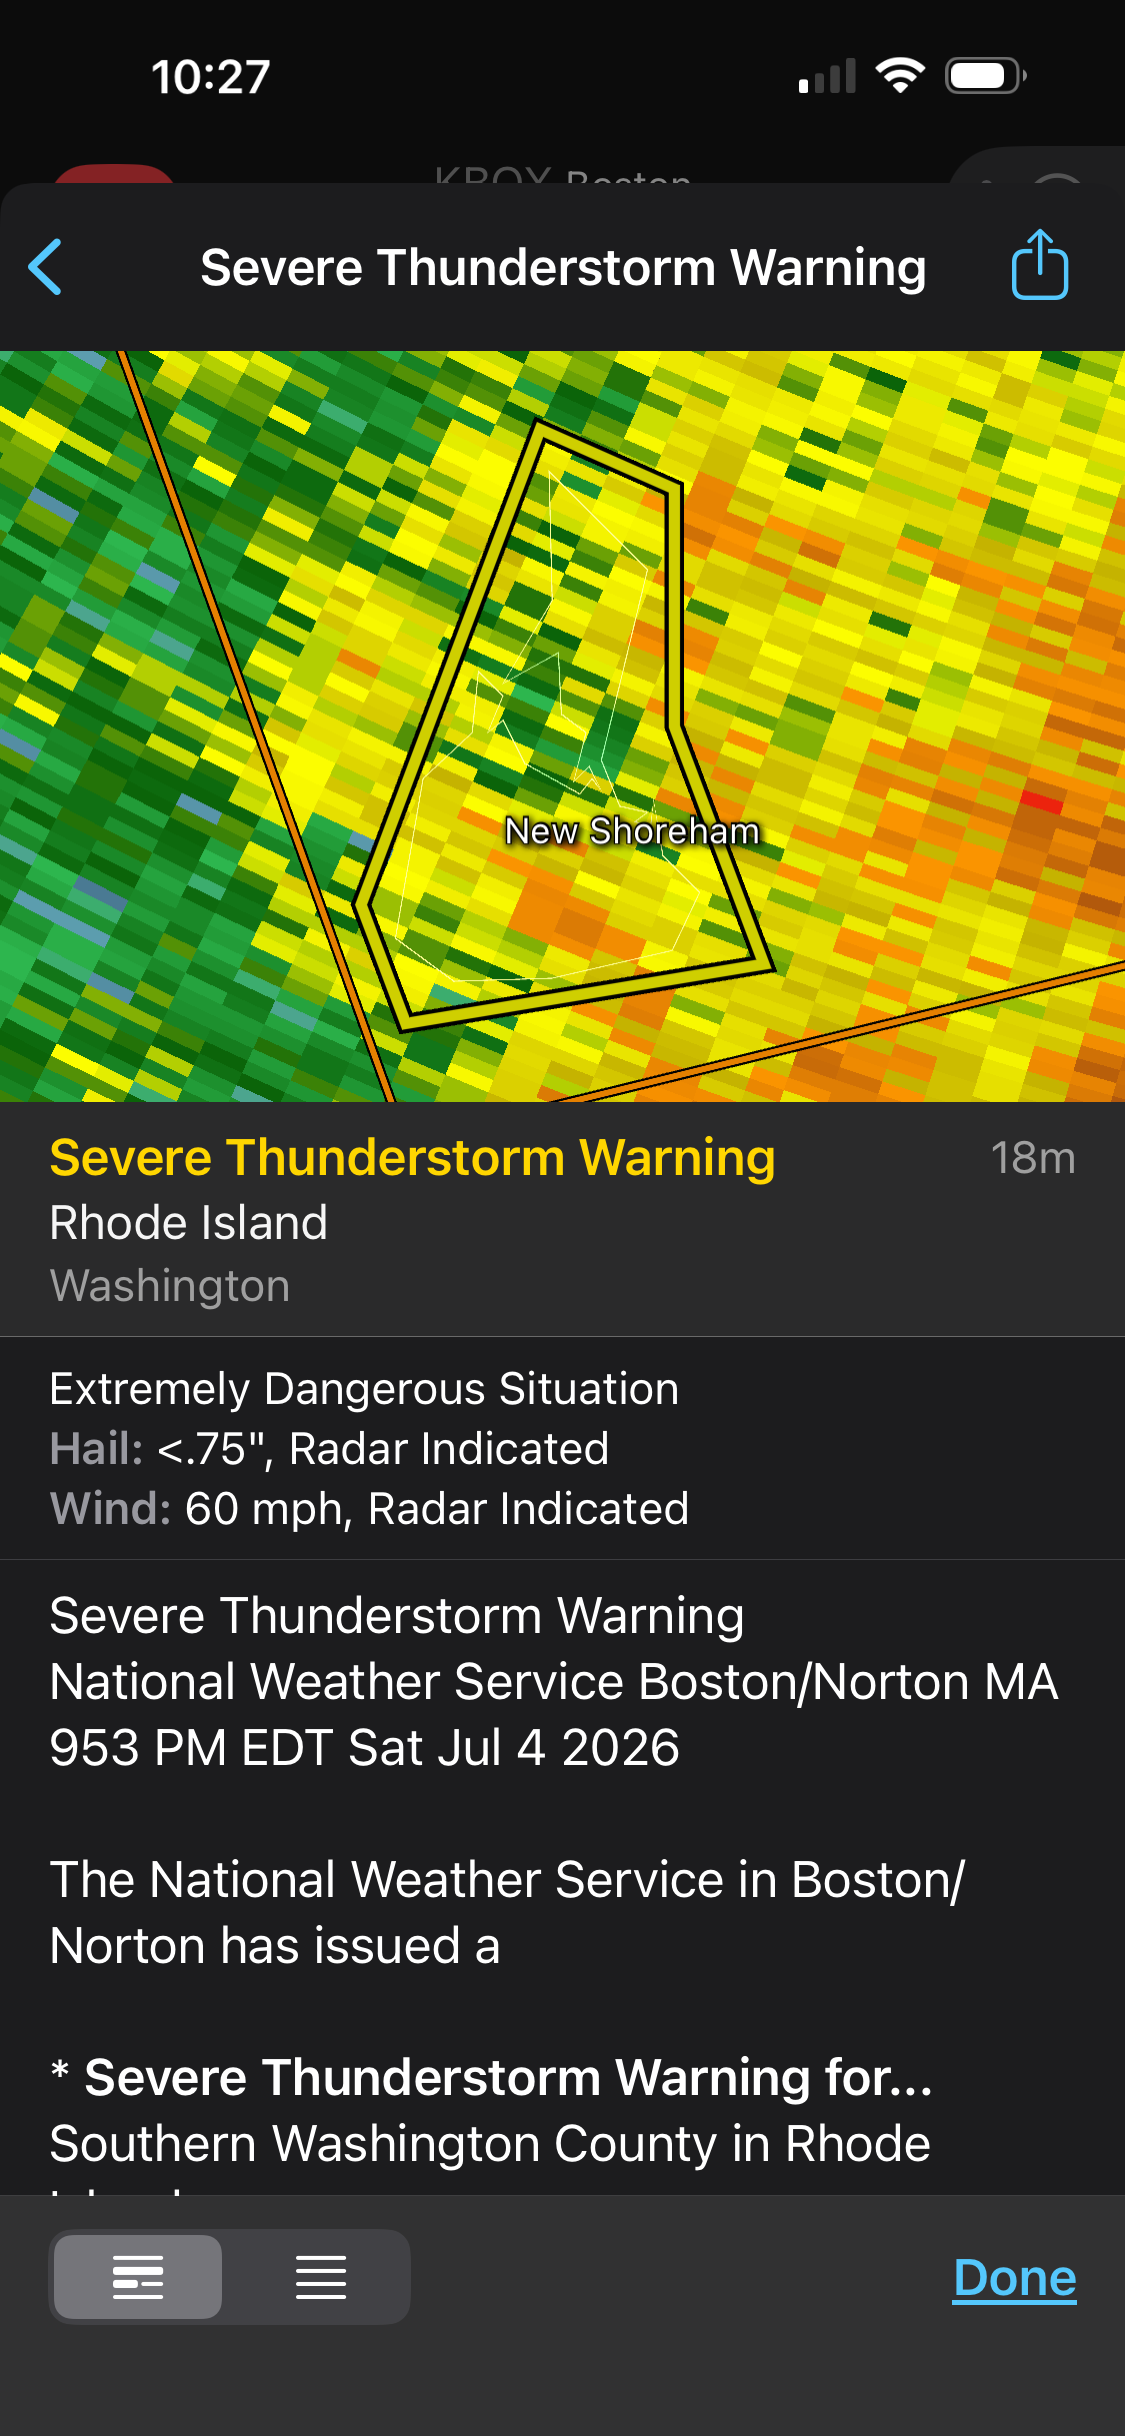
8 hours ago, vortex95 said:
Last evening, a PDS SVR was issued for Block Island. However, the warning stated 60 mph gusts. That is not PDS level (74 mph I believe is). Any insights?

It is either I issued originally with 70 mph and updated to 60 mph with a SVS and it never got rid of the original language, or I had also clicked the button for "this storm is producing widespread wind damage..." and it triggered that language.
Either way, the extremely dangerous situation is more for the observed nature of severe weather. PDSs are used for watches, emergencies are the tornado/severe thunderstorm related warnings.
-
2
-
-
1 minute ago, dendrite said:
Did Phil visit the OKX radar?

I bet they took a lightning strike.
-
 1
1
-
-
2 minutes ago, weatherwiz said:
Great way to keep a drink cold
Also that can is 2 inches wide.
We don't care how you report it, as long as we can measure it.
-
3
-
-
Just now, weatherwiz said:
The warning updated to say 2” observed
Hail threat was observed, I updated it to include up to 2 inch hail possible.
We've had golf balls so far, but MRMS was estimated between 2.25 and 2.75 inches.
-
 1
1
-
-
2 minutes ago, ineedsnow said:
18z NAM gone wild
Only 4.5 for Kev.

-
 1
1
-
-
Just now, weatherwiz said:
Agreed. The more I dig into the changes and thought about it, the changes are a great positive. The number of moderate risk/high risk issuances should be reduced and only conserved for events that hold true significant and widespread potential. And for our area at least, we maybe get those type of setups with that potential maybe once every five years, if lucky. Probably closer to 1:7.
The biggest issue with the change is that it only applies to organized severe, and we get quite a bit of disorganized severe. So microbursts fall outside of the scope of the outlooks.
-
1
-
-
5 minutes ago, weatherwiz said:
crazy to think a 45% sig 1 is still only an enhanced.
We may never even see a moderate risk in our area again

It was probably the goal.

But I do think widespread coverage of 45kt gusts probably doesn't deserve a moderate.
-
2 minutes ago, Damage In Tolland said:
Scooter is really good at sniffing these out and which ones are legit vs BS, which narrow zones might be favored etc. Dude has close to a million posts and the day we need him he’s laying at the bottom of Winni
Face down in Center Harbor.
-
1
-
-
2 minutes ago, powderfreak said:
I’d feel fairly confident in 1”+ for your location… but yeah, I guess like winter if folks are looking for jackpots those will be narrow.
Someone gets 1.5”, they’ll say they were Steined because somewhere else saw 4.5” and flash flooding.
His Davis mysteriously going offline this week.
-
3 minutes ago, weatherwiz said:
That is going to be they key I think to where the heaviest totals occur. Have to see where that sets up but sort of seems like that may be just north of SNE. We get into the heavy rains as it moves through but this might be maximized just north. I foresee one big band of rain lifting north then more showery
Congrats Dendrite
-
10 minutes ago, CT Rain said:
This is a big/strong signal for big rains.
Number of ensemble members pretty close to doubled overnight for the BDL area. I would be more willing to toss if there wasn't a band of warm advection f-gen on all models.
-
1
-
-
Just now, weatherwiz said:
Damn only 2 off
Next up JFK.
-
1
-
-
4 minutes ago, Damage In Tolland said:
I see 53mph EWR
That was the first gust front. 71 mph with the meatball.
-
2
-
-
Just now, weatherwiz said:
My guess is EWR will measure 64 knots
This complex has already had 3 ASOSs measure severe. That's good for around these parts.
-
1
-
1
-
-
5 minutes ago, Baroclinic Zone said:
Where the storms…?
Sitting at 93F at 730pm

About to wipe out EWR.
-
3 minutes ago, codfishsnowman said:
Interesting he's on the heavy rain train so it must have some merit
It's definitely a EPS heavy skew, but it's like half of the EPS members so it's not nothing.
-
2 minutes ago, dendrite said:
Aug 1944
What a stretch
It doesn't account for all the metal in Quincy shipyard distorting the temp record.
-
2
-
 1
1
-
-
8 minutes ago, Arnold214 said:
Kevin, shut your AC off. You're causing a brown out.
He's got it blasting at 60 degrees with a box fan blowing it out the slider onto the deck so he can enjoy the evening.
-
1
-
-
3 minutes ago, Damage In Tolland said:
High times ?
-
1
-
1
-
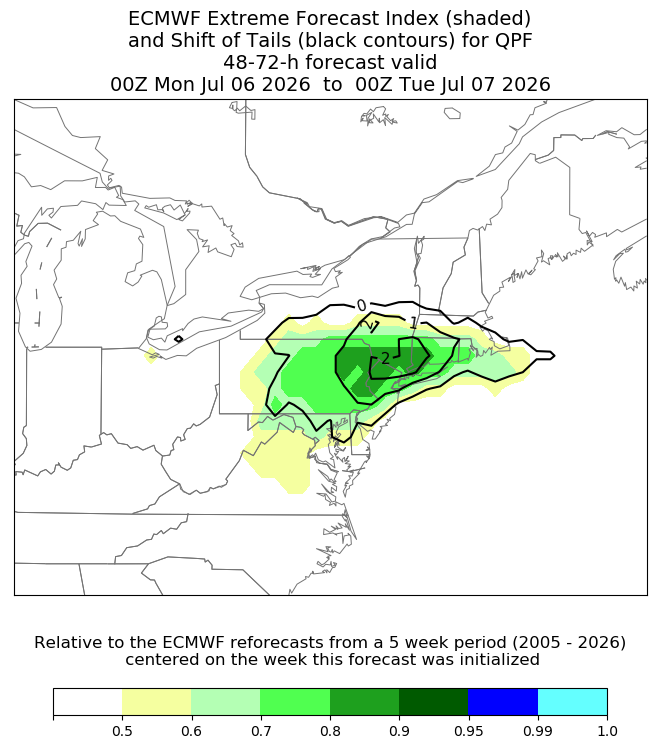
Hoisting the Sultan Signal: Heavy Rain Event July 5-7
in New England
Posted
It's a pretty cool visualization tool. More shading means that more ensemble members are showing something anomalous for the time of year. More black lines with higher numbers mean the most extreme ensemble members are quite extreme.