(002).png.f2cbd7c955dc3007a02ab79925b174ec.png)
ChescoWx
-
Posts
11,180 -
Joined
-
Last visited
Content Type
Profiles
Blogs
Forums
American Weather
Media Demo
Store
Gallery
Everything posted by ChescoWx
-
(002).thumb.png.6e3d9d46bca5fe41aab7a74871dd8af8.png)
E PA/NJ/DE Summer 2026 Obs/Discussion
ChescoWx replied to PhiEaglesfan712's topic in Philadelphia Region
With the exception of tomorrow temperatures over the next week should be near normal for late June with highs in the upper 70's to lower 80's. Thursday will be our warmest day of the week along with a chance of some showers. Lows over the weekend will return to the comfortable 50's for most spots across the area. Shower chances increase by Sunday night and through Monday.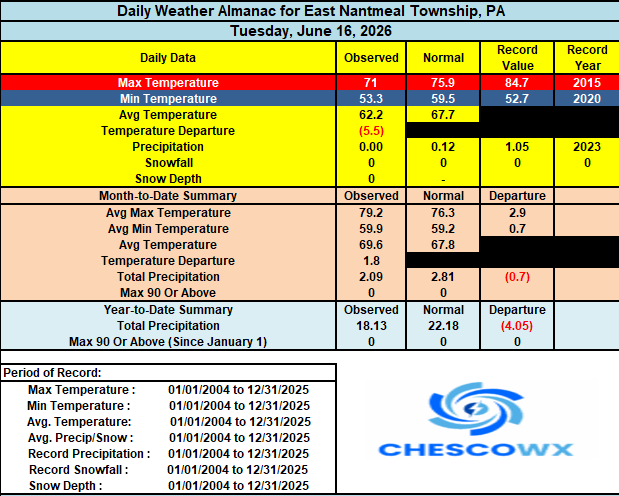
-
Central PA Summer 2026 Discussion/Obs Thread
ChescoWx replied to Voyager's topic in Upstate New York/Pennsylvania
Plenty of chilly lows in the 40's across Chesco valley locales this AM. The lowest I could find was the 45.8 low at our typical chilly spot up in Warwick Twp. Another near perfect day on tap today with highs from the mid 70's along the ridges to the upper 70's in the valleys. We warm up with shower chances both Wednesday night and Thursday with highs well into the 80's. We turn cooler again for the weekend with highs remaining in the 70's in the higher spots with lots of sunshine.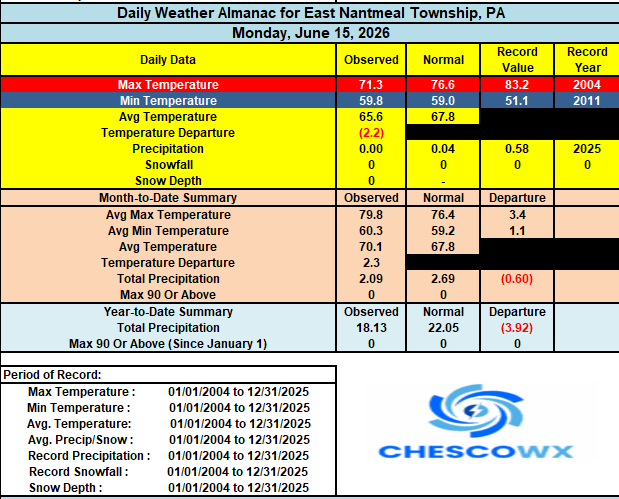

-
E PA/NJ/DE Summer 2026 Obs/Discussion
ChescoWx replied to PhiEaglesfan712's topic in Philadelphia Region
Plenty of chilly lows in the 40's across Chesco valley locales this AM. The lowest I could find was the 45.8 low at our typical chilly spot up in Warwick Twp. Another near perfect day on tap today with highs from the mid 70's along the ridges to the upper 70's in the valleys. We warm up with shower chances both Wednesday night and Thursday with highs well into the 80's. We turn cooler again for the weekend with highs remaining in the 70's in the higher spots with lots of sunshine.
-
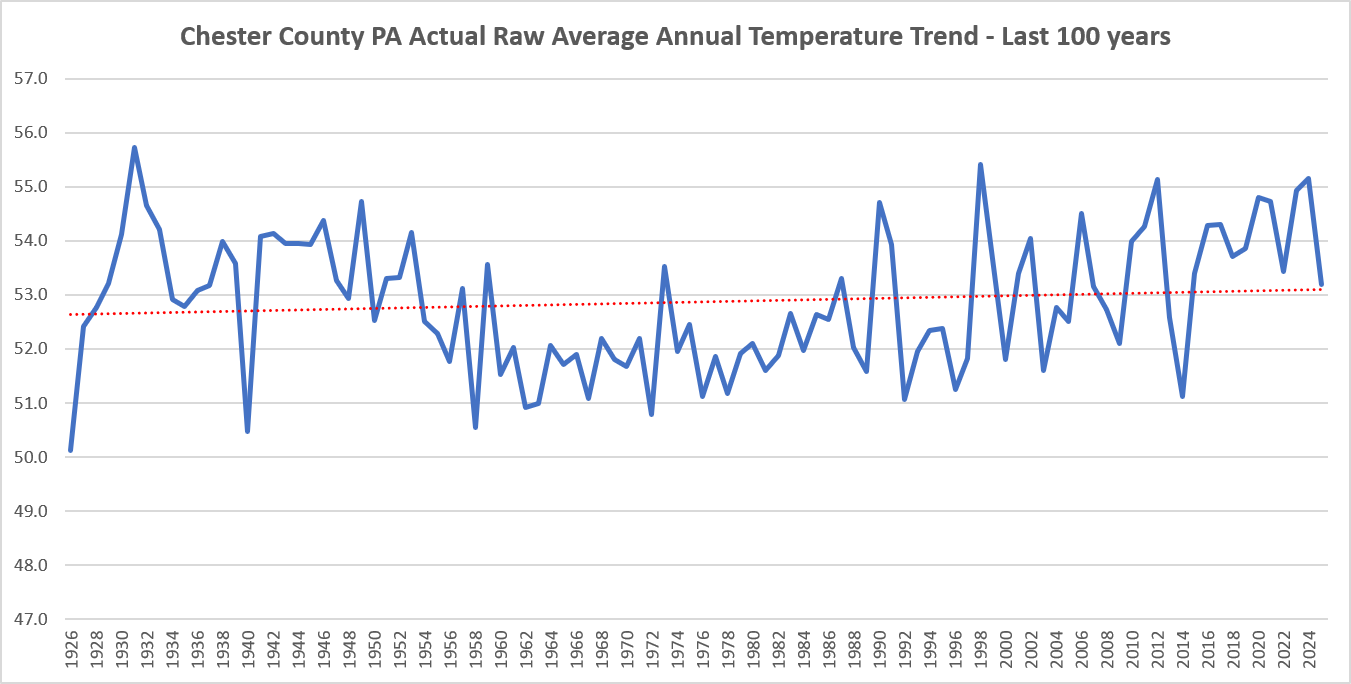
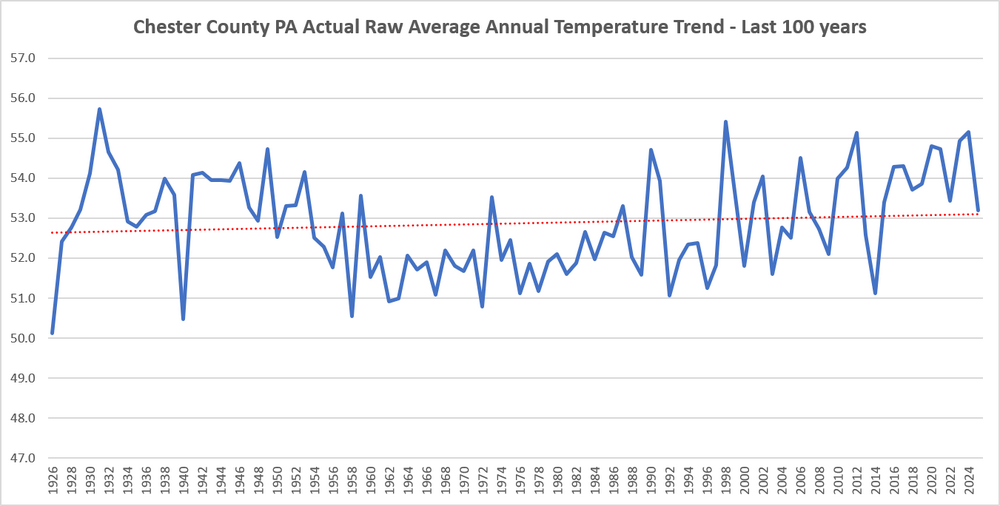
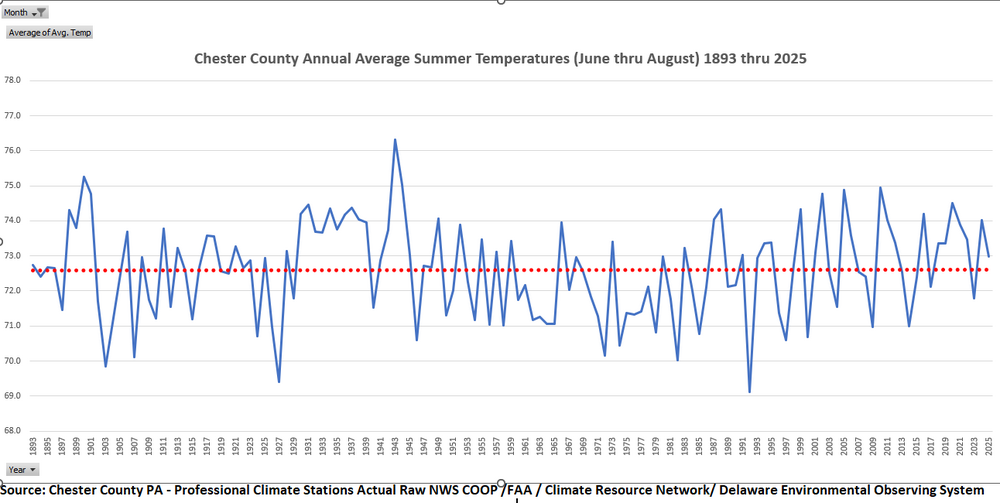
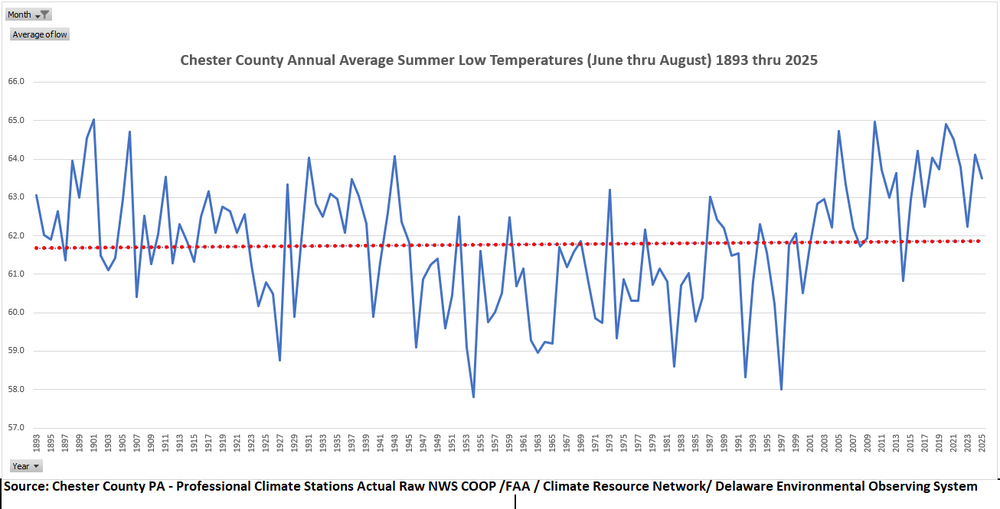
Sure after chilling adjustments made to the past for 90 consecutive years across Chester County......below is the realistic and actual temperature graph covering the last 100 years....no climate crisis here without those consistent post hoc alterations to the actual real data! Still trying to get as warm as the old days back in the 1930's and 1940's!
-
Central PA Summer 2026 Discussion/Obs Thread
ChescoWx replied to Voyager's topic in Upstate New York/Pennsylvania
Much more humid today before a strong cold front crosses later this evening. The best chances for thunderstorms and rain will be between 8pm and 11pm across the area. Tomorrow and Tuesday will feature much cooler weather with highs only in the low to mid 70's with night well down into the 50's with 40's possible in our usually colder valley locations. We briefly warm again toward Thursday before we turn cooler for next weekend.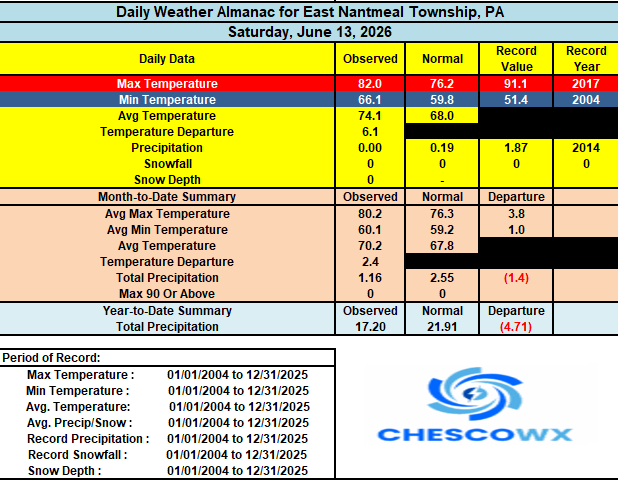
-
E PA/NJ/DE Summer 2026 Obs/Discussion
ChescoWx replied to PhiEaglesfan712's topic in Philadelphia Region
Much more humid today before a strong cold front crosses later this evening. The best chances for thunderstorms and rain will be between 8pm and 11pm across the area. Tomorrow and Tuesday will feature much cooler weather with highs only in the low to mid 70's with night well down into the 50's with 40's possible in our usually colder valley locations. We briefly warm again toward Thursday before we turn cooler for next weekend.
-
Central PA Summer 2026 Discussion/Obs Thread
ChescoWx replied to Voyager's topic in Upstate New York/Pennsylvania
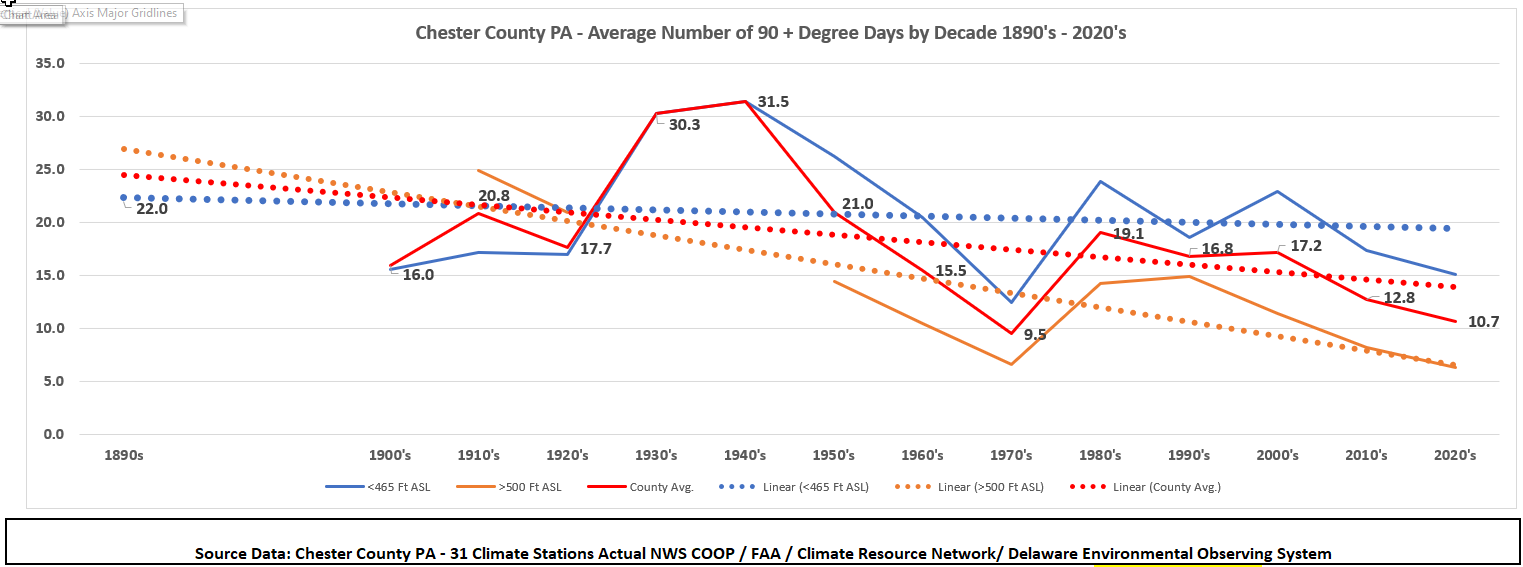
Here in Chester County PA most spots have seen an above normal amount of 90+ days so far this season. Below are the number so far this season by station along with the average per typical season along with the most and least by station. You can clearly see how relative elevation across our area impacts the number of such days. Also below you can see our average annual number of 90+ days is showing a clear reduction in number as we compare past decades to the 2020's.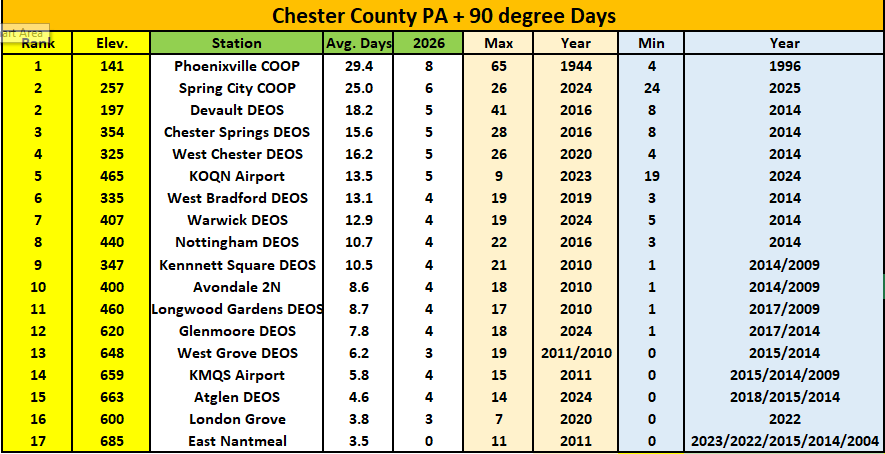

-
E PA/NJ/DE Summer 2026 Obs/Discussion
ChescoWx replied to PhiEaglesfan712's topic in Philadelphia Region
Here in Chester County PA most spots have seen an above normal amount of 90+ days so far this season. Below are the number so far this season by station along with the average per typical season along with the most and least by station. You can clearly see how relative elevation across our area impacts the number of such days. Also below you can see our average annual number of 90+ days is showing a clear reduction in number as we compare past decades to the 2020's.
-
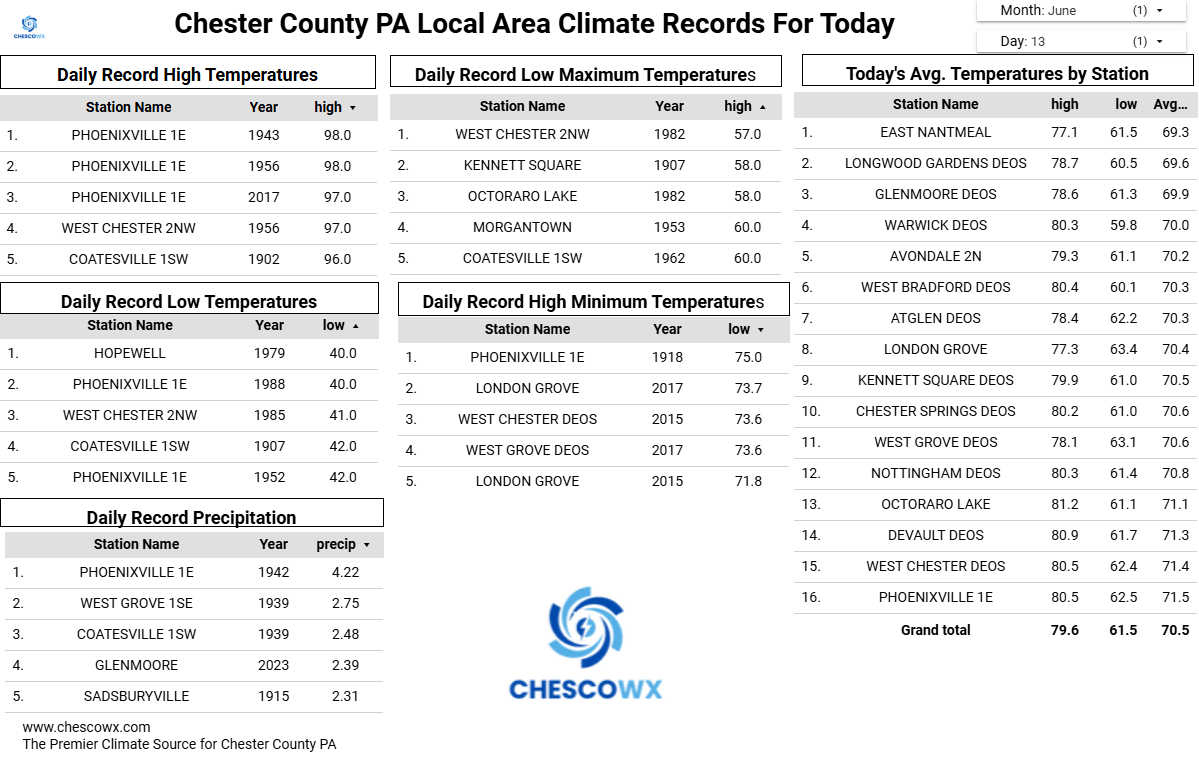
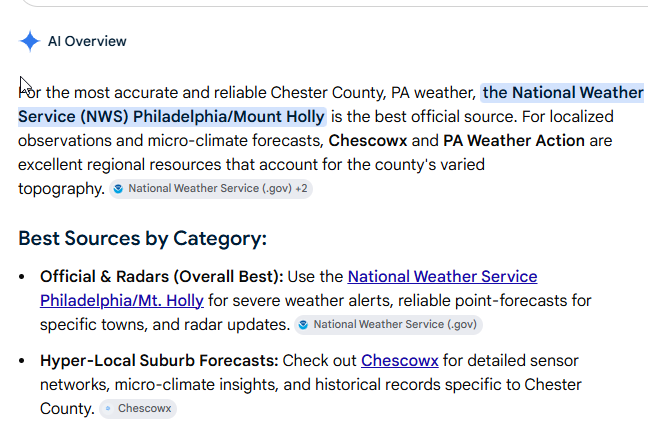
So I asked AI who is the best source of weather / climate data for Chester County PA? Can AI be wrong??
-
Central PA Summer 2026 Discussion/Obs Thread
ChescoWx replied to Voyager's topic in Upstate New York/Pennsylvania
Several degrees cooler today and much less humid. Highs will still be several degrees above normal levels. Much more humid again tomorrow before a strong cold front crosses the area tomorrow night. We should see temperatures falling back below normal both Monday and Tuesday before we warm up again toward the end of the week. Shower chances increase tomorrow afternoon into the evening with the cold front.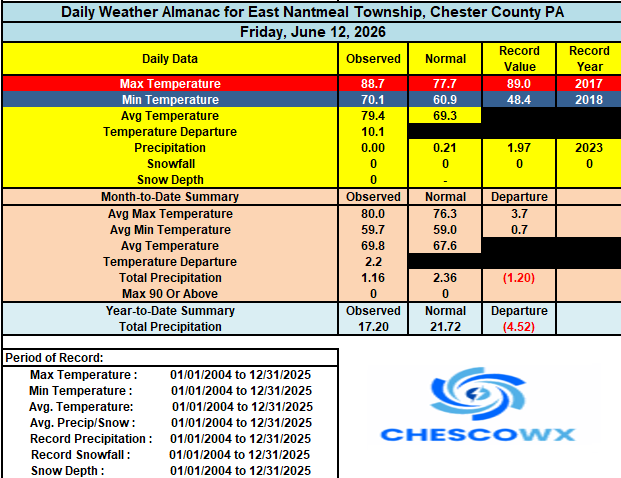

-
E PA/NJ/DE Summer 2026 Obs/Discussion
ChescoWx replied to PhiEaglesfan712's topic in Philadelphia Region
Several degrees cooler today and much less humid. Highs will still be several degrees above normal levels. Much more humid again tomorrow before a strong cold front crosses the area tomorrow night. We should see temperatures falling back below normal both Monday and Tuesday before we warm up again toward the end of the week. Shower chances increase tomorrow afternoon into the evening with the cold front.
-
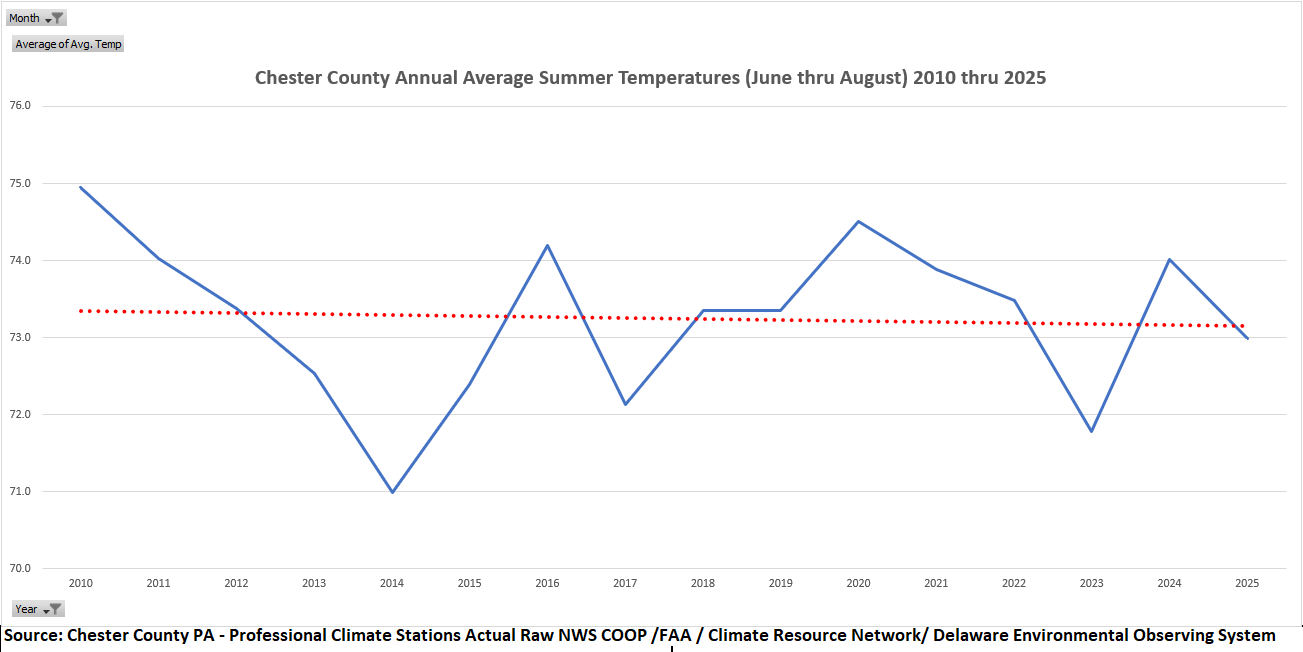
Are we already in our next cooling climate cycle for summer? Since 2010 summers now show a cooling trend!

-
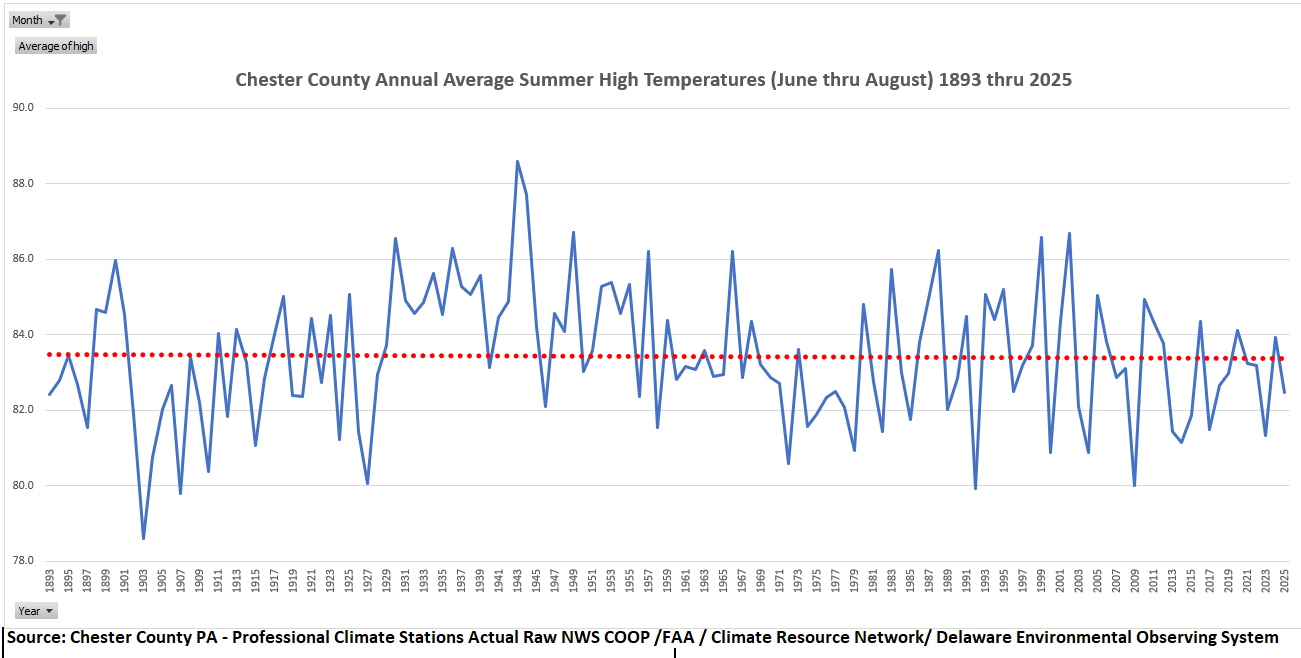
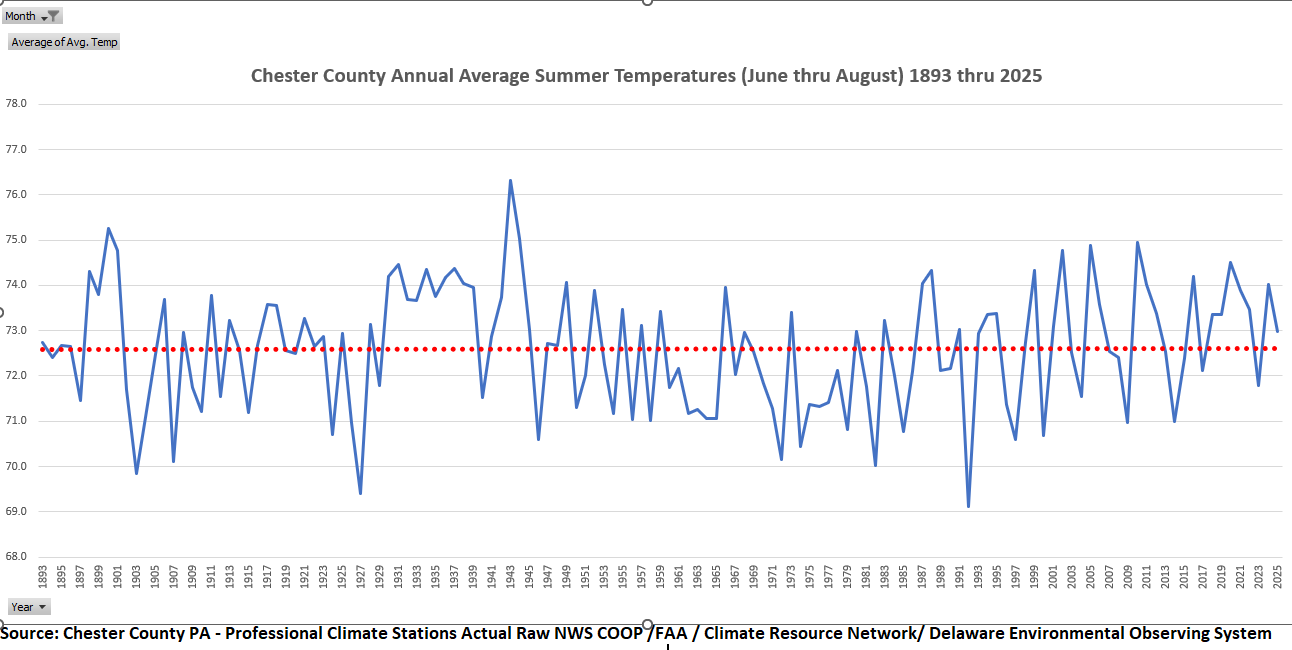
Many folks have asked for an analysis of both the Average Summer High temperature and Overall Average Temperature trends specifically for Chester County PA. Clearly steady state since 1893!

-
How climate catastrophism — not climate change — is harming our mental health https://www.thefreemind.co.uk/p/how-climate-catastrophism-not-climate
-
Central PA Summer 2026 Discussion/Obs Thread
ChescoWx replied to Voyager's topic in Upstate New York/Pennsylvania
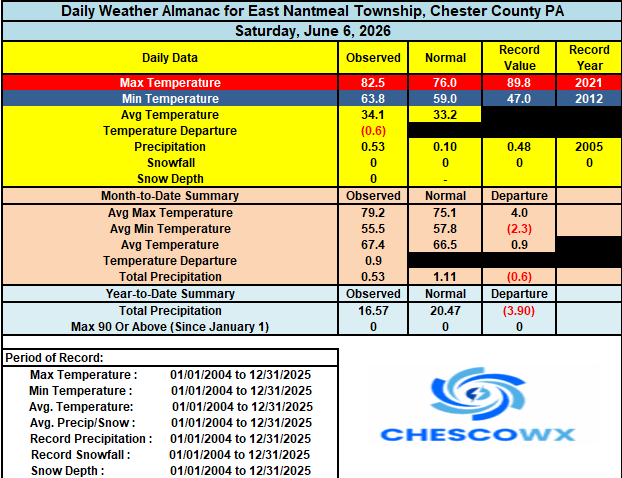
We are only running around 80% of normal rainfall for the year to date here in East Nantmeal. It looks like we should see at least some showers and thunderstorms today that could give us some welcome rain. A heat advisory goes into effect tomorrow with highs both Thursday and Friday in the low 90's with increasing humidity. Shower chances will be around both later in the day Thursday and Friday. The weekend looks cooler but still warm before we turn much cooler to start the new work week. Temperatures both Monday and Tuesday may only be in the 70's for high temperatures.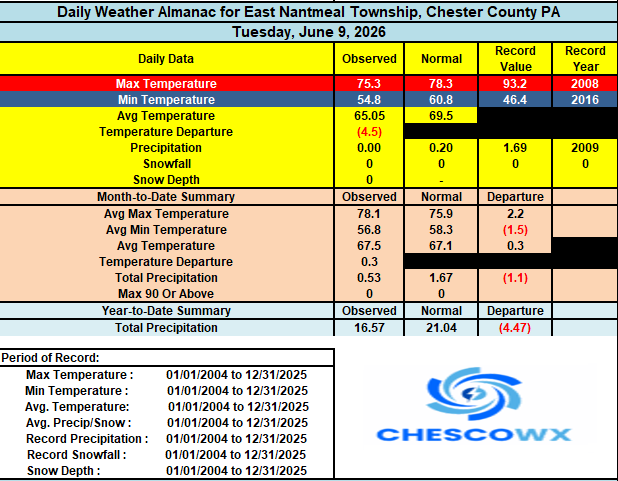
-
E PA/NJ/DE Spring 2026 Obs/Discussion
ChescoWx replied to PhiEaglesfan712's topic in Philadelphia Region
We are only running around 80% of normal rainfall for the year to date here in East Nantmeal. It looks like we should see at least some showers and thunderstorms today that could give us some welcome rain. A heat advisory goes into effect tomorrow with highs both Thursday and Friday in the low 90's with increasing humidity. Shower chances will be around both later in the day Thursday and Friday. The weekend looks cooler but still warm before we turn much cooler to start the new work week. Temperatures both Monday and Tuesday may only be in the 70's for high temperatures.
-
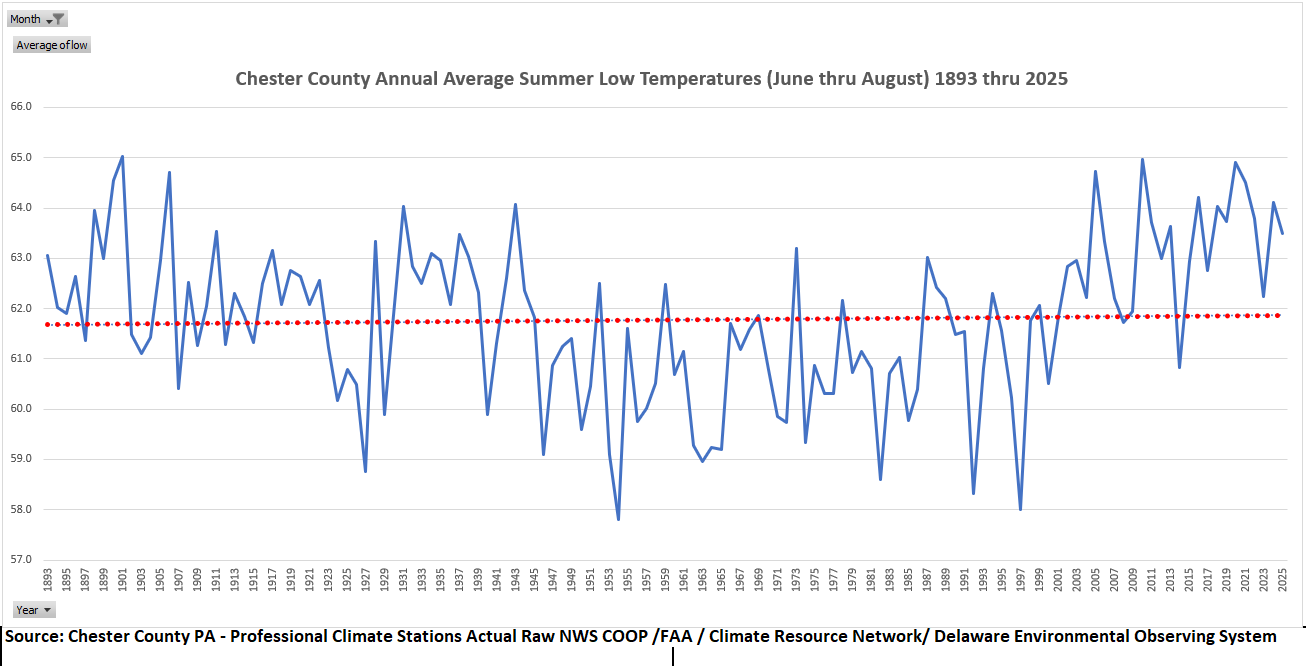
There are some who believe our nightime lows are getting warmer during the summer months. The actual data sees no such warming - almost flat since 1893!
-
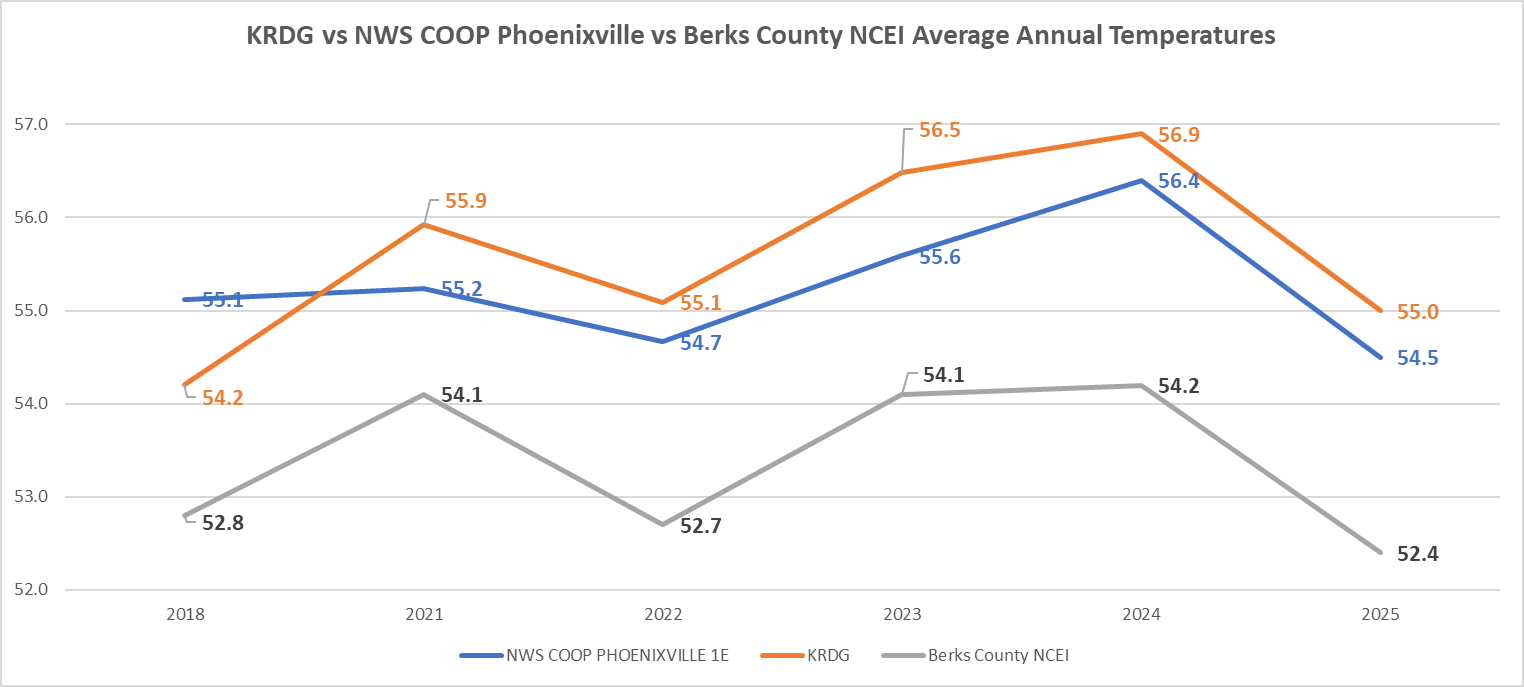
Wonder what is going on at KRDG since 2021?? Further north higher elevation than Phoenixville but now warmer than the Chesco warm spot.

-
I love when climate zealots simply eliminate stations they deem absurd....LOL!
-
Central PA Summer 2026 Discussion/Obs Thread
ChescoWx replied to Voyager's topic in Upstate New York/Pennsylvania
Temperatures today will be close to average for the date with highs well into the 70's to near 80 degrees. We start a warming trend tomorrow with the peak hot day being on Friday which is the only day that higher elevations have a shot a 90 degrees. Most valley spots should reach the 90's Thursday and Friday including higher humidity. While we will cool by a few degrees over the weekend it will remain hot until Monday when temperatures will fall back toward the middle 80's. We have shower chances tomorrow morning and again both Thursday and Friday afternoon.
-
E PA/NJ/DE Spring 2026 Obs/Discussion
ChescoWx replied to PhiEaglesfan712's topic in Philadelphia Region
Temperatures today will be close to average for the date with highs well into the 70's to near 80 degrees. We start a warming trend tomorrow with the peak hot day being on Friday which is the only day that higher elevations have a shot a 90 degrees. Most valley spots should reach the 90's Thursday and Friday including higher humidity. While we will cool by a few degrees over the weekend it will remain hot until Monday when temperatures will fall back toward the middle 80's. We have shower chances tomorrow morning and again both Thursday and Friday afternoon.
-
Central PA Summer 2026 Discussion/Obs Thread
ChescoWx replied to Voyager's topic in Upstate New York/Pennsylvania
Many of our valley locations saw lows well down into the 50's with the coolest being the 53.6 at Warwick Township. We start the week with near normal temperatures and low humidity but by Thursday many spots will be in the low 90's with increasing humidity. We look to stay hot through the weekend, but it looks to be short lived with cooler temperatures arriving next week. Our best rain chance will be Wednesday afternoon into the evening.
-
E PA/NJ/DE Spring 2026 Obs/Discussion
ChescoWx replied to PhiEaglesfan712's topic in Philadelphia Region
Many of our valley locations saw lows well down into the 50's with the coolest being the 53.6 at Warwick Township. We start the week with near normal temperatures and low humidity but by Thursday many spots will be in the low 90's with increasing humidity. We look to stay hot through the weekend, but it looks to be short lived with cooler temperatures arriving next week. Our best rain chance will be Wednesday afternoon into the evening.
-
Central PA Summer 2026 Discussion/Obs Thread
ChescoWx replied to Voyager's topic in Upstate New York/Pennsylvania
Temperatures similar to yesterday with highs in the low to mid 80's. We turn a couple of degrees cooler tomorrow. We then start a warming trend with some spots touching 90 degrees on both Thursday and Friday. There will be some chances at a shower by Thursday night.