

SACRUS
-
Posts
13,046 -
Joined
-
Last visited
Content Type
Profiles
Blogs
Forums
American Weather
Media Demo
Store
Gallery
Posts posted by SACRUS
-
-
1 minute ago, SACRUS said:
87 / 61
WNW wind

-
-
-
83 / 60 another gorgeous sunny day, especially for weekend.
-
 1
1
-
-
1 minute ago, LibertyBell said:
The high of 101 on July 4th at JFK, was 4 degrees higher than Central Park if I remember correctly and also higher than LGA. I think EWR was the only other official ASOS in the area to reach 100 on that day.
2010:
Jul 4 High temperature
JFK: 101
EWR: 101
LGA: 98
ISP: 97
NYC: 96
-
1
-
-
2 minutes ago, LibertyBell said:
also for 100+ days I think the record is 4 from 1953 and 1966 at NYC?
and for 100+ days the record is 3 from 1966 and 2010 at JFK?
JFK
Year Rank Days >= 100 °F 2010 1 3 1966 1 3 2011 3 2 1993 3 2 1983 3 2 1948 3 2 2013 7 1 1999 7 1 1972 7 1 1963 7 1 1957 7 1 NYC
Year Rank Days >= 100 °F 1966 1 4 1953 1 4 1993 3 3 1977 3 3 1955 3 3 1948 3 3 1944 3 3 2011 8 2 2010 8 2 1999 8 2 1991 8 2 1980 8 2 1957 8 2 1954 8 2 1949 8 2 1937 8 2 1936 8 2 1933 8 2 1926 8 2 1901 8 2 2012 21 1 2001 21 1 1995 21 1 1952 21 1 1934 21 1 1930 21 1 1918 21 1 1917 21 1 1911 21 1 1898 21 1 1881 21 1 -
 1
1
-
-
2 minutes ago, LibertyBell said:
Thanks Don..... in 2010 JFK also had 3 days of 100+
July 4th, July 6th and July 7th, if I remember correctly? (so three days out of four?)
The 3 days of 100+ in 1966 at JFK were all consecutive?
JFK
2010:
Jul 4: 101
Jul 6: 101
Jul 7: 100-
1
-
-
4 minutes ago, LibertyBell said:
Tony do you have a list for JFK and NYC in terms of 99 and higher? I know 1949 takes the number one spot for 99+ temperatures at NYC with 5, not sure what is number 1 for JFK, but I know they have the same number of 99 degree temperatures (19) that they have of 100+ temperatures (also 19), which I find absolutely amazing.
JFK 99 degree days season leaders by year
2010 1 3 1983 1 3 1966 1 3 2019 4 2 2011 4 2 2002 4 2 1999 4 2 1993 4 2 1949 4 2 1948 4 2 2013 11 1 2012 11 1 2006 11 1 2001 11 1 1991 11 1 1986 11 1 1978 11 1 1972 11 1 1969 11 1 1964 11 1 1963 11 1 1959 11 1 1957 11 1 1955 11 1 1952 11 1 -
1
-
-
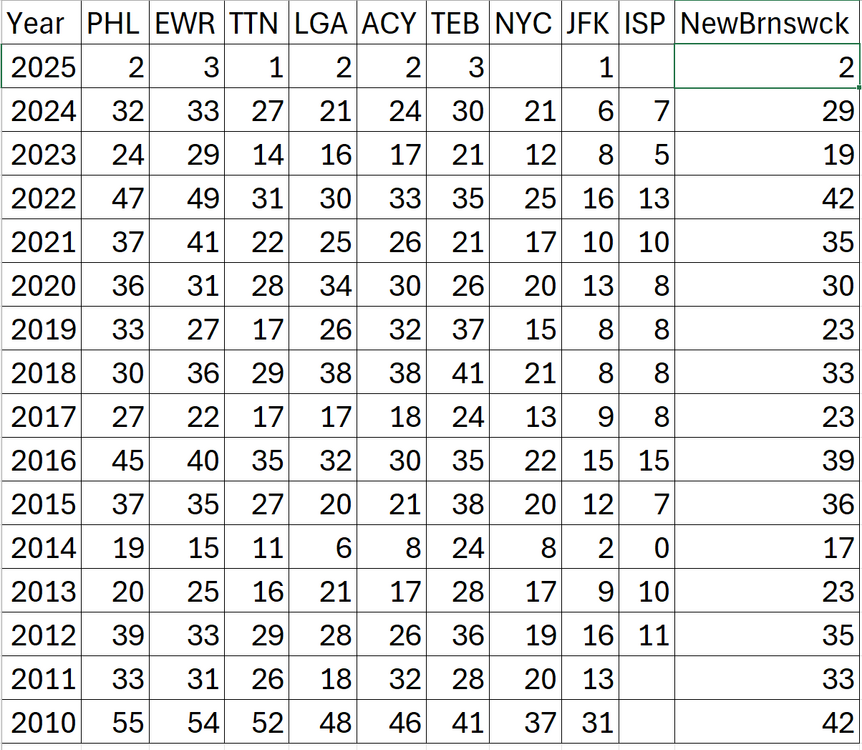
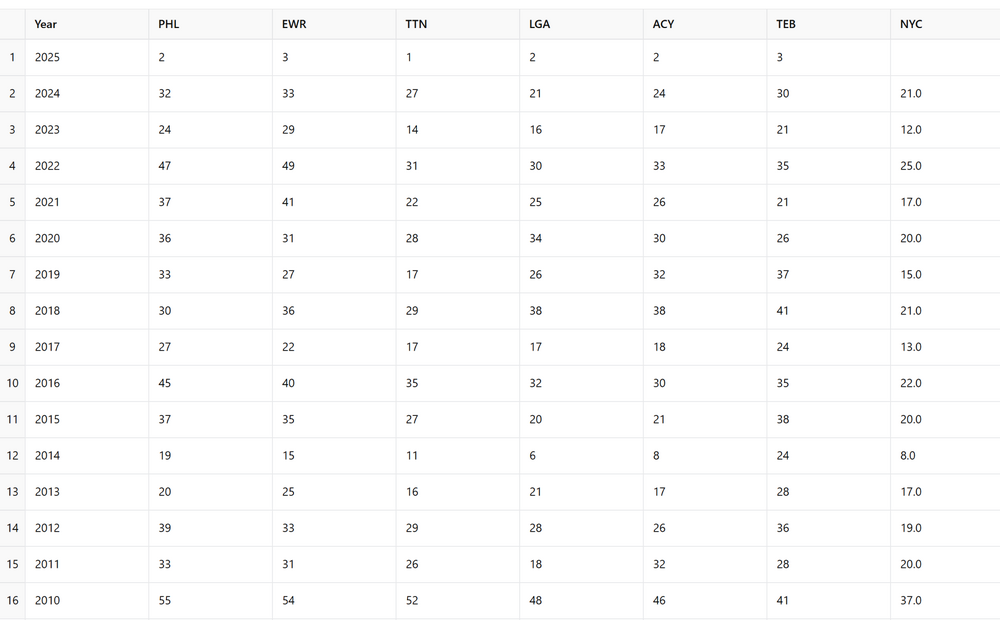
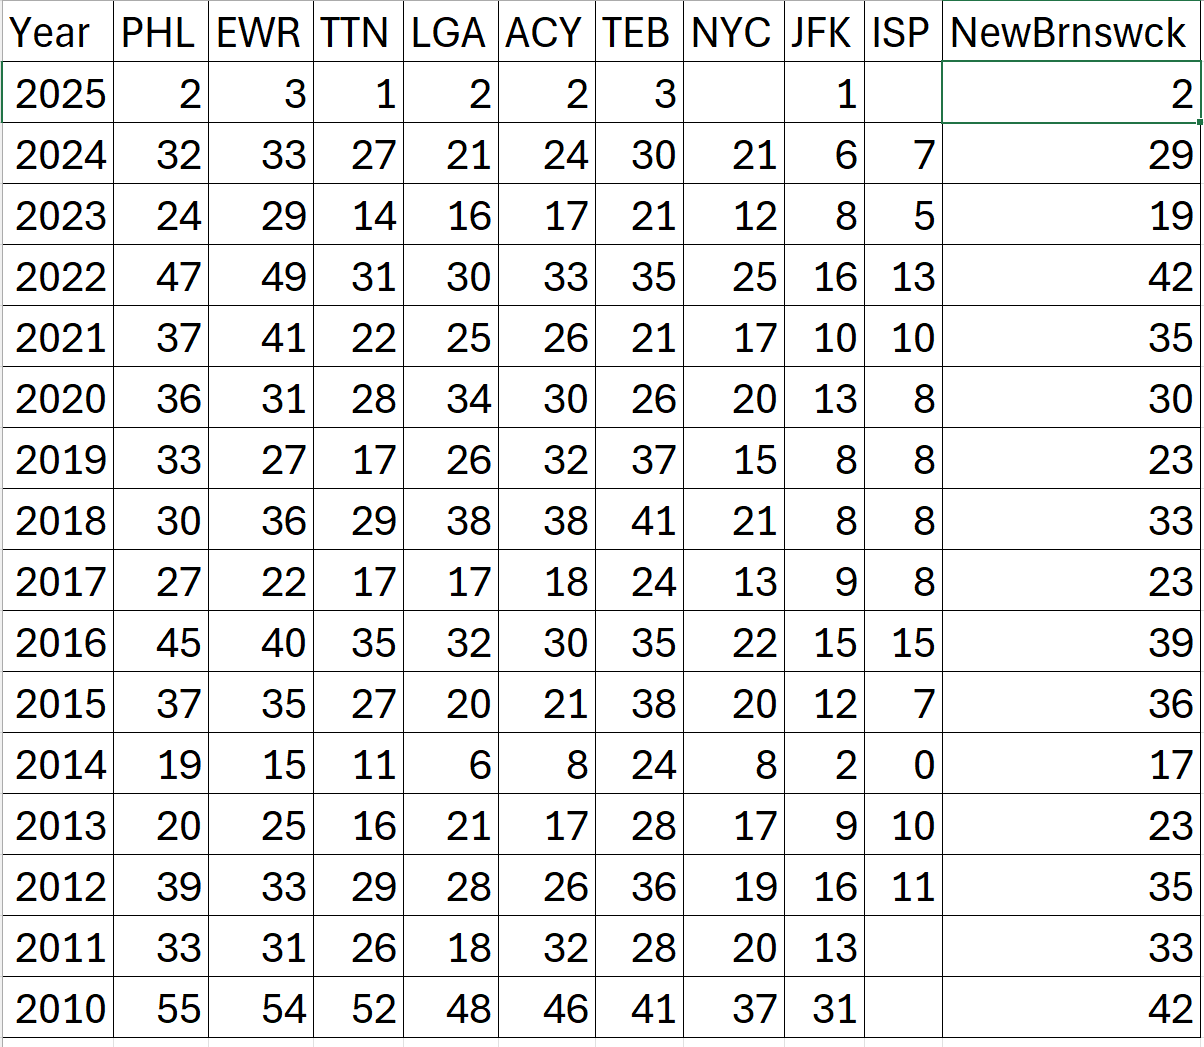
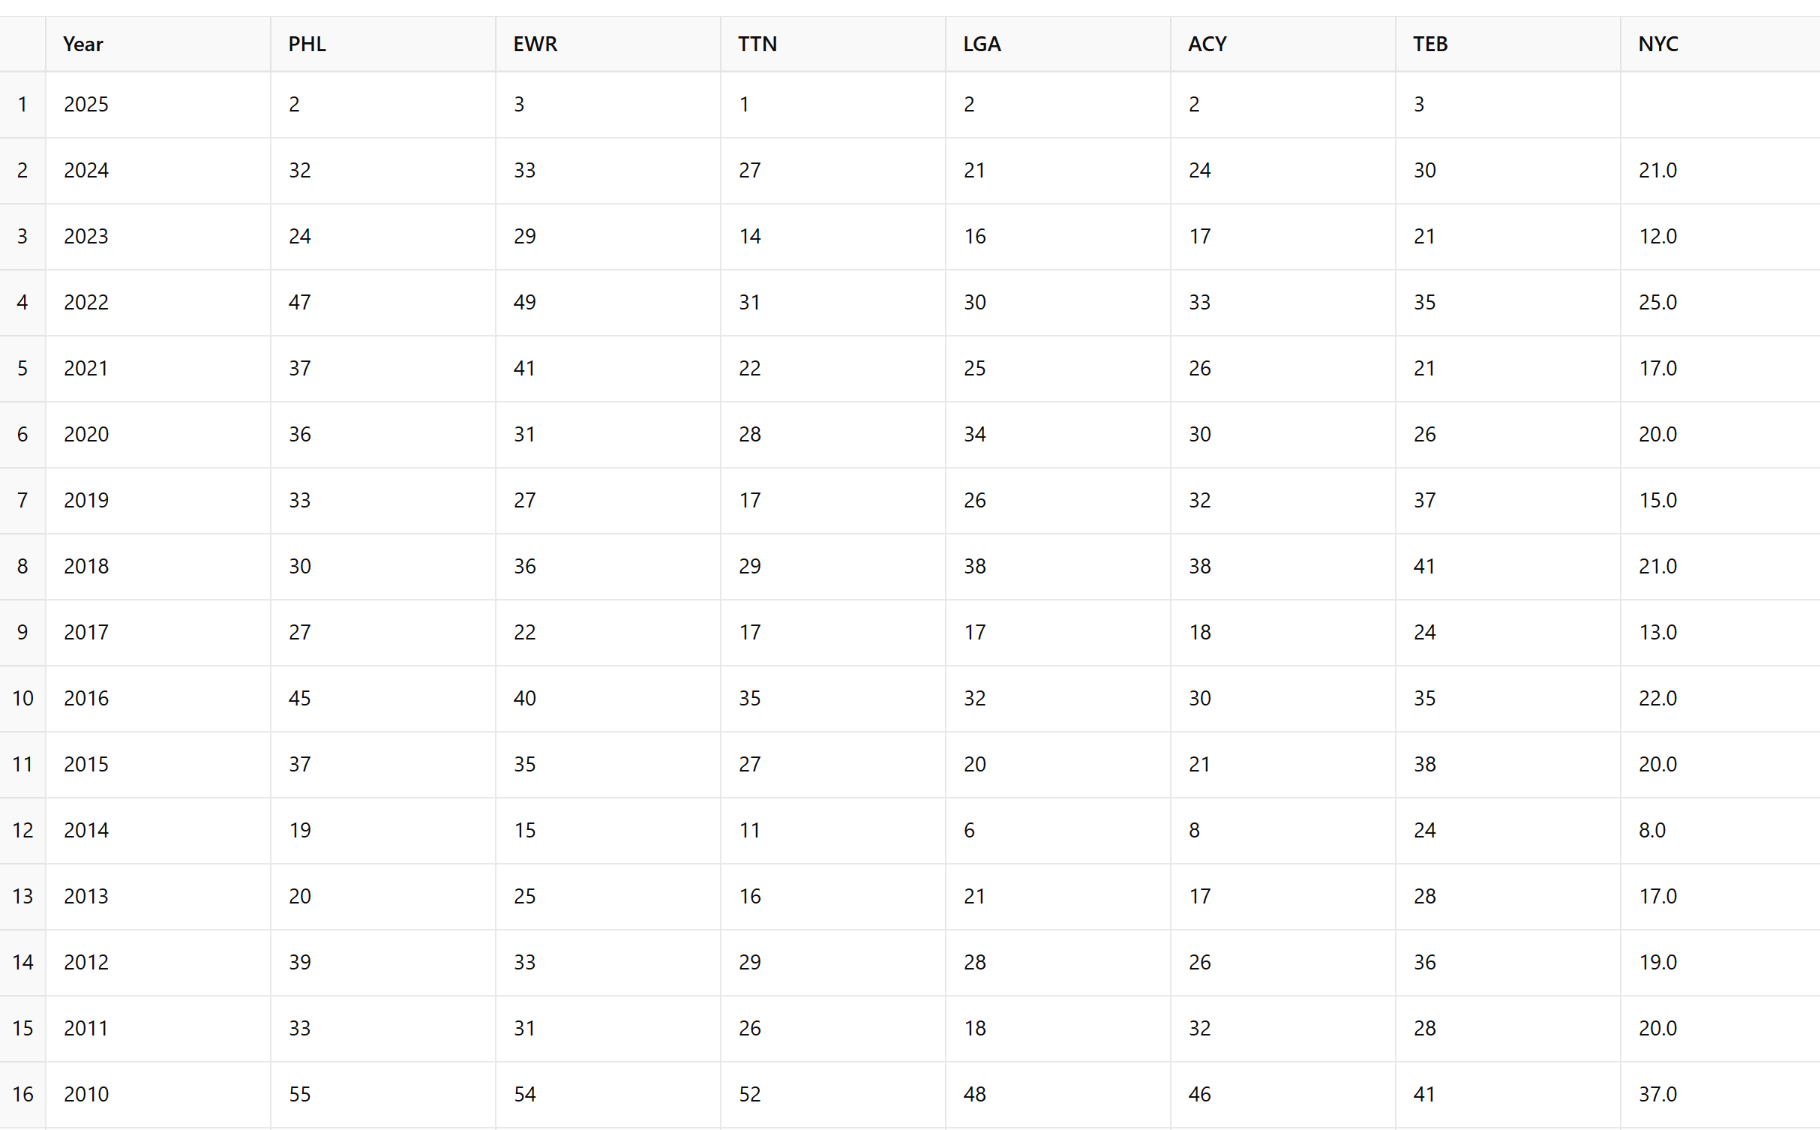
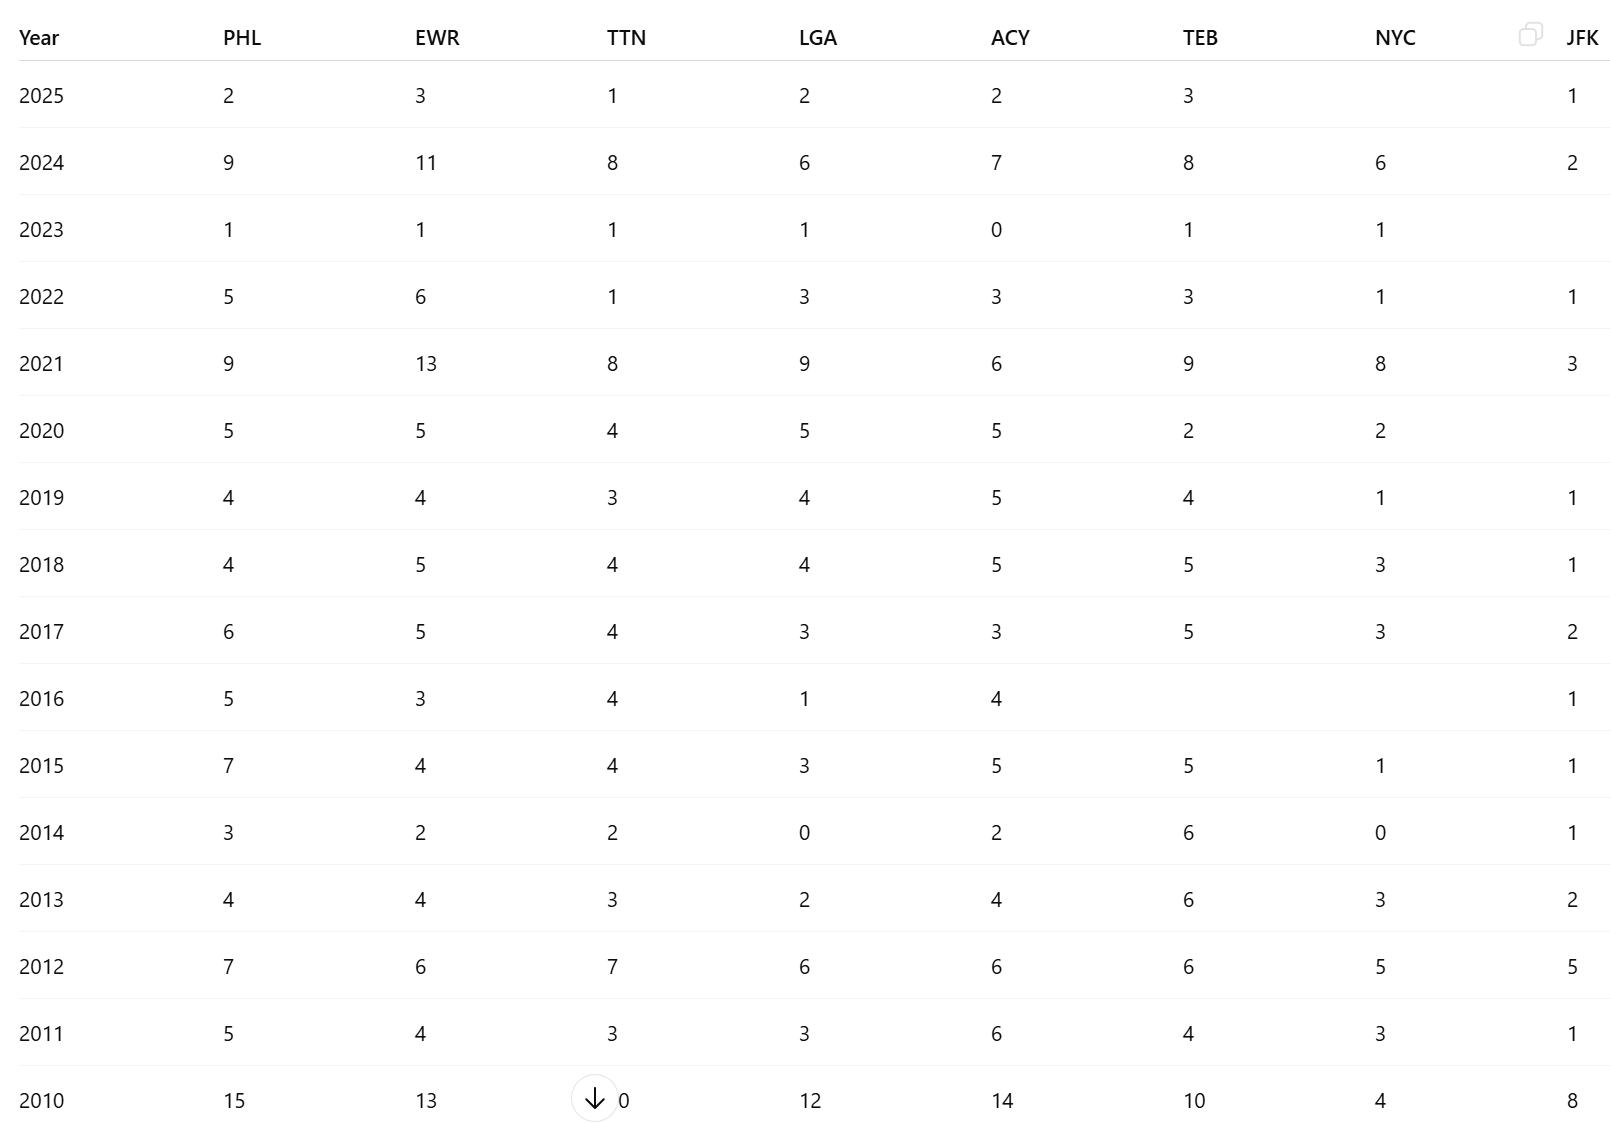
Updated 90 degree days by season 2010 - prsnt
-
2
-
-
The issue with central park is it being a mecca for the NYC region as a whole and the perception isnt truly representative of the urban/city metro areas. Head lines first 100 possible since 2012, first 90 degree day , hottest in years when many other sites have been hotter recently and have 90 degree days already this year. TTN seems to be running lower than prior years but i havent looked to deep into it.
-
2
-
-
9 minutes ago, LibertyBell said:
FWIW it isn't just the coastal areas that are seeing less extreme temperatures, Newark itself hasn't come close to matching the number of 100 degree days that happened in 1949 and 1993 either. The data shows it.
Newark top 100 degree season leaders 2022 was only 3 off with 2 days 99
Year Rank Days >= 100 °F 1993 1 9 1949 2 8 2022 3 6 1953 3 6 1988 5 5 If you expand it to 99 and higher
Year Rank Days >= 99 °F 1993 1 12 1988 2 9 1949 2 9 2022 4 8 1999 4 8 1953 4 8 2011 7 7 2010 8 6 -
2
-
-
On 6/12/2016 at 9:26 AM, SACRUS said:
With just about 3 weeks to go the holiday will slowly start showing up on some long range forecasts
Past July 4th's

Year. 23..21..20..19..18..17...16..15...14...13...12....11....10...09...08....07....06...05....04...03...02...01...00...99...98...97...96...95..94...93
EWR: 91..84..87...89...89...88...84...79...76...91...97...92...101...83...81....73...89...80...87...94...100...81....88...99...86...88...72...84..86..97
LGA:. 87..79..88...93...84...87...86...75...74...91....95...88....98....81...80....73...92...82...83...93...98....81....84...95...86...87...73...84..83..92
TTN: 85..79..89...91...91...86...82...75...75...84....88...95....99....81...80....74...89...84...89...92...97....82....87...99...85...84...73...81..83..92
JFK: 85..75..85....97...86...85...82...80...76....84...89...86....101...83...82....72...86..78...79...92...99....75....81...97...82...89...74...80..83..96
NYC: 85..77.. 87...90...86...85...84...75...74...87....92...86....96....79...78....71...87...83...82...92...96....79....84...96...84...85...71...84..86..95Long range
GFS and ECMWF have warm / humid both currently have early storms.
-
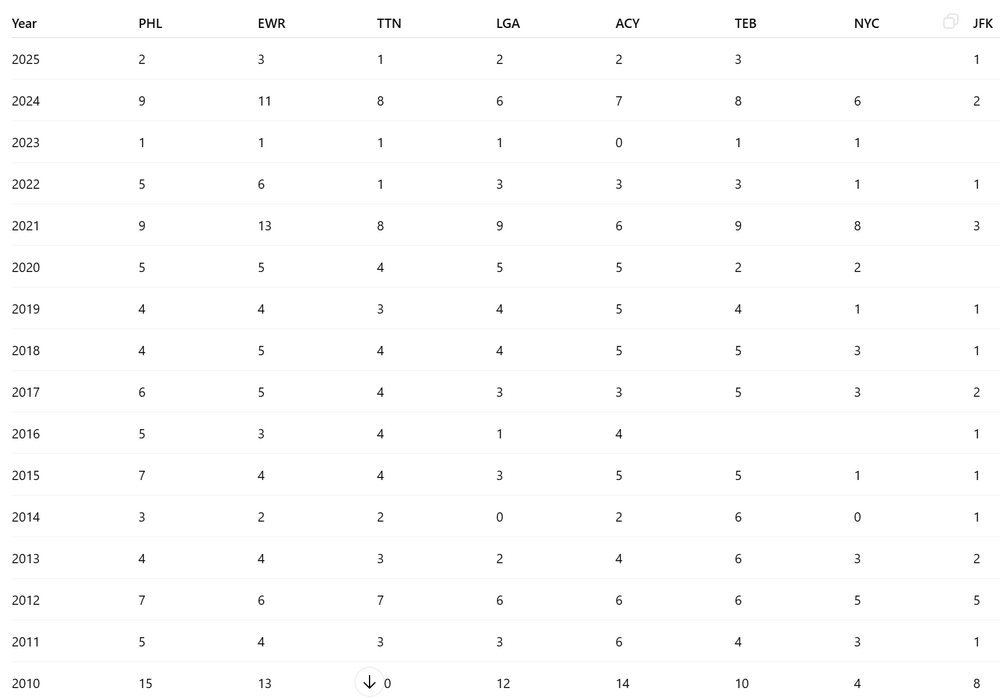
90 degree days for June back to 2010, with the upcoming stretch should put this year solidly in the top 3/5
-
2
-
-
Through the first 2/3 of Jun. Should average +5 over the last 10 days of the month to get the area solidly above normal for Junde despite that days of clouds and near or sub 70.
Departures thru 6/20 (pcp0
JFK: + 0.7 (2.23)
EWR: +0.3 (2.13)
NYC: -1.0 (2.24)
LGA: -1.5 (2.32)-
1
-
-
Records:
Highs:
EWR: 100 (2024)
NYC: 97 (1988)
LGA: 98 (2012)
JFK: 97 (2012)
Lows:
EWR: 46 (1940)
NYC: 49 (1897)
LGA: 53 (1940)
JFK: 56 (1968)
Historical:1886: TA destructive hurricane hit the Apalachicola – Tallahassee area of Florida on the summer solstice. Extensive damage was done in Florida and throughout the southeast by this storm. Damage was due mainly to extremely high tides. (Ref. Wilson Wx. History)
1893 - On the first day of summer the temperature at Dodge City, KS, soared to 106 degrees during the midst of a blistering heat wave. The heat wave initiated a severe three year drought in the Central Plains Region. Ironically, at about the same time, heavy rains in the Mississippi Valley were causing the river to swell to its highest level of record at New Orleans, LA. (David Ludlum) (The Weather Channel)
1919 - Seven heavy coach cars of a moving train were picked up and thrown from the tracks by tornado winds. A baggage car was set down thirty feet away from the rest of the train. (The Weather Channel)
1923: The island of Nantucket off Cape Cod had its earliest 90 degree reading and the only one ever in June. (Ref. Wilson Wx. History)
1954 - A severe hailstorm struck Wichita KS and vicinity causing nine million dollars damage. (The Weather Channel)
1968: A line of severe thunderstorms raced across the state of South Dakota at 60 mph with winds that exceeded 100 mph in some areas with winds over 60 mph quite common. Many areas also received extensive hail damage with dime to golf ball size hail common and even a few areas were pounded with baseball size hail. At least, nine tornadoes and 11 separate funnel clouds were reported, although more likely occurred...they were probably obscured by darkness in the east and by blowing dust in the west. To that point in the state's history, the night's storms were likely the most damaging on record as they resulted in $10 to $15 million dollars in damage. (Ref. Wilson Wx. History)
1972 - Phoenix, AZ, was drenched with 1.64 inches of rain late on the 21st and early on the 22nd to easily surpass their previous June rainfall record of 0.95 inches. The total for the month was 1.70 inches. (The Weather Channel)
1972: When Hurricane Agnes dropped 16 inches of rain over central Virginia in 1972, the James River flooded Richmond. Flood waters in the river reached 6.5 feet higher than the historical 200-year-old record. Richmond, VA experienced its worst flood of record as rains from Hurricane Agnes pushed the water level at the city locks to a height of 36.5 feet, easily topping the previous record of thirty feet set in 1771. Thirteen years later, a multi-million dollar floodwall was erected to prevent the rising waters of the river from overflowing again. Agnes gave DC. 7.19 inches rain in 24 hrs. an all-time rec. 11 inches n. suburbs, 15.00 in Herndon, 16 in Chantilly, VA.
1987 - A tornado destroyed 57 mobile homes at the Chateam Estates trailer park northwest of Detroit, MI, killing one person and injuring six others. Total damage was estimated at 1.7 million dollars. Thunderstorms over Lower Michigan also drenched the Saginaw Valley with up to 4.5 inches of rain in less than six hours. (The National Weather Summary) (Storm Data)
1988 - The first full day of summer was a torrid one, with afternoon highs of 100 degrees or above reported from the Northern and Central Plains to the Ohio Valley. Sixty-nine cities in the north central U.S. reported record high temperatures for the date. The high of 110 degrees at Sioux Falls, SD, was an all-time record for that location. Highs of 103 degrees at Des Moines, IA, 102 degrees at Fort Wayne, IN, 109 degrees at Huron, SD, 108 degrees at Sioux City, IA, and 101 degrees at South Bend IN were records for June. (The National Weather Summary)
1989 - The first day of summer heralded snow in the northern and central Rockies. In Colorado, 15 inches of snow was reported at the summit of Mount Evans and, in Wyoming, 18 inches was reported at Dickensen Park, west of Lander. Heavy rain continued in the eastern U.S. Huntsville, AL, reported a record 11.65 inches for the month, compared to the 0.17 inch rainfall total in June 1988. (The National Weather Summary) (Storm Data)
2005 - A slow-moving thunderstorm dumped up to a foot of hail in southeastern portions of Colorado Springs, Colorado. Snowplows had to be used to clear a route through a major thoroughfare in the city. Heavy rainfall from the storm left up to 4 feet of water in city streets, trapping dozens of motorists (Associated Press).
-
1
-
-
77 / 62 the heat is on. Ridge building in to 594 DM with 850 MB temps spiking to >21C Mon - Wed. Partly cloudy 90 for the hotter spots today, otherwise upper 80s. Mid - upper 90s tomorrow, outside chance of century mark in the hottest spots. Only clouds / seasbreaze woudl hinder 100s in the hot spots inland Monday, with Tuesday the hottest day with widespread 100s . Wed a chance at the tri century if clouds / storms dont get in the way. T
hu/ FRi deal with more storms as ridge wanes and we ride the periphery with storms and some stonger onshore.
The weekend sees ridge re build with more heat in the 6/28 - 7/2 peeiod.
Beyond there overall warm - hot / humid and wetter with storm chances.
J
uly 4th forecast to begin as in long range 336 hours forecast range.
6/21 - 6/25 : Hot - mainly dry heatwave
6/26 - 6/27 : Storms reduce or break heat
6/28 - 7/2 : heat builds back more 90s, storm chances
7/3 - Beyond : Warm - Hot, Humid overall - wettter storms
-
1
-
-
79 / 59 a gorgeous summer evening.
-
8 minutes ago, LibertyBell said:
Tony, what's the earliest JFK has hit 100? I know they've hit 100 multiple times in my life on or just after July 4th.
July 4, 2010 101 degrees (hotter than either NYC or LGA)
July 5, 1999 102 degrees
102 July 1, 1963 all others were 99 in June
-
1
-
-
Highs:
EWR: 87
ISP: 86
JFK: 86
PHL: 86
ACY: 86
LGA: 85
TEB: 85
New Brnswck: 84
BLM: 84
TTN: 83
NYC: 82-
1
-
 1
1
-
-
All look to dry up beyoond CPA
-
1
-
-
Ended on a partly cloudy note Gorgeous day
Clouds and some showers storms back in PA look to fizzle out, but some clouds overnight and into the morning perhaps
-
81 / 56 partly cloudy as some clouds move in from the north
-
40 minutes ago, LibertyBell said:
wow what the heck was going on in 1949 lol, was that the 1940s version of 2010?
I wonder if JFK had many 100 degree days that summer, I know they had three in a row in 1948.
Come to think of it, 1948 and 1949 sound a lot like 2010 and 2011....
JFK highest was 99 in 1949:
Day High (°F) Low (°F) Precip. (inches) Snow (inches) 73 53 0.00 0.0 71 53 0.00 0.0 70 52 0.00 0.0 75 56 0.00 0.0 76 65 0.00 0.0 79 64 0.00 0.0 84 61 0.00 0.0 73 53 0.00 0.0 72 53 0.00 0.0 69 55 0.00 0.0 79 62 0.00 0.0 80 66 0.00 0.0 76 65 0.00 0.0 76 65 0.00 0.0 79 65 0.00 0.0 82 67 0.00 0.0 82 69 0.00 0.0 82 70 0.00 0.0 81 71 0.00 0.0 82 69 0.00 0.0 87 73 0.00 0.0 91 71 0.00 0.0 88 68 0.00 0.0 86 65 0.00 0.0 85 71 0.00 0.0 99 75 0.00 0.0 93 66 0.00 0.0 77 62 0.00 0.0 75 60 0.00 0.0 76 62 0.00 0.0 July 1949 JFK Airport Weather
Day High (°F) Low (°F) Precip. (inches) Snow (inches) 81 62 0.00 0.0 84 67 0.00 0.0 92 72 0.00 0.0 96 76 0.00 0.0 96 76 0.00 0.0 83 69 0.40 0.0 80 64 0.03 0.0 78 65 0.00 0.0 78 65 0.00 0.0 77 69 0.05 0.0 84 67 0.00 0.0 78 71 0.21 0.0 83 70 0.67 0.0 88 70 0.00 0.0 83 72 0.00 0.0 81 72 0.00 0.0 76 70 0.83 0.0 90 74 0.00 0.0 89 75 0.00 0.0 87 75 0.00 0.0 91 78 0.00 0.0 94 76 0.00 0.0 91 73 0.00 0.0 84 64 0.00 0.0 90 71 0.16 0.0 84 71 0.00 0.0 84 71 0.22 0.0 98 70 0.00 0.0 94 76 0.00 0.0 93 77 0.00 0.0 86 74 0.00 0.0 August 1949 JFK Airport Weather
Day High (°F) Low (°F) Precip. (inches) Snow (inches) 85 67 0.00 0.0 83 67 0.00 0.0 83 72 0.08 0.0 78 73 0.52 0.0 84 72 0.00 0.0 90 70 0.00 0.0 89 71 0.00 0.0 89 72 0.00 0.0 95 75 0.00 0.0 94 76 0.00 0.0 99 76 0.02 0.0 88 70 0.88 0.0 80 68 1.53 0.0 79 68 0.00 0.0 78 64 0.00 0.0 80 68 0.02 0.0 78 65 0.00 0.0 74 64 0.00 0.0 80 62 0.00 0.0 77 55 0.00 0.0 83 56 0.00 0.0 80 63 0.00 0.0 82 61 0.00 0.0 83 69 0.36 0.0 78 61 0.00 0.0 82 63 0.00 0.0 85 70 0.00 0.0 81 72 0.00 0.0 84 69 0.39 0.0 80 65 0.00 0.0 78 68 1.47 0.0 September 1949 JFK Airport Weather
Day High (°F) Low (°F) Precip. (inches) Snow (inches) 82 63 0.08 0.0 74 53 0.00 0.0 76 56 0.00 0.0 76 59 0.00 0.0 78 67 0.42 0.0 78 59 0.19 0.0 70 54 0.00 0.0 -
1
-
-
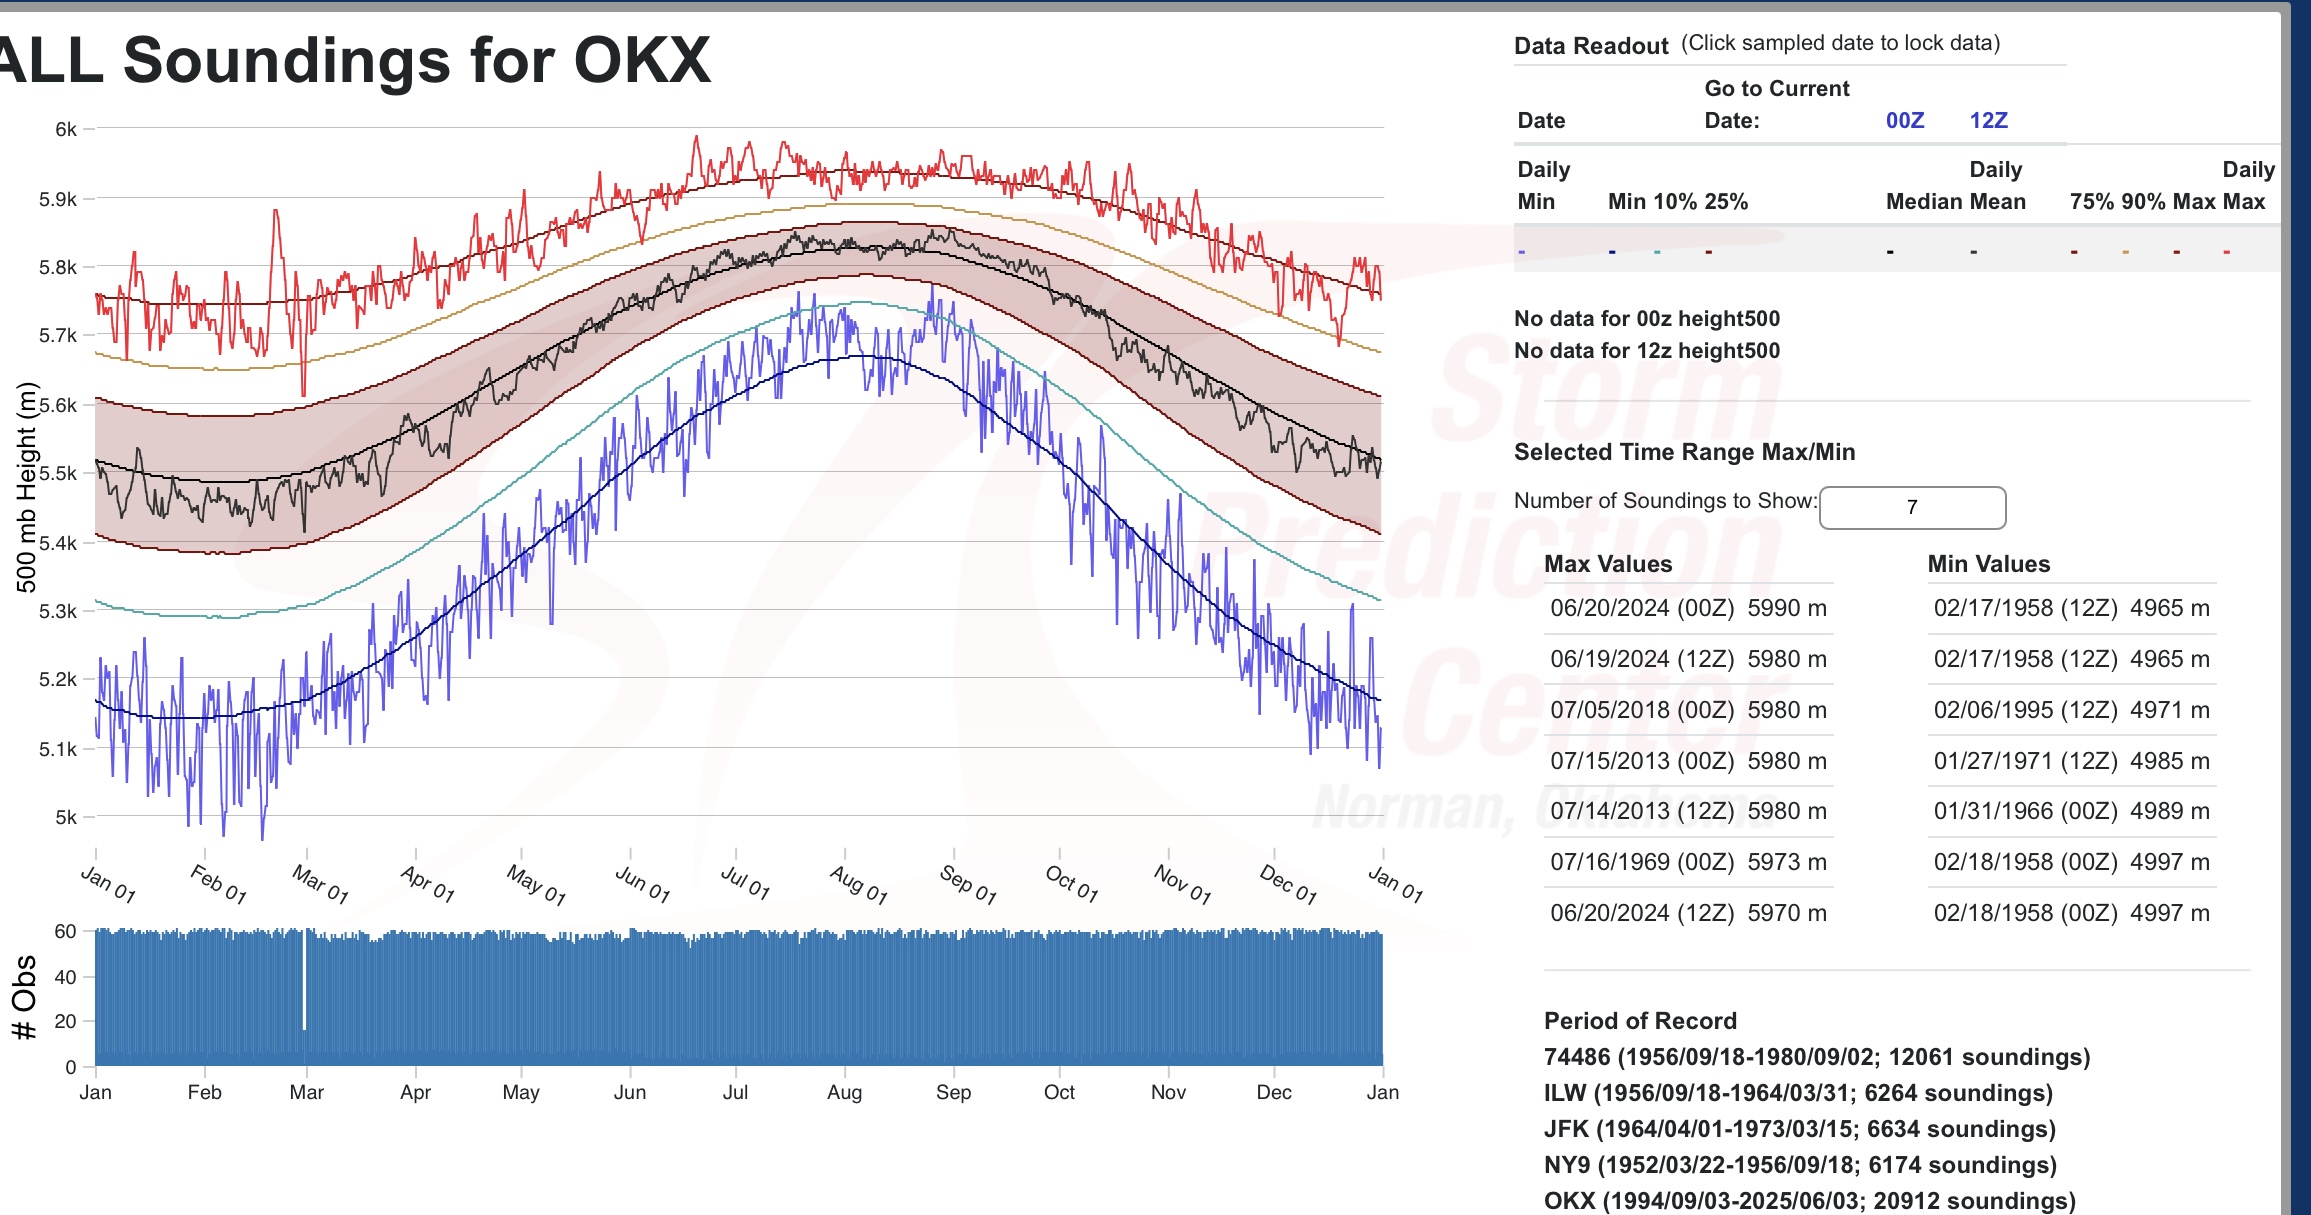
10 minutes ago, bluewave said:
Last June set the highest 500mb height record for our area since 1952. It came in ahead of 2018 and 2013. 500 mb heights have been steadily increasing over the years.
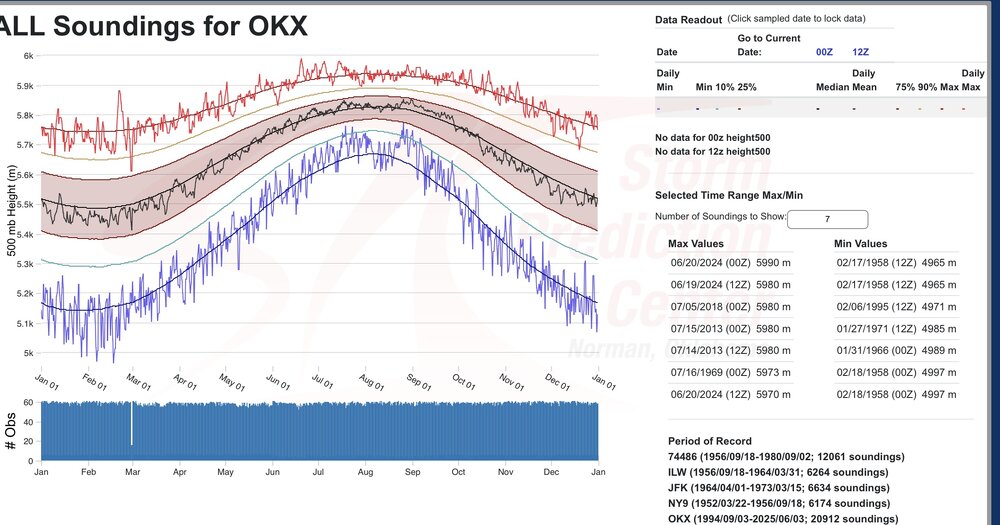
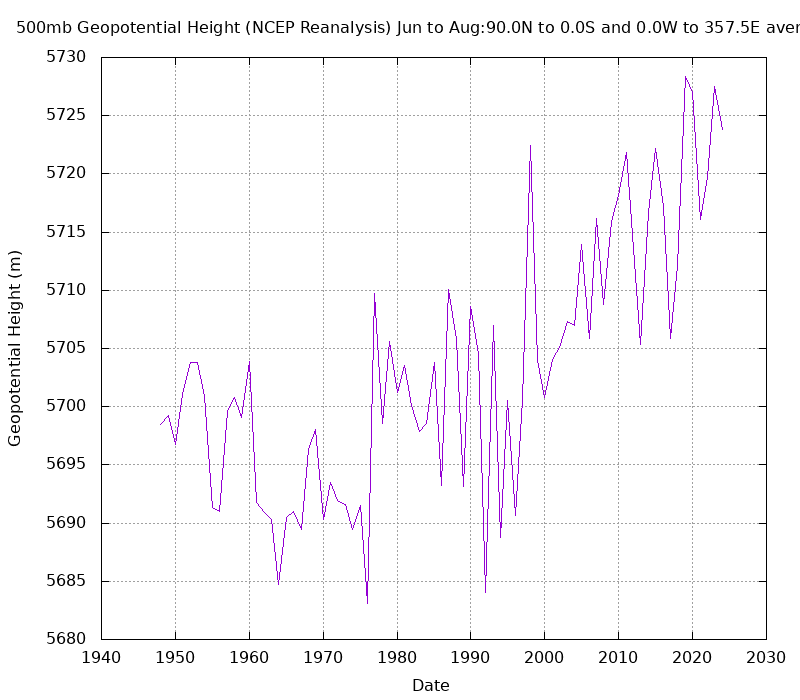
How did they calculate regional , continental 500MB heights then ? how large was the network of radiosondes and balloons then vs now? I havwe to go ovack to the 2001 heat dome in August and the 2011, 2013 how did they stack both were >594 DM from my recollection .
-
1
-

June 2025 discussion-obs: Summerlike
in New York City Metro
Posted