

SACRUS
-
Posts
16,196 -
Joined
-
Last visited
Content Type
Profiles
Blogs
Forums
American Weather
Media Demo
Store
Gallery
Posts posted by SACRUS
-
-
Showers / rain CPA should stay west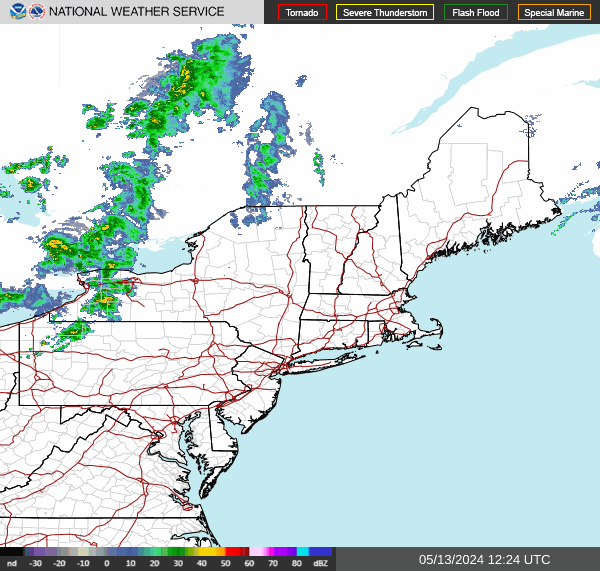
-
On 7/26/2026 at 8:47 PM, SACRUS said:
This enso is closer match to 2015 / 1997 - August will be interesting to see 2015 very warm/hot/ dry, 1997 cool/ drier.
EWR: Monthly ; Dep ; Rain
2026:
May: 64.5 ; +1.2 ; 2.43
June: 72.8 ; +2.4 ; 2.52
Jul: 78.2 ; +0.00 ; 4.91
Aug:
1997:
May: 59.2 ; -4.1; 3.12
June: 71 ; -1.8 ; 2.42
Jul: 76.8; -1.4 ; 7.05
Aug: 73.6 ; -2.8 ; 2.89
Sep: 66.9 ; -2.3 ; 2.12
Oct: 56.5; -1 ; 2.02
2015:
May: 68.2; +4.9 ; 4.94
Jun: 72 ; -0.8; 5.9
Jul: 79; +0.8 ; 2.69
Aug: 78.7 ; +2.3 ; 1.4
Sep: 74.3 ; +4.2 ; 2.33
Oct: 57.2 ; -0.3 ; 3.72
El Niño Event First / Key Year NYC Aug Departure NYC Sept Departure EWR Aug Departure EWR Sept Departure 1951–52 1951 -1.6 -1.0 -2.3 -2.1 1953 1953 -0.3 +1.2 -1.7 -0.2 1957–58 1957 -2.5 +0.5 -3.5 +0.2 1963–64 1963 -4.0 -6.2 -2.5 -5.2 1965–66 1965 -2.9 -1.8 -1.9 -0.8 1968–69 1968 -0.1 +1.4 +0.4 +1.5 1969–70 1969 +1.3 -0.2 +0.9 -1.7 1972–73 1972 -0.5 +0.3 -0.5 +0.6 1976–77 1976 -1.8 -2.6 -2.0 -2.7 1977–78 1977 -0.4 -1.0 -1.3 -1.2 1982–83 1982 -3.0 -0.9 -4.0 -2.5 1986–88 1986 -3.0 -1.4 -2.2 -0.6 1991–92 1991 +1.0 -1.8 +1.2 -1.2 1994–95 1994 -2.1 -1.6 -0.8 +0.5 1997–98 1997 -2.8 -2.2 -2.8 -2.3 2002–03 2002 +1.7 +1.0 +1.5 +1.2 2004–05 2004 -1.8 +0.1 -1.9 +0.3 2006–07 2006 -0.3 -2.6 +0.8 -2.5 2009–10 2009 -0.4 -2.9 +0.8 -2.3 2014–16 2014 -1.5 +0.5 -2.0 +0.5 2014–16 2015 +2.9 +5.2 +2.3 +4.2 2018–19 2018 +2.1 +1.5 +2.8 +2.1 2023–24 2023 -1.1 +0.2 +0.2 +2.0 2026–27 2026 TBD TBD TBD TBD
updating from thread
-
Dewpoint to 70 here. -
12 minutes ago, PhiEaglesfan712 said:
More like 2011 and 2013. Those were at least warm in the beginning before going absolutely cold in late July/early August.
2004 and 2009 were cold almost all the way throughout.
Next two weeks look solidly above normal and the period 8/6 - 8/12 should yield more 90s even in central park.
-
2 minutes ago, WestBabylonWeather said:
When are we expecting the clouds?
Early afternoon for most , sooner west
-
 1
1
-
-
Eur much like the GFs and others with a warm / humid pattern with the WC ridge backing offhsore PNW and as the Atlantic ridge hugs the EC
-
1
-
-
Records:
Highs:
EWR: 100 (2006 / 2024)
NYC: 100 (1933)
LGA: 100 (2006)
JFK: 97 (2006)
Lows:
EWR: 52 (1943)
NYC: 59 (1964)
LGA: 62 (1947)
JFK: 60 (1964)
Historical:1812: A tornado struck parts of Westchester County, New York. The same storm today would have caused major destruction. (Ref. AccWeather Weather History)
1917: 80 forest fires ,were ignited in Trinity County, California when an electrical storm produced hundreds of lightning bolts over a small area which was tinder-box dry from severe drought. (Ref. AccWeather Weather History)
1947: What turned out to be the hottest August on record started off on a decidedly cool note across parts of Michigan with record lows at: Houghton Lake, MI: 32°, Ste. St. Marie, MI: 36°, Muskegon, MI: 43°, Flint, MI: 43° and Grand Rapids, MI: 48 °F. (Ref. Wilson Wx. History)1954 - Mount Rainier in Washington State was still covered with sixteen inches of snow at the 5500 foot level following a big snow season. (David Ludlum)
1966: Very strong winds from severe thunderstorms struck northwest Oklahoma. Winds gusted to 80 mph in Laverne, and blew a parked Cessna aircraft through a fence and into a ditch. As the storms approached Gage, winds gusted to 92 mph, causing blowing dust that reduced the visibility to near zero. (Ref. Wilson Wx. History)
1972: This was the first of 25 straight days without measurable rain at Philadelphia, PA. (Ref. AccWeather Weather History)
1974: Georgia--An 18-year-old youth was killed by lightning at a lumber camp on the Ocmulgee River. Maine--One person was killed by lightning at Fort Fairfield. Aroostook County. No further details. (Ref. Lightning-The Underrated Killer.pdf)
1976: Flight operations at the former Stapleton Airport in Denver, CO were suspended for 90 minutes when the airport tower radar was knocked out and water reached a foot deep on some taxi ramps after 1.50 inches of rain fell in one hour. Record lows gripped Wisconsin including Green Bay, WI: 45°, Madison, WI: 47°, La Crosse, WI: 49° and Milwaukee, WI: 49°. (Ref. Wilson Wx. History)
1978: A severe thunderstorm developed in Beadle County, South Dakota during the afternoon and plunged southeastward. Winds up to 80 mph and hail the size of golf balls pelted the area. The hail piled up to six inches deep on roads and to three feet in the ditches. So much hail fell that it remained on the ground in some areas for 36 hours after the storm. Approximately 480,000 acres of nearly ripe crops were badly damaged or completely destroyed. Damage to crops and personal property was estimated at $4 million dollars.
Over 35 inches of rain fell in the Hill Country northwest of San Antonio, TX between 7/31 and 8/4 as the remnants of Tropical Storm Amelia stalled. (Ref. Wilson Wx. History)
1980: The relentless heat from the summer of 1980 continued. Record highs included: Wichita, KS: 110°, Oklahoma City, OK 108°, Columbia, MO: 108°, Topeka, KS: 107°, Dodge City, KS: 106°, Little Rock, AR: 105°, St. Louis, MO: 104° and Springfield, MO: 103°. (Ref. Wilson Wx. History)
1983: During the early afternoon hours, a strong microburst swept across Andrews Air Force Base in Washington, D.C. Although the base anemometer was not calibrated at extreme wind speeds, the peak gust hit 149 mph. It was reported that Air Force One, with President Reagan on board, landed less than 10 minutes before the peak gust.
1985 - A nearly stationary thunderstorm deluged Cheyenne, WY, with rain and hail. Six inches of rain fell in six hours producing the most damaging flash flood of record for the state. Two to five feet of hail covered the ground following the storm, which claimed twelve lives, and caused 65 million dollars property damage. (Storm Data)
1986 - A powerful thunderstorm produced 100 mph winds and large hail in eastern Kansas and southwestern Missouri causing 71 million dollars damage, and injuring nineteen persons. It was one of the worst thunderstorms of record for Kansas. Crops were mowed to the ground in places and roofs blown off buildings along its path, 150 miles long and 30 miles wide, from near Abilene to southeast of Pittsburg. (The Weather Channel)
1987 - Record heat gripped parts of the Midwest. A dozen cities reported record high temperatures for the date, including Lincoln, NE, with a reading of 105 degrees, Moline, IL, with an afternoon high of 103 degrees, and Burlington, IA, with a reading of 102 degrees. (The National Weather Summary)
1988 - Two dozen cities in the Upper Midwest reported record high temperatures for the date, including La Crosse WI with a reading of 105 degrees. Highs of 103 degrees at Milwaukee, WI, and South Bend, IN, were records for the month of August. (The National Weather Summary)
1989 - Hurricane Chantal made landfall along the Upper Texas coast about sunrise. Chantal deluged parts of Galveston Island and southeastern Texas with 8 to 12 inches of rain. Unofficial totals ranged up to twenty inches. Winds gusted to 82 mph at Galveston, and reached 76 mph in the Houston area. Tides were 5 to 7 feet high. The hurricane claimed two lives, and caused 100 million dollars damage. (The National Weather Summary) (Storm Data)
1998: A record 220,000 lightning bolts were recorded in the United States on this date. The usual number on summer days is about 100,000. (Ref. Wilson Wx. History)
1999: Suffolk, VA several homes were struck by lightning and at least two people were injured. (Ref. Lightning - Virginia Weather History) -
82 / 69 partly to mostly sunny but clouds building to our west and on their approach. Mid - upper 80s and like yesterday with enough sun a stray 90 in spots (NJ). Clouds back Sunday and then the next cut off to our west is slowed by the building Atlantic ridge and pumps a southerly humid flow with showers, rain and storms Mon - Tue with 1 - 3 inches plus in spots. Beyond there overall warm to hot at times very humid and likely wet. Next shot at a heat wave in the 8/6 - 8/12 period with storms/clouds the caveat.8/1 - 8/2 : Warm/humid dry - clouds
8/3 - 8/4 : Rain 1-3 inches
8/5 : Showrs/rain
8/6 - Beyond : Overall warm/humid to hot at times - storms potential and watch the tropics
-
4
-
-
Today's HighsPHL: 89
New Brnswck: 89
BLM: 88
TEB: 88
EWR: 87
LGA: 86
TTN: 86
ACY: 85
NYC: 85
ISP: 83
JFK: 83 -
Some spotty isolated showers/storms are building.
-
86 / 67 nice day \today -
Enjoy the sunshine today clouds look to build back Saturday afternoon and linger throughout much of the Sun - Wed period with next rain from southerly flow and cut off low to our west Mon-Tue. Hot/Humid beyond there.
-
 1
1
-
-
Nothing on the 7 day horizon but that may change by 8/8 with the Atlantic ridge established could increase FL- EC risk
-
1
-
-
-
-
Records:
Highs:
EWR: 103 (1954)
NYC: 102 (1933)
LGA: 97 (1954)
JFK: 95 (2002)
Lows:
EWR: 56 (1932)
NYC: 57 (1914)
LGA: 62 (1956)
JFK: 58 (1964)
Historical:
1715: Spanish treasure ships, returning from the New World to Spain, encountered a hurricane during the early morning hours on this day. Eleven of the twelve ships were lost near present-day Vero Beach, Florida.
1769: Hail fell 12 inches deep and lasted for 30 hours at Scituate, MA. (Ref. Wilson Wx. History)
1861: Cherrapunji, India set a world monthly rainfall record with a total of 366.14 inches. Cherrapunji also holds the world record rainfall for a 12-month period: 1,041.78 inches from August 1, 1860 to July 31, 1861. (Ref. Wilson Wx. History)
1891: A six day streak with high temperatures at or above 110° finally came to an end at Fresno, CA. This is their longest such streak on record. (Ref. Wilson Wx. History)
1906: Everyday this month at Bakersfield, CA the high temperature was at or above 100°. This is the only month on record where that occurred there. (Ref. Wilson Wx. History)
1931: Fresno, CA reached triple digit highs 28 days during the month. This tied a record for the most 100 degree plus days with July 1906. (Ref. Wilson Wx. History)
1936: A tropical storm moved in from the Bahamas and crossed extreme south Florida into the Gulf of Mexico. The storm strengthened into a hurricane and made landfall near Ft. Walton Beach, FL early on this date. Winds gusted to 125 mph and storm surge reached 6 feet. Four people died. (Ref. Wilson Wx. History)
1945: Richmond, Virginia had 18.21 inches during July the highest monthly total rainfall on their records. (Ref. Richmond Weather Records - KRIC)
1949: Lightning struck a baseball field at Baker, Florida during a game. The shortstop and third baseman were killed instantly.
1971: Unusually cold air settled into the southern Plains. Low temperatures were 15 to 20 degrees below normal, ranging from the mid 40s in northeast Oklahoma, the lower 50s in central sections, and near 60 in the southwest. Oklahoma City recorded a low of 53°, their coldest temperature ever observed in July. (Ref. Wilson Wx. History)
1976 - A stationary thunderstorm produced more than ten inches of rain which funneled into the narrow Thompson River Canyon of northeastern Colorado. A wall of water six to eight feet high wreaked a twenty-five mile path of destruction from Estes Park to Loveland killing 156 persons. The flash flood caught campers, and caused extensive structural and highway damage. Ten miles of U.S. Highway 34 were totally destroyed as the river was twenty feet higher than normal at times. (David Ludlum) (The Weather Channel)
1980: Record heat continued across the middle of the country. Daily record highs included: Columbia, MO: 108°, Tulsa, OK: 108°, Oklahoma City, OK: 107° and Springfield, MO: 104°. Dodge City, KS recorded 22 days of 100° or higher, with 17 of those days in a row with temperatures of 102° or higher. This was the driest July of the 20th century across Oklahoma. The statewide average rainfall was less than a half an inch, with many locations receiving no rain. Along with the dry weather, it was very hot, with several high temperature records broken. An estimated 37 people died across Oklahoma due in part to the extreme heat. (Ref. Wilson Wx. History)
1981: Springfield, IL reported a total of 10.76 inches of rain during the month, establishing a July record. Much of the total was because of two major rainstorms during the month, one of which produced 3 inches of rain, and the other, 4.33 inches. (Ref. Wilson Wx. History)
1983: Oklahoma is typically hot and dry during the summer, but July 1983 was extremely dry. Only a trace of rain fell in Oklahoma City, making it their driest July on record. The driest months ever recorded in Oklahoma City were January 1986 and August 2000, when not even a trace of moisture fell. (Ref. Wilson Wx. History)
1986 - The temperature at Little Rock, AR, soared to 112 degrees to establish an all-time record high for that location. Morrilton, AR, hit 115 degrees, and daily highs for the month at that location averaged 102 degrees. (The Weather Channel)
1987 - The deadliest tornado in 75 years struck Edmonton, Alberta, killing 26 persons and injuring 200 others. The twister caused more than 75 million dollars damage along its nineteen mile path, leaving 400 families homeless. At the Evergreen Mobile Home Park, up to 200 of the 720 homes were flattened by the tornado. (The National Severe Storms Forecast Center)
1987 - Afternoon highs of 106 degrees at Aberdeen, SD, and 102 degrees at Ottumwa, IA, and Rapid City, SD, established records for the date. It marked the seventh straight day of 100 degree heat for Rapid City. Baltimore, MD, reported a record twenty-two days of 90 degree weather in July. Evening thunderstorms produced golf ball size hail at Lemmon, SD, and wind gusts to 80 mph at Beulah, ND. (The National Weather Summary) (Storm Data)
1988 - Twenty-one cities in the north central U.S. reported record high temperatures for the date, including Sioux City, IA, with a reading of 107 degrees. The reading of 105 degrees at Minneapolis, MN, was their hottest since 1936. Pierre and Chamberlain, SD, with highs of 108 degrees, were just one degree shy of the hot spot in the nation, Palm Springs, CA. (The National Weather Summary)
1989 - Overnight thunderstorms soaked eastern Kansas and western Missouri with heavy rain. Four and a half inches of rain was reported at Nevada, MO. Evening thunderstorms in Oklahoma produced wind gusts to 75 mph at Covington. Six cities in the north central U.S. reported record high temperatures for the date, including Williston, ND, with a reading of 105 degrees. (Storm Data) (The National Weather Summary)
1991: July became the wettest month ever with 17.46 inches of rain at Columbia, SC. The old record was 16.72 inches set in August 1949. (Ref. Wilson Wx. History)
1992: Boston, Massachusetts this year had no 90 °F or higher temperatures for the year. (Ref. NOAA Boston Weather Events) Flint, MI ended their coolest July on record, while Columbus, OH, Buffalo, NY and Williamsport, PA experienced their wettest. Columbus had a record 29 cloudy days and 17 days with thunderstorms during the month. (Ref. Wilson Wx. History)
1993: The 30.3 inches of rain that fell during the month at Worth County, Missouri was nearly equal to the amount of rainfall that the area would receive in an entire year. Record precipitation that occurred across a good portion of the mid-Mississippi valley during the summer fell as far east as parts of central Illinois. During the month of July, Canton reported 12.66 inches of rain and Peoria reported 10.15 inches, both setting a record for the month. Springfield's 9.46 inches was good enough for the 2nd wettest July on record. Sioux Falls airport received 7.86 inches. That ranks July 1993 as the third wettest July on record in Sioux Falls. The high total of July 1993 also contributed to the wettest summer (June, July & August) on record in Sioux Falls with 17.39 inches of rain. Crop growth was very slow, with corn and soybeans two weeks to one month behind their normal growth by the end of July in Iowa. Losses in the corn crop amounted to nearly $1.389 billion, losses in soybeans were around $941 million dollars and oat damage was about $26 million dollars. (Ref. Wilson Wx. History)
1994: Philadelphia, PA ended the month with 10.42 inches of rain, breaking the monthly record of 10.30 inches set in July 1919. (Ref. Wilson Wx. History)
1996: A major hailstorm struck Cheyenne, WY with hail reported up to 2.5 inches in diameter. Damage was estimated to be about $3.4 million dollars. (Ref. Wilson Wx. History)
2009: Hail to golf ball size pummeled Prairie Dog State Park near Norton, KS. The hail shattered windows in 60 vehicles and caused significant damage to 40 RVs/campers; park cabins were also damaged. Total damage was estimated to be $1 million. (Weather Guide Calendar with Phenomenal Weather Events 2011 Accord Pub. 2010, USA)
2010: The heat of July 2010 was brutal and relentless !! Tied for hottest month of all time in Washington (83.1 °F) and at BWI (81.5 °F) (Until 2011 see 2011 below) Positive monthly departures at all major airports: + 3.9 °F at DCA, +5.0 °F at BWI and +3.8 °F at IAD
Ref. July PRESTO Page 1 Richmond had its hottest July with an average temperature of 82.8 °F; the previous record was 82.4 °F set in 1993. The hottest month Richmond has ever felt was August of 1900 with a mean temperature of 82.9 °F which was only 0.1 °F higher. But this July was preceded by the hottest spring and hottest June on record. Richmond's average temperature for both June and July was the hottest on record at 82 °F. Norfolk also set a record for those two months at 81.6, according to the Weather Service.
(Ref. Richmond Weather Records - KRIC)July temperatures -- Richmond had 24 days 90 °F or higher and the 113 year record for July is 26 days in 1993. Richmond had 18 days 95 °F or higher setting a new 113 year record for July the most for any month on record.
Norfolk, VA had 13 days 95 °F or higher tying their record for July. Richmond had 7 days with 100 °F or higher and the previous 113 year record, the most for any month, was 6 days in July 1977 and 1963. The 105 °F record temperature on the 24th and 25th also ties the highest maximum temperature ever recorded in July in Richmond. The Airport had ten days in 2010 with the temperature 100 °F or more; the old record was nine set in 1954. Rainfall total of only 2.01 inches for June and July made it the driest June and July on record. (Ref. Richmond Times-Dispatch Newspaper Thursday, August 26, 2010)(Ref. Richmond Weather Records - KRIC)
DCA soared to a record 102 °F on the 7th and 101 °F on the 24th. BWI recorded record high temperatures on 4 days: 6th (105 °F), 7th (101 °F), 24th (101 °F) and 25th (100 °F) On the 6th, BWI soared to 105 °F; 2nd hottest day ever in Baltimore (107 °F, 7/10/36); at or above 100 °F at BWI on 5 days, most on record At or above 90 °F on 44 days in 2010 at DCA, most number of days through July on record. Ref. July PRESTO Page 1
2011: Hottest average monthly temperatures on record at all three major airports: 84.5 °F at DCA (+5.3 °F); 81.7 °F at BWI (+5.2 °F); and 81.0 °F (+5.3 °F) at IAD. On 22nd, BWI’s high of 106 °F was second highest temperature on record; IAD's record maximum of 105 °F was hottest temperature on record; DCA’s 104 °F on 30th tied for the 5th highest reading in Washington; Heat Index values reached 121 °F at DCA, 118 °F at BWI and 117 °F at IAD due to oppressive humidity. DCA recorded 7 days with minimums at or above 80 °F, including a record 4 consecutive days from 21st-25th BWI observed 4 days with highs at or above 100 °F ; 3 such occurrences at DCA and IAD DCA reported 25 days with highs at or above 90 °F; BWI and IAD, 24; setting records at all three locations
2017: The famously fiery national park 100 miles to the west set an unpleasant record in July with an average temperature of 107.4 degrees. That ranks as the hottest month ever measured in the Western Hemisphere, according to the National Weather Service. Christopher Burt thinks it might be a world record as well. The weather historian for Weather Underground said he only knows of one monthly average that’s higher — 107.44 degrees recorded in July 2014 at a military base in northern Saudi Arabia — but that measurement has been discredited because it apparently didn’t include overnight temperature readings. “So far nobody’s come up with another figure that’s higher than Death Valley’s,” Burt said. Andy Gorelow, a meteorologist with the National Weather Service in Las Vegas, said unusually hot conditions at night were largely responsible for the new monthly record in Death Valley. The average low at the park’s official weather station in Furnace Creek, California, was 95.1 in July, the warmest of any month on record by more than a full degree. The average high in Death Valley last month was 119.6 degrees. July 7 was the single hottest day, with a high of 127. The temperature never dropped below 89 all month. (Death Valley Just Had Its Hottest Month July 2017 Elizabeth Shogren NEWS Aug. 8, 2017) (The Actual Temperatures for the Hottest Month of July 2017) -
73 / 68 sunny mid upper 80s and if we overperform a stray 90 today. Probably the nicest / sunniest day of the next 5 as some clouds return Satruday and hen Sunday - Tue/Wed a low cuts off west of us and southerly flow introduces the next shot at rain and potential deluge Mon -Tue focused. Overall warm to hot at times 8/4 - beyond, perhaps next strong heat signal is 8/6-9/9 period, but humid flow around the Atlantic ridge and a tendency for multiple systems spell wetter overall as well.
-
Today's Highs:PHL: 82
ACY: 82
New Brnswck: 81
TTN: 81
EWR: 79
JFK: 78
TEB: 77
ISP: 77
BLM: 76
LGA: 76
NYC: 74 -
clouds clinging like glue as they always do in these setups - again Wildwood and Cape May look like the winners with mostly sunny-
1
-
-
Records:
Highs:
EWR: 101 (1949)
NYC: 98 (1988)
LGA: 99 (1988)
JFK: 96 (2002)
Lows:
EWR: 57 (1946)
NYC: 57 (1956)
LGA: 61 (1956)
JFK: 59 (1968)
Historical:
1906: Fresno, CA recorded their 28th 100 degree or higher day for the month setting a record for the most triple digit high temperatures ever in July. This record was tied in July 1931. (Ref. Wilson Wx. History)
1913: Violent thunderstorms hit the Washington, DC area with 55 mph winds and 1.21 inches of rain in 10 minutes and 1.51 inches in 15 minutes. (Ref. Washington Weather Records - KDCA)
1913: Offshore winds negate the cooling effect of Lake Michigan as Muskegon hits 99° for its all-time record high temperature. Temperatures are actually a bit lower inland as Grand Rapids was 96° and Lansing 92°. Bloomington, IN soared to a record high of 108°. (Ref. Wilson Wx. History)
1923: The greatest daily precipitation to occur in the month of July in Richmond, Virginia was 7.24 inches.
(Ref. Richmond Weather Records - KRIC)1949 - The state record for Connecticut was established when the town of Greenville registered an afternoon high of 102 degrees. (The Weather Channel)
1955: Bakersfield, CA managed an afternoon high of only 67°, their lowest maximum temperature on record for July and the low of 45 °F is the record coldest low minimum for July at that location. This is also the only time the temperature has dropped below 50 °F in July at Bakersfield. (Ref. Wilson Wx. History)
1965 - The temperature at Portland, OR, reached 107 degrees to equal their all-time record high. (The Weather Channel)
1970: Hurricane Celia was born in the northwest of the Caribbean Sea on this day. The hurricane would be one of the worst ever to hit Texas and would reach Texas late on August 3. The storm reached its peak as it made landfall near Corpus Christi, Texas, as a strong Category 3 hurricane. Hurricane Celia is currently the last major hurricane to make landfall on the middle Texas Coast until Hurricane Harvey in 2017.
1978: Tropical Storm Amelia moved inland on the Texas coast north of Brownsville, TX and moved northward into Texas. The storm would not be known for damage along the coast, but rather for extensive flooding that it caused in the Texas Hill Country and in the Big Bend Area near Abilene, TX. (Ref. Wilson Wx. History)
1979 - A forty-minute hailstorm bombed Fort Collins, CO, with baseball to softball size hail. Two thousand homes and 2500 automobiles were damaged, and about 25 persons were injured, mainly when hit on the head by the huge stones. A three month old baby died later of injuries. (The Weather Channel)
1982: 4.22 inches of rain fell in Amarillo, TX setting a 24-hour July record. (Ref. Wilson Wx. History)1987 - Afternoon highs of 105 degrees at Aberdeen SD, 102 degrees at Bismarck, ND, and 102 degrees at Pueblo, CO, were records for the date. Pueblo, CO, reported just .09 inch of rain for the first thirty days of the month. (The National Weather Summary)
1988 - A dozen cities in the north central and northeastern U.S. reported record high temperatures for the date. Downtown Baltimore, MD, hit 103 degrees, marking a record eight days of 100 degree heat for the month, and ten for the year. The high of 101 degrees at Billings, MT, marked a record seventeen days of 100 degree heat for the year. Thunderstorms produced severe weather in the northeast, with nearly fifty reports of large hail or damaging winds in Pennsylvania and New York State. A tree fell on a car at Erie, PA, injuring four persons. (The National Weather Summary) (Storm Data)
1989 - Morning thunderstorms over central Missouri deluged Columbia with 5.98 inches of rain causing flash flooding. Daytime thunderstorms in Kentucky drenched Paducah with 1.73 inches of rain in less than half an hour. Evening thunderstorms in the north central U.S. produced wind gusts to 78 mph east of Moccasin, MT. (The National Weather Summary) (Storm Data)
1999: An intense heat wave began across the Midwest on the 28th and continued through the 31st. The heat peaked on this date with high temperatures in the Chicago area over 100 with heat indexes between 115 °F and 120 °F. Early morning, Chicago set their all-time highest dew point reading of 82 °F at Midway Airport. There were a total of 99 fatalities with the majority in Cook County. The overnight low of 77 °F at Rockford, IL set a record high minimum. (Ref. WxDoctor)
2000: Virginia Beach, VA a 39-year-old man was killed while doing yard work under a tree. (Ref. Lightning - Virginia Weather History)
2005: The temperature hit 101° at Denver, CO setting a new record high for the date. This was also the 7th day of the month with a high temperature of 100 or higher, which set a new record for the most 100 degree days in a month, for a season and in a year.(Ref. Wilson Wx. History)
2008: Heavy rains from the remnants of Hurricane Dolly drench section of Missouri. Total rainfall amounts included 3.05 inches at Lees Summit; 2.78 inches at Kansas City; MO and 1.63 inches at St. Louis, MO. (Ref. Wilson Wx. History)
2016: A massive rainfall caused a devastating flash flood in Ellicott City, Md., a 1-in-1,000-year event that has been happening with unprecedented frequency since 2010, meteorologists said. The storm, killed two people, dumped 6.5 inches of rain on Ellicott City in only about 3 hours, with 5.5 inches falling in just 90 minute. One nearby spot recorded 8.22 inches, amounts that weather service meteorologist Greg Carbin called 'off the charts...' A 1-in-1,000-year rain event is a statistical way of expressing the probability of such a massive rainfall occurring in any given year in a given location, according to the NCEI. In other words, it had a 1 in 1,000 chance of occurring in Ellicott City ," (Ref. The Washington Post, Capital Weather Gang, NWS and NCEI) -
70 / 64 cloudy - cut off spinning around with clouds over most of the area and some scattered showers. Break and stretches of sunshine later this afternoon but these cut offs are stubborn to clear out. Hoping we're partly sunny Friday and Saturday before clouds/showers return Sunday but even Saturday could see clouds for a good part of the day. Overall warmer to hot at times 8/4 - beyond - Humid flow also supports continued rain chances pending on your liking thats fortunate or unfortunate.
-
1
-
-
Today's Highs:
ACY: 86
New Brnswck: 86
PHL: 86
EWR: 85
BLM: 84
JFK: 84
LGA: 83
TTN: 83
TEB: 81
NYC: 80
ISP: 79 -
82 / 67 lots of clouds - Wild Wood and cape may look like the sunny spots right now-
1
-
-
More sun now and up to 75 here 75 / 69

August 2026
in New York City Metro
Posted
Today's Highs:
New Brnswck: 90
TEB: 90
PHL: 90
EWR: 88
TTN: 88
ACY: 87
LGA: 87
NYC: 86
JFK: 85
BLM: 85
ISP: 83