NorthShoreWx
-
Posts
5,517 -
Joined
-
Last visited
Content Type
Profiles
Blogs
Forums
American Weather
Media Demo
Store
Gallery
Everything posted by NorthShoreWx
-
Probably less than one not knowing the local history might think. In this latest major snowfall there was an obvious difference in the radar evidence. ISP snowed for many hours while the north shore was dry slotted. In previous major snow storms where there was no such obvious differences in radar presentation, we still fall short of ISP in storm totals (usually significantly so), but the history is that a day or so later, we have equal or greater snow depth.
-
Don't forget that ISP adds up 6-hour-snowfalls. That matters the most in prolonged major events and sometimes not at all in smaller events.
-
Surely there must be an exception for 32.5° and rain.
-
No change at the stake since this morning. Some sun and temps in the 40s tomorrow will impact the softened pack.
-
Light NE breeze off the sound....32/33 is basically the water temperature...and the snowpack temp. 32 with light rain. At least by April it will be 42 and rain
-
How much has it accumulated? We're switched over for the duration down here, but can still live vicariously. Looks like mix line is up near 84 east of the river on dual pol.
-
Most likely yes, and definitely by June, but it's still winter out there today.
-
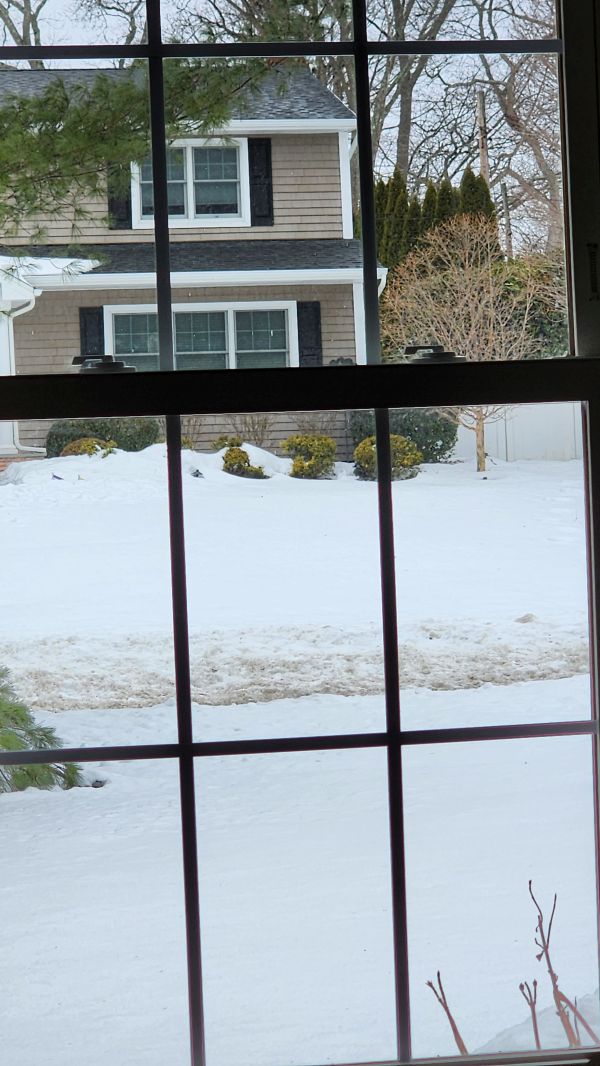
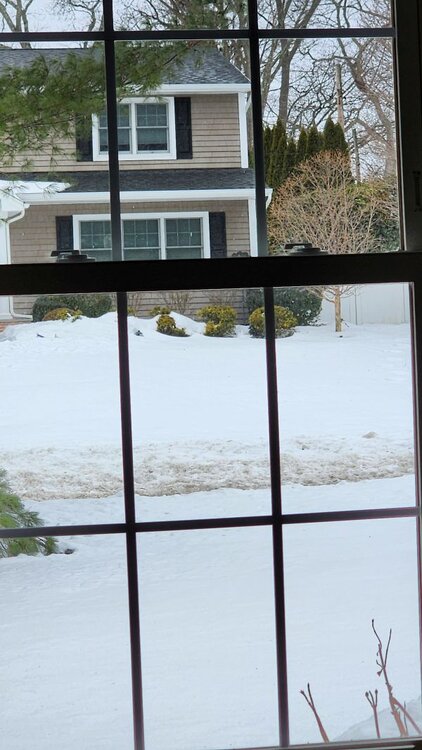
36/31 here with nothing more than a few sprinkles over the past hour. 9" of snow at the stake. It's hard to put all of the declarations that winter is gone in context with the view out the window a couple of hours ago with light snow and sleet falling:
-
Maybe a little east of there...395? There was evidence of the usual banding, but not of any shadowing in the Hudson and CT River valleys.:
-
This needs work, but I gave it a half-hearted try: Simulated Radar Loop: March 11–14, 1888 March 11 (Evening): A low-pressure system moves up the Atlantic coast, initially appearing as a broad area of light-to-moderate rain across the Mid-Atlantic. March 12 (Midnight): As the storm reaches the New Jersey coast, it undergoes explosive cyclogenesis. On radar, you would see a sharp "rain-to-snow" line as cold Canadian air rushes in, turning precipitation into heavy, blinding snow over NYC. March 12 (Midday): The storm's "eye" or center (reaching a peak intensity of 978 hPa) sits just offshore. A massive, stationary band of intense snowfall (reflectivity values of 40+ dBZ) stalls over New York and western New England. March 13: Instead of moving out to sea, the cyclone loops counterclockwise near the southern New England coast. On a loop, the heavy snow bands would appear to rotate and pinwheel over the same regions for over 24 hours, dumping up to 22 inches in NYC and nearly 60 inches in parts of New Jersey and upstate New York. March 14: The system finally weakens and drifts east into the Atlantic, with the simulated radar showing the heavy bands breaking into scattered snow showers.
-
Light sleet 35/27. We've a light coating of new sleet / snow. The driveway is crunchy underfoot, but not slippery.
-
It's started flurrying here.
-
It won't matter if April is dry.
-
Son of a bdcf!
-
Grass is so disheartening.
-
Clearly some errors on that map. A trace in Northport? Not.
-
10" 0.1" new this morning. It started to whiten colder pavement, but fell short.
-
Not only that, but the additional hour comes at the warmest time of the day.
-
After our 56 high, it's already down to 37 here.
-
Sounds like you've prepared your argument.
-
Meanwhile, 18z NAM has .1 to .15" qpf as snow during the day Sunday and HRRR seems like it's going to do the same. Others can argue about accumulation.
-
Same here, but getting bare spots in the usual locations... where there wasn't much snow in the first place with good sun exposure. Otherwise, still deep snow cover. We hit 56⁰ today. 49⁰ now
-
Can we all bring a +1?
-
Good point. Calling the past 5 or 6 years the new normal is no more accurate than doing so in 2018 would have been. We just don't know about snowfall and the main consistency in the patterns has been the inconsistency. We do know that it's been considerably warmer on average, for whatever reasons. It was nice that this winter bucked the trend. I suspect there will be more decent winters ahead, but don't ask me which