NorthShoreWx
-
Posts
5,510 -
Joined
-
Last visited
Content Type
Profiles
Blogs
Forums
American Weather
Media Demo
Store
Gallery
Everything posted by NorthShoreWx
-
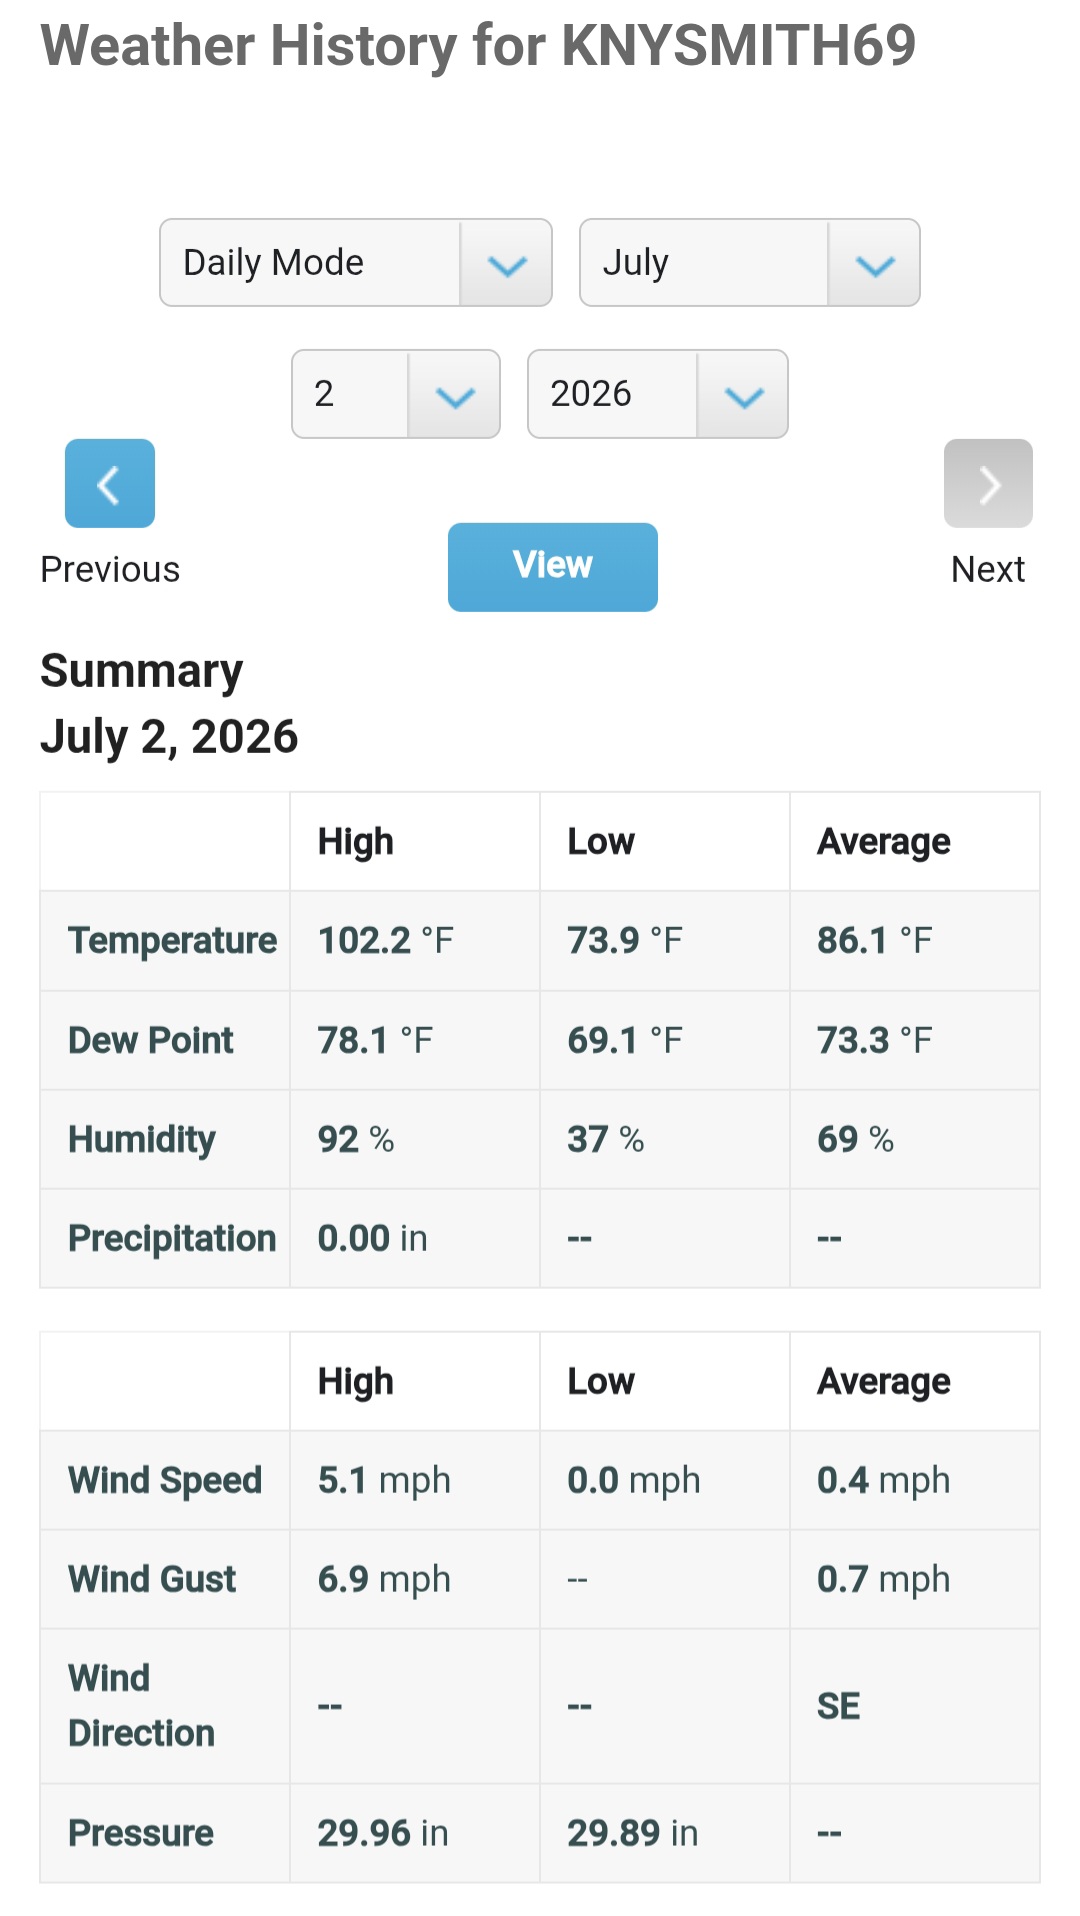
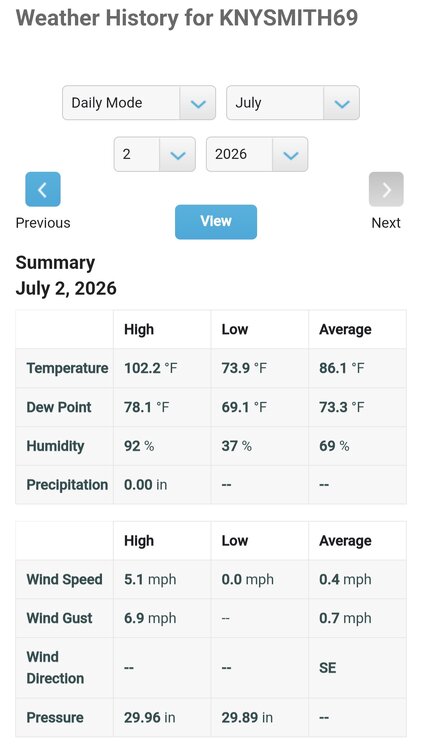
Mark Twain was right. Two 100° days in a row at the end of last week and two days in a row with a max of 68° to start this week. 65.8 now and the wind feels a bit chilly. I think we may end with a heating degree day today.
-
Meanwhile, Fairfield and New Haven counties are getting rather drowned. Temp here is only 64° 2.88" rain since midnight , 2.99" storm total, 3.55" since the 4th. Still raining.
-
2.17" here since midnight (as of 1:40 pm). 2.84" total since the 4th. The lawn is happy and the current temperature of 66° is a big improvement.
-
Well that was quite the interruption. Had to take down tents and bring the bar in in a hurry.
-
I remember baking in the 90s Austin in March. At least the evenings were a little better at that time of year. Min this morning was 76. 97 now. I mowed the lawn in the backyard this morning while it was still in the shade, but the temp was already up to 90.
-
Good thing the water temperatures saved us today.
-
1:36 pm. Just hit 100.0 here.
-
Heatwave here: June 30 64 90 July 1 68 91 0.53" This morning's low was 74. Up to 85 shortly before 9am. Point and click warmer again with Friday at 101⁰
-
Max here yesterday was 90.1 at 1:09 pm. 68⁰ now with a noisy thunderstorm in progress. 0.40" in the guage so far. Nice!
-
My system is poorly placed for wind, but tonight's gust to 20.6 mph is tied for the 2nd highest gust it has recorded since I installed it 18 months ago. Highest was 21.2 mph. Its still useful. If I'm not home and I see it 10 mph or more, I know its windy.
-
Also this insane cloud of pollen out of one of our pines.
-
No rain yet, but we have large limbs down with the gust front a few moments ago. Heard them cracking and saw one fall across the street.
-
I'm the guest bartender at the St James Brewery this afternoon/evening (fundraiser at the tasting room for my SAR team) and was hoping for nice weather. Instead we got a typical November day. 53° cloudy and windy at 1pm. At least it wasn't last Saturday. PS Stop in and say hello.
-
Only 0.35" here.
-
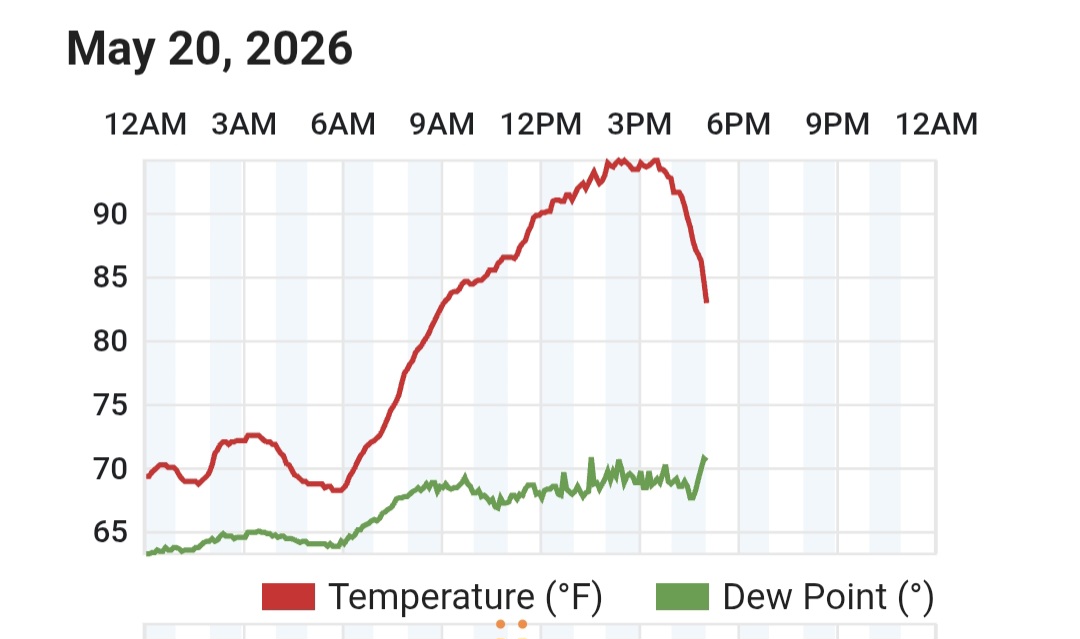
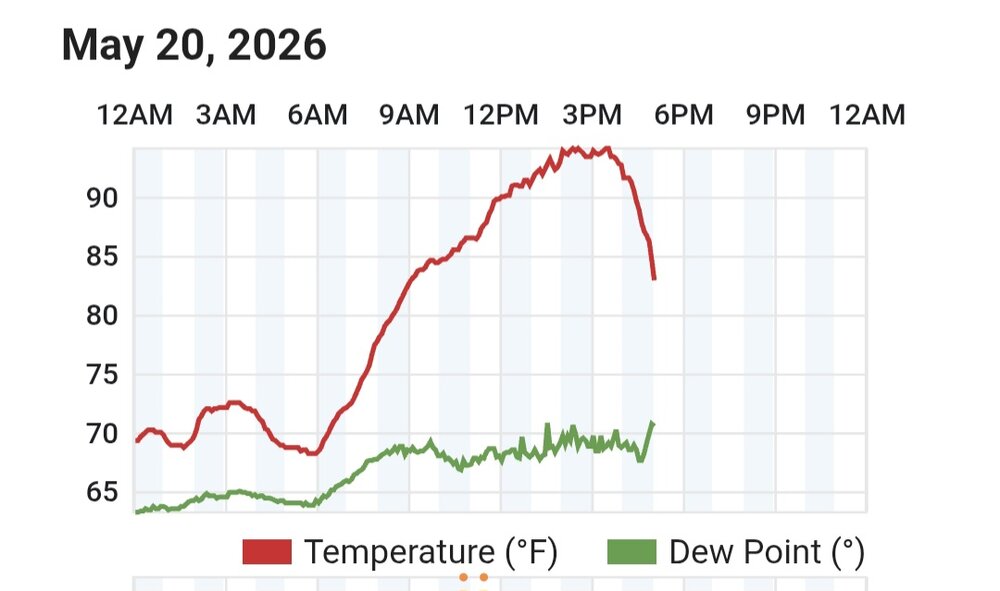
Kind of a fun temperature graph. There was no local storm responsible for the drop, although the nearby ones definitely helped. DP up around 70 though non é buono.
-
That's it. Put that marketing degree to work. Occasional rumbles of thunder here, but only a few moments of insignificant rain so far. We maxed at 94⁰ here. Down to 81 now.
-
Up to 1.46” on the Ambient. Drawn out rain like this is probably about the best way to get an inch and a half on dry ground. 40⁰ and rain continues.
-
It's a balmy 43° here. All things considered, I'll take the rain.
-
30.0⁰ low this am
- 970 replies
-
- 1
-

-
- april showers bring may..
- rain
- (and 2 more)
-
Took the thruway from Kingston around 9pm tonight and got treated to an awesome light show to the south.
-
Low was 27⁰ here with lots of frost.
- 970 replies
-
- 1
-
-
- april showers bring may..
- rain
- (and 2 more)
-
While I agree in principle, most of the non-native flowering cherries are sterile. Eastern Redbud is a better choice.
-
I had a date. We were off from school and took the LIRR to see the circus at MSG. Thundersnow at Herald Square is a cool memory.
- 970 replies
-
- 5
-
-
- april showers bring may..
- rain
- (and 2 more)
-
Down to 54⁰ here now. It's actually turned into a nice afternoon for getting some work in the garden done. It was too warm before.
- 970 replies
-
- 1
-
-
- april showers bring may..
- rain
- (and 2 more)
-
We seem to have topped out at 66⁰ here. Pretty steady around 65⁰ at the moment. It's dropped from the mid 60s earlier to the low 50s around Montauk. The cape is in the 40s. This is very April.
- 970 replies
-
- 1
-
-
- april showers bring may..
- rain
- (and 2 more)