NorthShoreWx
-
Posts
5,514 -
Joined
-
Last visited
Content Type
Profiles
Blogs
Forums
American Weather
Media Demo
Store
Gallery
Everything posted by NorthShoreWx
-
Addendum: this hole was showing up on the mesos, but I wrote it off as just an oddity of the map rendering software. That's excellent detail from the SR models. Latest HRRRRRR indicates we may get a relative break soon, but only crumbs left at that point.
-
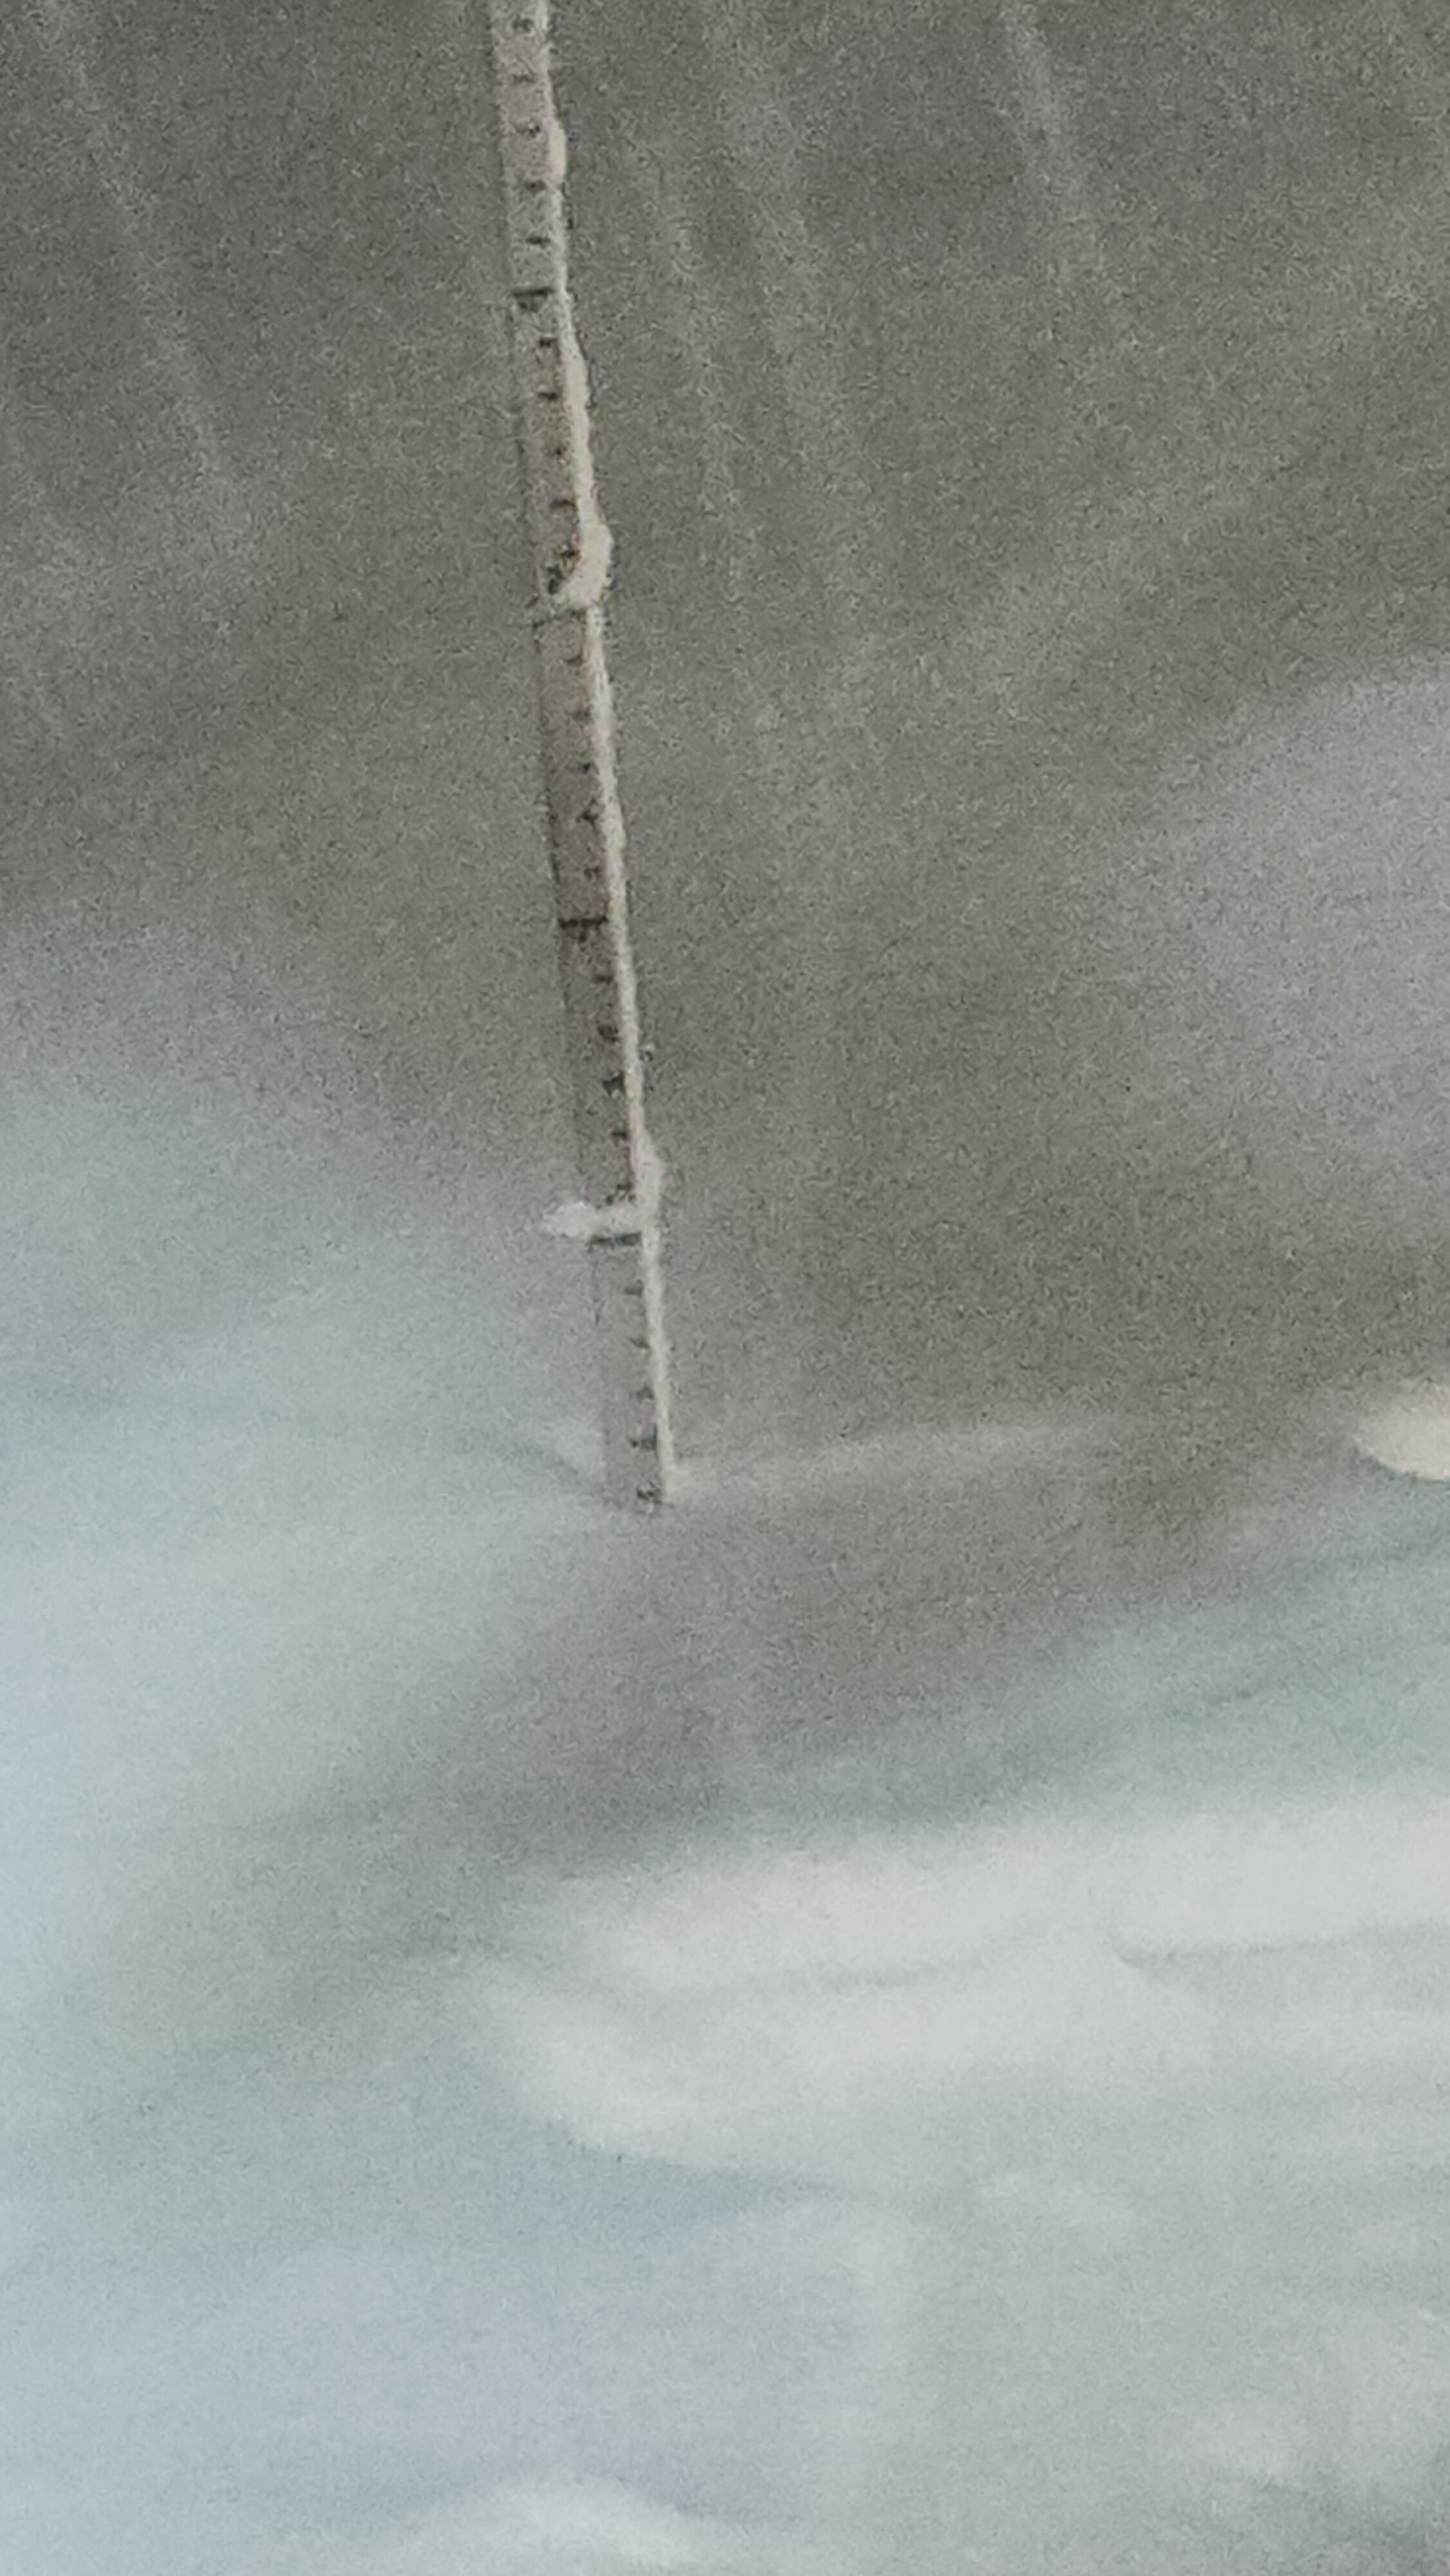
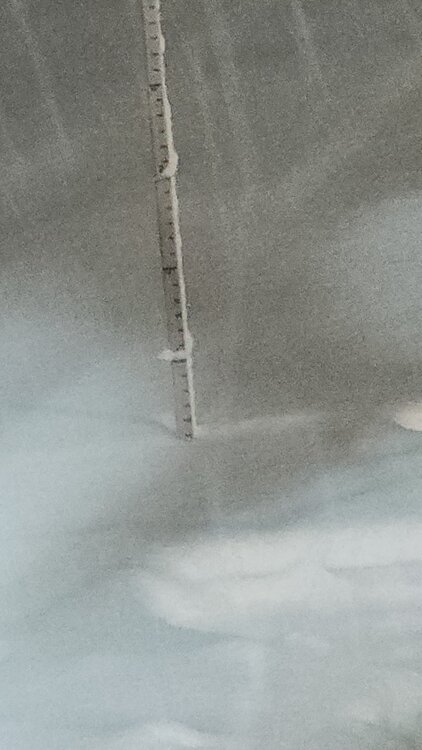
Haven't measured yet today, but snow stake is at 18" implying at least a 14" snowfall. We've had nothing since 7am; three hours and counting in this crazy little snow hole over the north shore of central LI. At least one sizeable limb is down from a hemlock out back.
-
I caught a transformer blowing and the power going out (other side of our street...we're still on for the moment) at 5:21 am: https://www.instagram.com/p/DVGObqykfDt/?igsh=NWl2N3VwYTczZWVj The second video was a few moments before.
-
0/0 out there
-
Looking pretty blizzardy:
-
That's exactly what I am doing.
-
9.0 inches of snow on 2/22 brings our seasonal total to 40.1"
-
As of 12:00 am measured 9.0". Snow depth is 14". Temp/dp is 30.2/29.5. Snow of varying intensity, mostly light to moderate since then. It's windy, but well short of blizzard criteria on both wind and viz.
-
10:30 pm: https://www.instagram.com/reel/DVFgEARjfnX/?igsh=MW9uOXpkMHJyd2J3Nw==
-
No puking snow ... or old fashioneds
-
Yup. So much for the idea that surface temps affect ratios.
-
Subjectively speaking, these are much more well formed dendrites than during the January storm. It is occasionally windy; one gust was enough to blow snow from the ground (not just from the trees and roofs). Still 30/29 S+
-
Stay safe!
-
In other news, the snow gods are violently tossing their cookies right now. S+ 30/29 Looks like about 8" at the stake, which means roughly 3" new. I'll do a proper measurement and wipe the boards at midnight.
-
Total on ground. I clarified the post. We're pushing 3" now, but thats from eyeballing the stake..not a measurement from the snow board.
-
I must have been feeling a little giddy when I failed to mention that is new plus old snow. However, if this rate keeps up it won't take long to get to 7"
-
I promise not to double count the 5" that was already there.
-
Includes old. I edited the post to be more clear. That was fun
-
That includes the old snow pack.
-
30/29 Heavy Snow. 7" on ground. 2.5ish new.
-
Aren't you always there? Sorry, couldn't resist
-
That's 4 years too long
-
I used to work a couple of blocks from there.
-
No but they would be prepared for anything and would have stocked up on ice-melt weeks ago.
-
Unlikely that the latest globals will beat the latest mesos now that the snow has begun. Someone is getting buried with extreme prejudice, it's just really hard to pin down who until the best bands set up. Even the losers will probably get close to a foot of snow.