

michsnowfreak
-
Posts
17,108 -
Joined
-
Last visited
Content Type
Profiles
Blogs
Forums
American Weather
Media Demo
Store
Gallery
Posts posted by michsnowfreak
-
-
6 hours ago, TheClimateChanger said:
Here is some additional analysis courtesy of Grok:
To identify any discernible trend in the snowfall data over the 30-year period (1995-96 to 2024-25), I’ll analyze the numbers for patterns such as an overall increase, decrease, or cyclical behavior. One common approach is to calculate a simple linear trend (e.g., using a moving average or regression slope) and examine the variability. Let’s start with some observations and a basic analysis.Data Recap (in chronological order):-
1995-96: 31.3"
-
1996-97: 35.9"
-
1997-98: 27.2"
-
1998-99: 52.1"
-
1999-00: 29.3"
-
2000-01: 47.3"
-
2001-02: 42.5"
-
2002-03: 66.9"
-
2003-04: 36.6"
-
2004-05: 80.7"
-
2005-06: 41.9"
-
2006-07: 36.3"
-
2007-08: 78.2"
-
2008-09: 64.8"
-
2009-10: 46.1"
-
2010-11: 69.4"
-
2011-12: 25.5"
-
2012-13: 47.9"
-
2013-14: 96.2"
-
2014-15: 48.5"
-
2015-16: 35.0"
-
2016-17: 41.6"
-
2017-18: 62.5"
-
2018-19: 31.9"
-
2019-20: 43.8"
-
2020-21: 47.0"
-
2021-22: 47.6"
-
2022-23: 37.2"
-
2023-24: 21.4"
-
2024-25: 27.9"
Step 1: Visual InspectionLooking at the data, there’s significant year-to-year variability. For example:-
The highest snowfall is 96.2" (2013-14), and the lowest is 21.4" (2023-24).
-
There are peaks (e.g., 80.7" in 2004-05, 78.2" in 2007-08, 96.2" in 2013-14) and troughs (e.g., 21.4" in 2023-24, 25.5" in 2011-12).
-
Recent years (2020-25) show a mix of moderate (47.6", 47.0") and low values (21.4", 27.9"), suggesting no immediate sharp upward or downward trend.
Step 2: Simple Moving Average (5-Year)A 5-year moving average can smooth out year-to-year fluctuations and reveal longer-term trends. Here’s a sample calculation for a few periods:-
1995-96 to 1999-00: (31.3 + 35.9 + 27.2 + 52.1 + 29.3) ÷ 5 = 35.16"
-
2000-01 to 2004-05: (47.3 + 42.5 + 66.9 + 36.6 + 80.7) ÷ 5 = 54.8"
-
2010-11 to 2014-15: (69.4 + 25.5 + 47.9 + 96.2 + 48.5) ÷ 5 = 57.5"
-
2020-21 to 2024-25: (47.0 + 47.6 + 37.2 + 21.4 + 27.9) ÷ 5 = 36.22"
Observations:-
The early period (1995-2000) averages around 35.16".
-
The middle period (e.g., 2000-2005, 2010-2015) shows higher averages (54.8", 57.5"), with notable peaks.
-
The recent period (2020-2025) drops to 36.22", closer to the earlier years.
This suggests a possible rise in snowfall in the 2000s and early 2010s, followed by a decline in the 2020s.Step 3: Linear Trend (Simplified)To estimate a trend, I’ll calculate the slope of a linear regression line using the years as the x-values (1 to 30) and snowfall as the y-values. The formula for the slope (m) in a simple linear regression is:m=n∑(xiyi)−∑xi∑yin∑(xi2)−(∑xi)2m = \frac{n \sum (x_i y_i) - \sum x_i \sum y_i}{n \sum (x_i^2) - (\sum x_i)^2}m = \frac{n \sum (x_i y_i) - \sum x_i \sum y_i}{n \sum (x_i^2) - (\sum x_i)^2}Where:-
n=30n = 30(number of years)
n = 30 -
xi=x_i =year number (1 to 30)
x_i = -
yi=y_i =snowfall amount
y_i = -
∑xi=1+2+...+30=465\sum x_i = 1 + 2 + ... + 30 = 465
\sum x_i = 1 + 2 + ... + 30 = 465 -
∑xi2=12+22+...+302=9,315\sum x_i^2 = 1^2 + 2^2 + ... + 30^2 = 9,315
\sum x_i^2 = 1^2 + 2^2 + ... + 30^2 = 9,315 -
∑yi=1,367.3\sum y_i = 1,367.3(total snowfall, from earlier)
\sum y_i = 1,367.3 -
∑(xiyi)=\sum (x_i y_i) =sum of each year number multiplied by its snowfall
\sum (x_i y_i) =
Calculating∑(xiyi)\sum (x_i y_i):\sum (x_i y_i)-
Year 1 (1995-96): 1 × 31.3 = 31.3
-
Year 2 (1996-97): 2 × 35.9 = 71.8
-
Year 3 (1997-98): 3 × 27.2 = 81.6
-
...
-
Year 30 (2024-25): 30 × 27.9 = 837
Summing all 30 terms (computed step-by-step):∑(xiyi)=31.3+71.8+81.6+156.3+146.5+283.8+297.5+534.4+329.4+807+461.9+435.6+639.1+842.4+691.5+830.7+432+622.7+1,345.4+727.5+560+707.2+1,125+606.1+919.8+1,027+1,142.4+1,005.6+642.6+837=20,392.9\sum (x_i y_i) = 31.3 + 71.8 + 81.6 + 156.3 + 146.5 + 283.8 + 297.5 + 534.4 + 329.4 + 807 + 461.9 + 435.6 + 639.1 + 842.4 + 691.5 + 830.7 + 432 + 622.7 + 1,345.4 + 727.5 + 560 + 707.2 + 1,125 + 606.1 + 919.8 + 1,027 + 1,142.4 + 1,005.6 + 642.6 + 837 = 20,392.9\sum (x_i y_i) = 31.3 + 71.8 + 81.6 + 156.3 + 146.5 + 283.8 + 297.5 + 534.4 + 329.4 + 807 + 461.9 + 435.6 + 639.1 + 842.4 + 691.5 + 830.7 + 432 + 622.7 + 1,345.4 + 727.5 + 560 + 707.2 + 1,125 + 606.1 + 919.8 + 1,027 + 1,142.4 + 1,005.6 + 642.6 + 837 = 20,392.9Now, plug into the slope formula:m=30×20,392.9−465×1,367.330×9,315−4652m = \frac{30 \times 20,392.9 - 465 \times 1,367.3}{30 \times 9,315 - 465^2}m = \frac{30 \times 20,392.9 - 465 \times 1,367.3}{30 \times 9,315 - 465^2}m=611,787−635,794.5279,450−216,225m = \frac{611,787 - 635,794.5}{279,450 - 216,225}m = \frac{611,787 - 635,794.5}{279,450 - 216,225}m=−24,007.563,225m = \frac{-24,007.5}{63,225}m = \frac{-24,007.5}{63,225}m≈−0.38m \approx -0.38m \approx -0.38The slope is approximately -0.38 inches per year, indicating a slight downward trend over the 30 years.Step 4: Interpretation-
Slight Downward Trend: The negative slope (-0.38"/year) suggests that, on average, snowfall has decreased slightly over the 30-year period. Over 30 years, this equates to a drop of about 11.4" (0.38 × 30), though this is a simplification and doesn’t capture variability.
-
High Variability: The data fluctuates significantly (e.g., 96.2" in 2013-14 vs. 21.4" in 2023-24), so the linear trend may be overshadowed by natural year-to-year variation.
-
No Clear Cycle: There’s no obvious repeating pattern (e.g., every 5 or 10 years), though peaks tend to cluster in the 2000s and early 2010s.
-
Recent Decline: The last few years (2023-24: 21.4", 2024-25: 27.9") are among the lowest, which could hint at a recent downward shift, but it’s too early to confirm without more data.
ConclusionThe data shows a slight long-term downward trend in snowfall (about 0.38 inches per year), but the trend is weak due to high variability. Snowfall peaked in the 2000s and early 2010s (e.g., 96.2", 80.7", 78.2"), while recent years lean toward lower amounts. However, the fluctuations are large enough that no strong, consistent trend dominates. Weather patterns, climate factors, or regional influences could be at play, but this dataset alone doesn’t provide a definitive cause.Is there a link for this Grok? I have lots of data that Ive saved, computed, etc, but not with AI lol.
Heres my snowcover days data. I didnt start that til midway thru the 1999-00 season, however, so snowcover N/A for me for 1995-96 thru 1999-00 (an idiotic move considering Jan 1999).
Days with T+ 1”+ 3”+ 5”+ 10”+ 2000-01 87 66 53 35 12 2001-02 60 35 12 2 0 2002-03 106 67 43 19 2 2003-04 77 60 41 25 0 2004-05 102 65 51 36 5 2005-06 73 46 25 16 0 2006-07 75 49 15 7 1 2007-08 105 69 43 21 2 2008-09 88 62 47 38 22 2009-10 84 58 31 25 3 2010-11 94 81 70 58 14 2011-12 43 20 8 1 0 2012-13 75 52 28 9 0 2013-14 119 95 81 75 52 2014-15 80 74 59 45 36 2015-16 59 37 17 3 0 2016-17 51 39 25 16 1 2017-18 83 61 43 33 5 2018-19 66 39 12 7 0 2019-20 64 41 20 7 0 2020-21 64 47 28 16 7 2021-22 73 49 27 10 0 2022-23 50 35 19 3 0 2023-24 35 18 12 6 0 2024-25 74 44 21 8 0 -
-
6 hours ago, TheClimateChanger said:
Here is Grok's ranking from highest to lowest:
Ranked from Highest to Lowest:-
2013-14: 96.2"
-
2004-05: 80.7"
-
2007-08: 78.2"
-
2010-11: 69.4"
-
2002-03: 66.9"
-
2008-09: 64.8"
-
2017-18: 62.5"
-
1998-99: 52.1"
-
2014-15: 48.5"
-
2012-13: 47.9"
-
2021-22: 47.6"
-
2000-01: 47.3"
-
2020-21: 47.0"
-
2009-10: 46.1"
-
2019-20: 43.8"
-
2001-02: 42.5"
-
2005-06: 41.9"
-
2016-17: 41.6"
-
2022-23: 37.2"
-
2003-04: 36.6"
-
2006-07: 36.3"
-
1996-97: 35.9"
-
2015-16: 35.0"
-
2018-19: 31.9"
-
1995-96: 31.3"
-
1999-00: 29.3"
-
2024-25: 27.9"
-
1997-98: 27.2"
-
2011-12: 25.5"
-
2023-24: 21.4"
Let me know if you'd like further analysis!Thanks. I mustve added something incorrectly when I calculated my avg. Never heard of grok lol.
-
-
3 hours ago, Stormchaserchuck1 said:
These peaks in high temps around the edges of Winter are a little concerning for annual snow/cold, imo.
1/26/2024, Washington DC hit 80F.. that was the first time it ever did 80s late Nov - late February.. crushed it by a month!
Do we hit 90F in DC sometime 4/4-7? 80F this Saturday.
October and November have had 80s lately.
March 2012 was an interesting turn, as many places in the Mid-Atlantic hit 90F. Since then overall snowfall has been down 2012-2025.
Always look forward to your input! Some crazy stats on DC. Especially the 80 in Jan - while we have had 60s in Jan before, nothing close to that. We actually havent hit 50 in Jan in 4 years. Looks like summer like warmth in the mid atlantic while the far northern tier gets a winter storm. I dont worry about annual cold/snow here and the edges, as we still get very early and late snows. My big thing is keeping the winter fun and deep winter periods from mid-November to mid-March. My bigger soapbox, and I KNOW itll change one of these years soon, is the wildness of how we havent had a great December since 2017. We have had several white Christmases since then, but as a whole, have to go back to 2017 to get a great December! Only 1 finished snowier than avg, and that was by 0.7". Every other month has had standouts since then.
In the 7 years since that snowy winter of 2017-18....
October- 4 of 7 with snow, 1 being measurable
November- 6 of 7 snowier than avg
December- 1 of 7 snowier than avg
January- 2 of 7 snowier than avg
February- 3 of 7 snowier than avg
March- 1 of 7 snowier than avg
April- 3 of 6 snowier than avgMay- 3 of 6 with snow, 1 being measurable
-
Cant remember if I posted this or not, but looking at snowfall after mid-April in Detroit shows that never have more flakes fallen so late with such frequency as they have in the 2020s.
Snow has fallen on an average of 4.6 days per year after mid-April in the 2020s, easily #1, with 2nd place being the 1900s at 3.2 days. Also, with an average post mid-April snow of 2.2", the 2020s also blows away 2nd place (1920s - avg 1.3"). As long as the next 5 years manage to see a total of 1.9" or more of snow in this timeframe, the 2020s will finish as the most snowy of any decade for post mid-April snow.
5 years with most days of snow on/after April 15th:
2020- 10 days
1907- 8 days
1947- 7 days
2023- 6 days
1956- 6 days5 years with heaviest accumulation of snow on/after April 15th
1923- 8.2”
1943- 5.5”
2020- 5.2”
1883- 5.0”
2005- 4.4”
Decade  Avg days 4/15+  Total snow 4/15+
1880s		0.5 days	0.6”	(total 5.8”)
1890s		0.5 days	0.3”	(total 2.7”)
1900s		3.2 days	0.6”	(total 6.0”)
1910s		1.4 days	0.3”	(total 2.7”)
1920s		2.0 days	1.3” 	(total 12.9”)
1930s		1.8 days	T	(total 0.4”)
1940s		1.8 days	0.9” 	(total 9.3”)
1950s		2.5 days	0.2”	(total 1.5”)
1960s		2.1 days	0.5”	(total 5.4”)
1970s		1.2 days	0.1”	(total 0.8”)
1980s		1.7 days	0.5”	(total 5.2”)
1990s		0.7 days	0.1”	(total 0.7”)
2000s		1.2 days	0.5”	(total 4.5”)
2010s		1.7 days	0.5”	(total 5.3”)
2020s		4.6 days	2.2”	(total 11.1”) *thru 2024*
-
31 minutes ago, 40/70 Benchmark said:
Yes, from around I 84 and points north snowfall is more closely correlated with precipitation, but obviously excessive warmth is a detriment to snowfall.
Yup. Every Fall the annual search for blues on temp anomaly maps starts once snow becomes possible in October but that color blue becomes less and less important as we get into winter. Huge difference between some warmer than avg temps vs all out torch.
It was refreshing how different this was the the last several (I consider it a better winter than '22-23 despite getting 10 more inches of snow then). I'm never one to get too into the whole "drought is a bad sign for winter", but it would be nice if the intense drought in the western half of the country could ease up by this coming Fall.
-
A November like day today with billowy gray skies, flurries, and gusty winds.
-
 1
1
-
-
2 hours ago, IWXwx said:
I'm feeling your pain. My last two years totals put together are eight inches under my yearly average!!
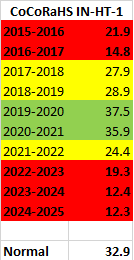
This was my 30th season measuring snowfall. The average is somewhere in the 46-47" range but we had a lot of stellar winters so I'd guesstimate a more realistic longterm avg is 42-45".
If nothing else measurable falls this season, my 27.9" will rank as 4th least of the 30 years, behind only '97-98, '11-12, & '23-24.
Much like the high snow years don't last forever, neither do the low ones. Keep the ruler ready for '25-26!
-
2
-
-
24 minutes ago, 40/70 Benchmark said:
It would entail some better times ahead, but I don't mean to imply that there willl be a deade long orgy, either....I expect some more lean season(s) prior to the solar min.
Makes sense. Im not expecting a decade long orgy either, but I like the prospects. I am not one who grades a winter soley based on snowfall, I consider all aspects of winter (cold and esp snowcover)...but for those who want JUST snowfall, the biggest worry for non-snowbelt areas of the Lakes is not temps, but a dry winter.
-
2
-
-
On 3/20/2025 at 12:32 PM, FPizz said:
I just want the cold from this season from Dec-Feb. To have fairly large lakes here in NJ frozen for weeks is something that we haven't had in a while. It was just too dry overall.
I agree. Obviously cold & dry isnt my first choice, but id take it over any combination starting with "warm" or "mild" anyday. Jan & Feb were the textbook definition of "winter" here. Everything was frozen and the landscape was white. It was not real exciting for a weather enthusiast, but it was absolutely winter in winter.
I didnt quote this in the other thread bc I figure we are kinda moving onto early thoughts for next winter, even tho this season may have a few flakes left in it lol. @40/70 Benchmark said "I think we are flipping to -AMO/+PDO, much like the mid to late 70s". I really like this idea. It certainly doesnt mean any location will replicate whatever they had in those seasons, or that no one will get screwed, but the overall trends would likely mean a lot more wintry systems/storms and fun for many. One thing that has always fascinated me throughout the climate period of record is the tendency for very good winters and very blah winters to alternate with each other, both in singular years (good bad good bad) or in clumps (good good bad bad good bad bad good) etc. A majority of wintry climes have had winters that are subpar to their climo for the last several years now, so its inevitable that a change is coming soon. The stretch of great winters a decade ago was not going to last forever, and neither is a stretch of subpar ones. And hopefully the signs start brewing asap.
-
1
-
 2
2
-
-
23 hours ago, cyclone77 said:
Appreciate it. Interestingly the observation location switched back and forth from the weather bureau in Davenport, to the QC airport (where MLI currently is) several times. Guessing that weather bureau ob of 2.5" is included in the seasonal total, but would have to see the rest of the data for that season from both locations. The current location of DVN is well north of the old weather bureau location (up in Mt. Joy Iowa) and didn't open until 1995.
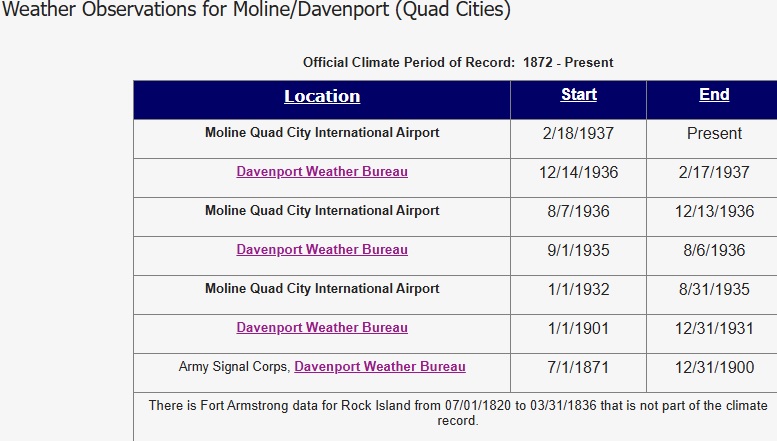
Its very confusing and what the heck was all that switching back and forth from 1932-37 lol. In any event, while it was definitely a shitty winter in 1936-37, the data in the 1930s seems a bit suspect for MLI/DVN.
-
11 hours ago, thomp2mp said:
Yes, by Elizabeth Lake.
We only picked up a T here. Just 0.4" in March, disappointing end to the snow season (although certainly cant rule out a bit more fleeting snow thru April). In fact, I dont do my "winter grade" until April, but basically its been cemented as a C winter for me. Nov/Dec: C-/D+, Jan/Feb: A-/B+, and Mar a D-.
-
1
-
 1
1
-
-
16 minutes ago, thomp2mp said:
Coming down at a pretty good clip here for the past half hour or so. Nice DAB


Is this waterford?
-
A mix of rain, snow and sleet this evening. Hard to believe this is the 10th day this March snow has fallen at some point, despite only 0.4" on the month.
-
12 hours ago, cyclone77 said:
Snow total at MLI ended up being 0.8", 0.5" at DVN. MLI now up to 8.2" for the season, with 1.6" futility buffer remaining.
Lawns are starting to green up now with the recent rains/warmth.
As tcc pointed out, there appears to be a very important M day in early December 1936. Now make no mistake about it, 1936-37 was an absolutely horrendous winter for snowfall in most spots, far worse than 2024-25. I cringe when I hear of it. It is Detroits least snowy winter on record (12.9"), Bostons least snowy on record (9.0") and ranks extremely high on the all time snowless lists in many if not most places. But I'm not sure it should be molines #1. Depending what happened that day in Dec 1936, the true #1 might be 11.1" in 1901-02. However, perhaps it was an ice storm that day, and not snow after all? Do you have access to any old local newspapers? I have access to all Detroit free press since 1837, but I wonder if anyone has access to all newspapers? It would be the best way to find out what happened that day.
-
1
-
-
22 hours ago, TheClimateChanger said:
I previously looked into this. It has a small warm bias which peaks from May to July. Maybe on the order of about 0.4F or 0.5F warmer than the average of maximum and minimum, but reaching as much as 1F during the long day period (i.e., May & June).
Keep in mind, this period predates even standardized time zones let alone daylight saving time. Time was measured in local solar time (LST), where noon equaled the time where the sun was at its peak in the sky directly overhead. For practicality, official time would be kept at one site for a city or region - perhaps a courthouse.
Detroit, owing to its location in the western part of the eastern time zone, is offset about 40 minutes from solar noon under standard time, and 1 hour, 40 minutes under DST. So the morning observation would have been taken around 8:40 EDT, so it doesn’t do a good job capturing the morning low. The inclusion of a 9 pm observation (which would actually be as late as 10:40 EDT) helps to mitigate this somewhat but does not completely eliminate the warm bias. In the wintertime, the 7 am observation (~7:40 am EST at Detroit) is pretty close to sunrise and less biased. This is the main reason for the strong seasonal effect of the bias.
The Smithsonian later changed the formula to double weight the 9 pm observation around 1870. So it became the average of 7, 2, 9, 9, which is much closer to max + min / 2, but still has a small residual warm bias by my reckoning.
Note, however, that observations weren’t always made by that standard. Sometimes only two observations were made. Sometimes, the observations were sunrise, 2, and 9 which would do a much better job of capturing the minimum. This formula would probably even have a cool bias relative to max + min / 2. However, it wasn’t as common as the other. Sometimes, the morning observation was taken even later.
Interesting info. While it can't be used for accuracy purposes, it DOES give you the feeling for what were the cold or mild winters, hot or cool summers etc. This combined with whatever newspapers noted at the time gives a rough idea of what the winters are. I'm going to work on a project this year to try and piece together these old years. Just at a glance I find it interesting that there was a heavier concentration of milder winters in the 1840s-50s and colder 1860s-70s, not unlike trends 100 years later.
-
Picked up a trace of rain with last night's severe threat. Then today's defo gave 0.10" rain and a trace of snow. Temps nearly 40° colder than yesterday at this time.
-
I found some really old weather data (1839-1872) and was curious if anyone knows or if there's any studies on this...temps were only taken 3 times a day (7am 2pm 9pm) and averaged. Clearly that is not going to be accurate like temps being recorded hourly, but I'm curious how much margin for error the end results would have. Also, does that error have a warm or cold bias or would it be a tossup?
-
47 minutes ago, King James said:
1930s about to repeat?
No thank you!
-
1
-
-
52 minutes ago, Stevo6899 said:
That's definitely going to be me when we finally get that big dog around here...
You dont need a big dog to enjoy those conditions. Thats me whenever we get snowstorms.
-
1
-
-
1 hour ago, Powerball said:
With this current storrm, Omaha has seen the most Blizzard Warnings ever to start a year (3).
And there's only been 1 other year (2018) where they saw 4.
It's wild too considering Omaha was well on track for futility through the first 2/3rds of winter...
Quite a turn around in Omaha. No big amounts, but multiple storms. They were sitting at an incredible 1.0" season to date thru February 10th, and they are now at 13.4" before whatever they get today.
Although, I cant figure out what the other 2 blizzard warnings were besides today and March 4th. Since they are prone to crazy windstorms and blizzards in the plains, seems like the NWS's out there sometimes overdue blizzard warnings (in terms of how often they verify vs when they are issued).
-
55 minutes ago, LibertyBell said:
Wow I thought it was like New York City, where both JFK and LGA (not to mention EWR) as well as Central Park do all those things. Is there any reason why they can't all be first order sites? Budgetary cuts?
Honestly I have no clue. New York is one of the only few cities I know of that has multiple "first order" stations. All NWS offices encourage plenty of spotter reports of precip and snowfall (in fact the NWS is in a big advertising spree right now to get more cocorahs), but most metros have one main "first order" station that does it all, precip, snow, snow depth, intra-hour obs as needed, etc etc. When Detroit switched from DET to DTW in 1966 everything "official" just moved to DTW. I wasnt even born so I cant say haha.
-
1
-
-
2 hours ago, cyclone77 said:
Some models show the tiniest deformation zone known to man streaking 2-3" of snow through this area tomorrow night, effectively ending the futility chase. How sad would that be? Either way will easily be the worst winter possible in anyone's lifetime, but it would have been nice to have the futility record to show for it lol.
Ive never really dug into MLI data before, but now my curiosity is there, so ill play around later with some of their data and let you know if i find anything interesting. I always cringe when people discuss futility at northern locations in January...now, however, is a very legit time to discuss all-time snow futility for MLI.
-
2 hours ago, LibertyBell said:
They should still have one at Midway, they probably both have weather stations.
They do have an ASOS at Midway, just as they have an ASOS at Detroit City Airport still. Problem is, these are no longer first order sites, so their accuracy is no better than any one of the other thousands of ASOS in place across the country. They dont have snowfall observations, they dont have near their equipment that their 1st order counterparts (ORD & DTW) have, and when theres errors it can often take a long time to fix them. (if theres any malfunctioning equipment at a first order site they are usually right on it).
-
 1
1
-
-
50 minutes ago, mnchaserguy said:
That’s how last year was for us in MSP. Almost no snow all winter but we had a good amount at the very end of winter/early spring they made it look like an almost average year.
.Looks like it was still a solidly below avg year in MSP, but a late rally with 15.2" in March brought 2023-24 to 29.5". MSP only had 1.7" this Jan and 2.0" last Jan, but has already had 9.5" in Mar and 15.2" last Mar.
In 2022-23, Detroit saw 15.8" of its 37.1" total come in March.
-
1
-


2025-2026 ENSO
in Weather Forecasting and Discussion
Posted
Not quite sure how it all works in Germany...I know obviously the basics of -NAO is colder, but from a snow-perspective, the midwest/Great Lakes often get more snow with a +NAO in winter. Its the fringe parts of the season (ie Nov/Mar-Apr) when we root on -NAO. A DJF -NAO usually screams suppression so we have to rely soley on NW flow. Im not sure if the same can be said for new england wrt the benefits of -NAO vs +NAO. And Im really not well-versed at all in the climate of Germany.