

michsnowfreak
-
Posts
17,117 -
Joined
-
Last visited
Content Type
Profiles
Blogs
Forums
American Weather
Media Demo
Store
Gallery
Posts posted by michsnowfreak
-
-
55 minutes ago, LibertyBell said:
Wow I thought it was like New York City, where both JFK and LGA (not to mention EWR) as well as Central Park do all those things. Is there any reason why they can't all be first order sites? Budgetary cuts?
Honestly I have no clue. New York is one of the only few cities I know of that has multiple "first order" stations. All NWS offices encourage plenty of spotter reports of precip and snowfall (in fact the NWS is in a big advertising spree right now to get more cocorahs), but most metros have one main "first order" station that does it all, precip, snow, snow depth, intra-hour obs as needed, etc etc. When Detroit switched from DET to DTW in 1966 everything "official" just moved to DTW. I wasnt even born so I cant say haha.
-
 1
1
-
-
2 hours ago, cyclone77 said:
Some models show the tiniest deformation zone known to man streaking 2-3" of snow through this area tomorrow night, effectively ending the futility chase. How sad would that be? Either way will easily be the worst winter possible in anyone's lifetime, but it would have been nice to have the futility record to show for it lol.
Ive never really dug into MLI data before, but now my curiosity is there, so ill play around later with some of their data and let you know if i find anything interesting. I always cringe when people discuss futility at northern locations in January...now, however, is a very legit time to discuss all-time snow futility for MLI.
-
2 hours ago, LibertyBell said:
They should still have one at Midway, they probably both have weather stations.
They do have an ASOS at Midway, just as they have an ASOS at Detroit City Airport still. Problem is, these are no longer first order sites, so their accuracy is no better than any one of the other thousands of ASOS in place across the country. They dont have snowfall observations, they dont have near their equipment that their 1st order counterparts (ORD & DTW) have, and when theres errors it can often take a long time to fix them. (if theres any malfunctioning equipment at a first order site they are usually right on it).
-
 1
1
-
-
50 minutes ago, mnchaserguy said:
That’s how last year was for us in MSP. Almost no snow all winter but we had a good amount at the very end of winter/early spring they made it look like an almost average year.
.Looks like it was still a solidly below avg year in MSP, but a late rally with 15.2" in March brought 2023-24 to 29.5". MSP only had 1.7" this Jan and 2.0" last Jan, but has already had 9.5" in Mar and 15.2" last Mar.
In 2022-23, Detroit saw 15.8" of its 37.1" total come in March.
-
1
-
-
1 hour ago, OrdIowPitMsp said:
Winter storm watch one county south. This one is starting to have the same feel as the March 5th storm with models trending northwest and a sharp snowfall gradient setting up over the metro. March has been rocking this year.
That's kind of how 2022-23 was here. A rockin' march made what had been a shitty snow season finish just a bit below avg.
-
1
-
-
20 minutes ago, cyclone77 said:
Haha yeah, it's not surprising. All winter when it was cold most of the time we couldn't buy a flake, and now every system comes out wants to snow on us lol.
Luckily still a 2.4" cushion to work with, so if we can get past this storm with 2" or less still have a good shot.
Is this for MLI or DVN?
-
2 hours ago, BuffaloWeather said:
You can't use Buffalos data before 1940 due to it being literally on the lake. It isn't a good representative of weather across our area, way too marine influenced. If Detroits recording station moved, that data shouldn't be used either. Not really up for debate, moving a recording station eliminates its accuracy and consistency.
I think a majority of climate sites have moved over the years. Just how it goes. Why? No idea lol. DTW (detroit metro airport) has been the official climate station for Detroit since 1966. From 1934-1966 it was DET (Detroit city airport) and from 1874-1933 it was various places downtown Detroit. I personally like DTW best because it's closer to me but I still like looking at the old data. If you look at the climate summaries in ncdc it will tell you all of a stations site moves and corresponding dates.
I know Chicago's moved from midway airport to ohare airport in I think like 1980.
-
3 hours ago, LibertyBell said:
Central Park still has undermeasuring issues compared to the airports
I wonder who does the measuring? Central Park should be the easiest of the bunch. Measuring in a park should offset the wind issues that are common at most airports. Some first order stations measure at locals near the airport that are in a more user-friendly environment (ie a park).
-
1
-
-
2 hours ago, 40/70 Benchmark said:
They way I see it.....snowfall is measured in 6 hour increments, and snow depth is obtained the old-fashioned way.
Its really a very easy process. Snowfall and depth are reported every 6 hours, with the depth at 7am being the official depth for the day. However, measuring at the end of a snowfall is best too, so if you have 3 hours before obs time with no more snow coming, obviously measure then instead of waiting.
Also theres a few common sense practices - if snow melts or is rained on before obs time, you have to do your best to account for what snow fell before this happened. Also we have all had times where our snowboard is scoured free of the snow that fell OR drifted over from the winds. In any of those cases, it should be obvious to the obsever to properly measure averages and not just go by whats on the snowboard. These are all common sense practices than any observer, especially ones for first order sites, need to be following.
Side note - Speaking of depth...i know ive mentioned this before, but i cant believe BOS & ORH dont report 12z snow depth. They are literally the only first order sites ive seen that dont do snow depth. I wonder why?
-
3
-
-
5 minutes ago, Chicago Storm said:
That particular one is a Silver Maple.
So, one of the usual early bloom-ers. However, there are some other species at nearly the same level as well.
Ive noticed the silver maples started budding this week here, just the color (probably the light angle) of that one pic made it look different. I usually expect the silver maples to start doing this in March, one of the earliest ones, then after a while those buds rain down everywhere making a mess on the street, then it still seems like a while after that before leaves pop. Long process. Meanwhile, other species of maples you can barely see the buds (unless you look closely) then theyll suddenly pop those lime flowers then leaves (of course this hasnt happened yet lol).
-
1 hour ago, bluewave said:
While we have had several epic snowfall seasons from the mid 1990s into the 2010s, earlier eras measured snowfall differently. So the seasons prior to this period undermeasured snow compared to the way we do now. So correcting these undercounts will show heavier snows from the late 1800s into 1980s. This would lead to a longer term decline snowfall when the earlier totals are raised. So places that don’t show any long term trend will show a decline when the measurements are standardized. And some areas which already have long term declines will show even steeper declines. Plus areas which show longer term increases may shift to not much trend when the earlier era snowfall is increased.
https://news.ucar.edu/14009/snowfall-measurement-flaky-history
As a hydrometeorological instructor in UCAR’s COMET program and a weather observer for the National Weather Service, I am keenly interested in weather trends. In this case, climate change is an important factor to explore, since we know that the heaviest precipitation events have intensified in many parts of the world (see related story: Torrents and droughts and twisters - oh my!).
But when we turn to snowstorms in the Northeast, or elsewhere in the U.S., there is an additional factor at work when comparing modern numbers with historical ones. Quite simply, our measuring techniques have changed, and we are not necessarily comparing apples to apples. In fact, the apparent trend toward bigger snowfalls is at least partially the result of new—and more accurate—ways of measuring snowfall totals. Climate studies carefully select a subset of stations with consistent snow records, or avoid the snowfall variable altogether.
Official measurement of snowfall these days uses a flat, usually white, surface called a snowboard (which pre-dates the popular winter sport equipment of the same name). The snowboard depth measurement is done ideally every 6 hours, but not more frequently, and the snow is cleared after each measurement. At the end of the snowfall, all of the measurements are added up for the storm total.
NOAA’s cooperative climate observers and thousands of volunteers with the Community Collaborative Rain, Hail and Snow (CoCoRaHS), a nationwide observer network, are trained in this method. This practice first became standard at airports starting in the 1950s, but later at other official climate reporting sites, such as Manhattan’s Central Park, where 6-hourly measurements did not become routine until the 1990s.
Earlier in our weather history, the standard practice was to record snowfall amounts less frequently, such as every 12 or 24 hours, or even to take just one measurement of depth on the ground at the end of the storm.
You might think that one or two measurements per day should add up to pretty much the same as measurements taken every 6 hours during the storm. It’s a logical assumption, but you would be mistaken. Snow on the ground gets compacted as additional snow falls. Therefore, multiple measurements during a storm typically result in a higher total than if snowfall is derived from just one or two measurements per day.
That can make quite a significant difference. It turns out that it’s not uncommon for the snow on the ground at the end of a storm to be 15 to 20 percent less than the total that would be derived from multiple snowboard measurements. As the cooperative climate observer for Boulder, Colorado, I examined the 15 biggest snowfalls of the last two decades, all measured at the NOAA campus in Boulder. The sum of the snowboard measurements averaged 17 percent greater than the maximum depth on the ground at the end of the storm. For a 20-inch snowfall, that would be a boost of 3.4 inches—enough to dethrone many close rivals on the top-10 snowstorm list that were not necessarily lesser storms!
Another common practice at the cooperative observing stations prior to 1950 did not involve measuring snow at all, but instead took the liquid derived from the snow and applied a 10:1 ratio (every inch of liquid equals ten inches of snow). This is no longer the official practice and has become increasingly less common since 1950. But it too introduces a potential low bias in historic snowfalls because in most parts of the country (and in the recent blizzard in the Northeast) one inch of liquid produces more than 10 inches of snow.
This means that many of the storms from the 1980s or earlier would probably appear in the record as bigger storms if the observers had used the currently accepted methodology. Now, for those of you northeasterners with aching backs from shoveling, I am not saying that your recent storm wasn’t big in places like Boston, Portland, or Long Island. But I am saying that some of the past greats—the February Blizzard of 1978, the Knickerbocker storm of January 1922, and the great Blizzard of March 1888—are probably underestimated.
So keep in mind when viewing those lists of snowy greats: the older ones are not directly comparable with those in recent decades. It’s not as bad as comparing apples to oranges, but it may be like comparing apples to crabapples.
Going forward, we can look for increasingly accurate snow totals. Researchers at NCAR and other organizations are studying new approaches for measuring snow more accurately (see related story: Snowfall, inch by inch).
But we can’t apply those techniques to the past. For now, all we can say is that snowfall measurements taken more than about 20 or 30 years ago may be unsuitable for detecting trends – and perhaps snowfall records from the past should not be melting away quite as quickly as it appears
Unless I am a reincarnated weather observer who worked at the Weather Bureau in the early 20th century, I cant say anything for certain (none of us can) about any individual snowfall of the past. But what I CAN say is that I know the practice of measuring every 6 hours has been in place at Detroit since about 1950, and I assume the same for many other first-order stations. I highly doubt that 6-hour intervals didnt start in NYC til the 1980s. Airports began this in 1950. Also, one thing that sets apart snowfall around here vs the east coast is that we are a climate of smaller, more frequent snowfalls. We do not get big 18-24" storms that can inflate (or deflate) our totals in a 2-day period. Lots of T-1, 1-2, 2-4, 3-6" type snowfalls, then the occasional 7-12" type storms. Also, the old days of the weather bureau had to manually monitor weather hourly, so while most NWS offices have corrected the lazy measurement practices that took many places when the FAA took over in the 1990s, Ive heard countless complaints about observers calling a snowfall a T or something because it melted before obs time. That would NEVER have happened in the old days.
Another thing I look at when analyzing old weather data for here is the liquid equivalent and snow depth numbers. Is the depth making sense (ie: is there some settling, or the following days snow depth always just the snowfall added onto the previous depth). For the liquid equivalent, are they just applying a 10:1 ratio or are they actually measuring liquid and snowfall separately? In the old days, 1870s-1890s, they usually (but not always) applied a 10:1 ratio to every snowfall. So, does this mean they measured snow and just applied 10:1, or even worse that the melted liquid but didnt measure the snow? No one will ever really know.
In the end, my analysis of snowfall data for Detroit, which dates to 1874 but the NWS begins in 1880 due to some M data in the 1870s...my assessment is that data is very accurate from around 1900 - present. Accurate does not mean there likely werent flaws, but looking at all factors (temps, precip, snowfall, snow depth, following days snow depth, etc) the data makes very good sense. Snowfall measurement practices from 1950-present have remained unchanged. Im not happy with some of the data from the mid-1990s to early 2000s (when the FAA took over and before snowpaid observers were hired), although none of it affected the record books in a huge way. And of course with many different obsevers, wind, etc, snow is always subject to error. Always has been, always will be. Snowfall from 1900-1949 seems quite accurate as well. Its is only the snowfall data from 1874-1899 that I look at with a grain of salt. You can still create a great mental picture of when the big storms were, when the snowy/cold winters were and when the warm, bare, "open winters" were, but the actual measurments likely had much more error than today.
-
 1
1
-
-
2 hours ago, chubbs said:
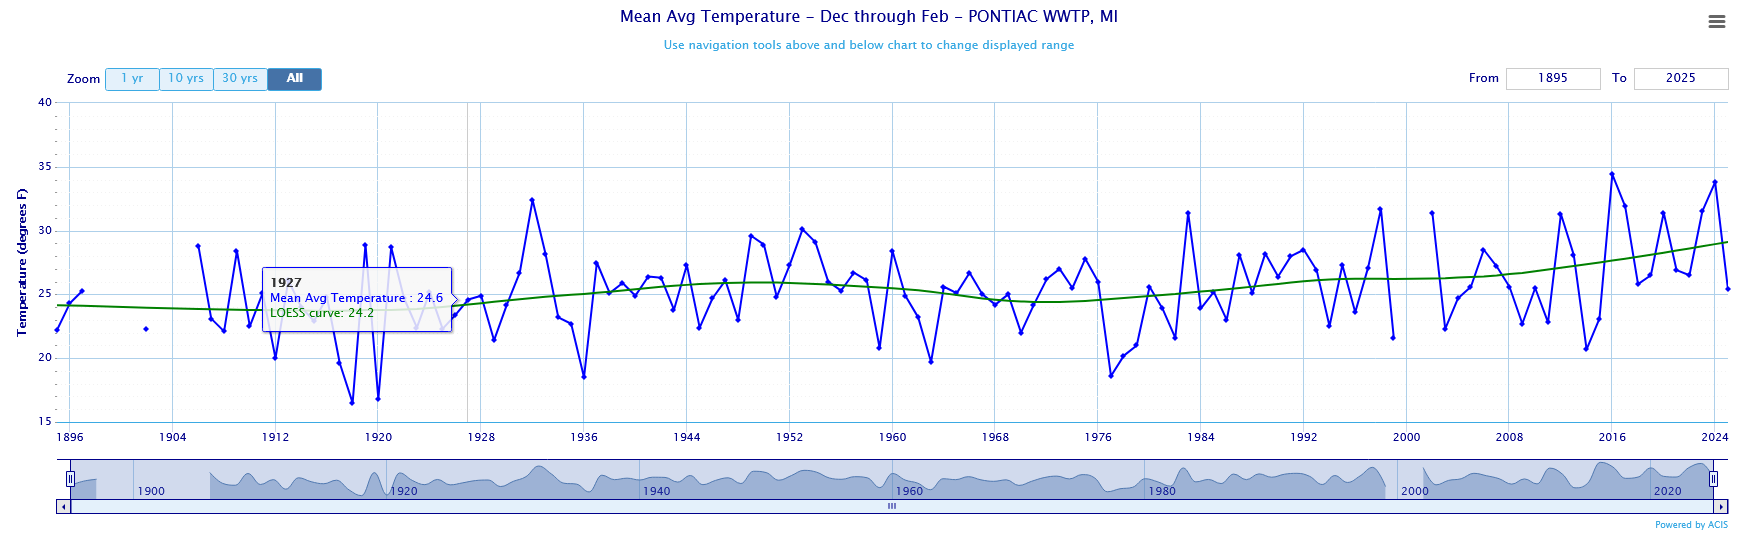
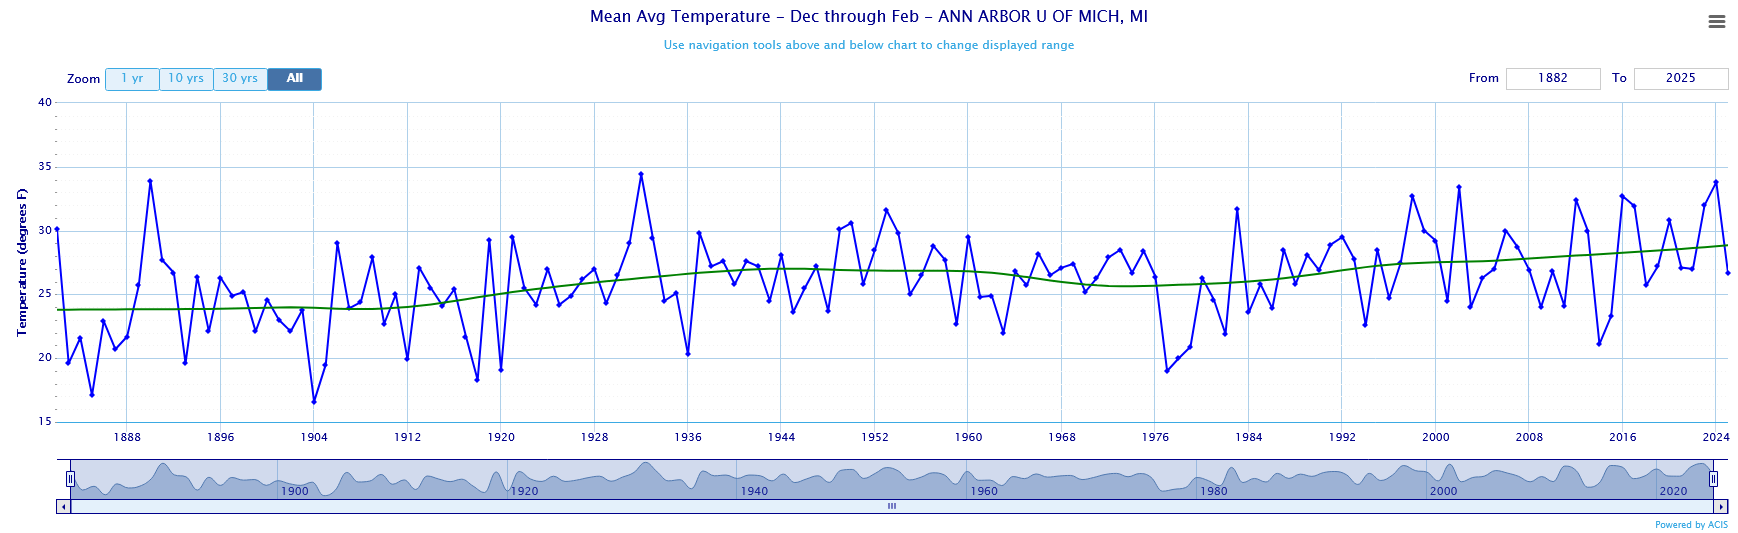
Here's the NOAA link. I choose the lowess fit because, as you noted, there are warm and cool periods before 1970 that aren't fit well by a straight line. The fit only uses the data points plotted in the NOAA series, i.e. 1895 and later. If there was any change before 1895 wouldn't be reflected in the Lowess fit.
In a quick search, found 2 local stations with long-term data without the station moves in the Detroit series: UM at Ann Arbor and Pontiac. NOAA used these stations and many more for the Wayne County series. Weather data is correlated for hundreds of miles so stations outside of Wayne County provide useful information. I spent 3 years in NW Ohio 1978-81 so can attest to how cold midwest winters were 45 years ago.
https://www.ncei.noaa.gov/access/monitoring/climate-at-a-glance/national/time-series
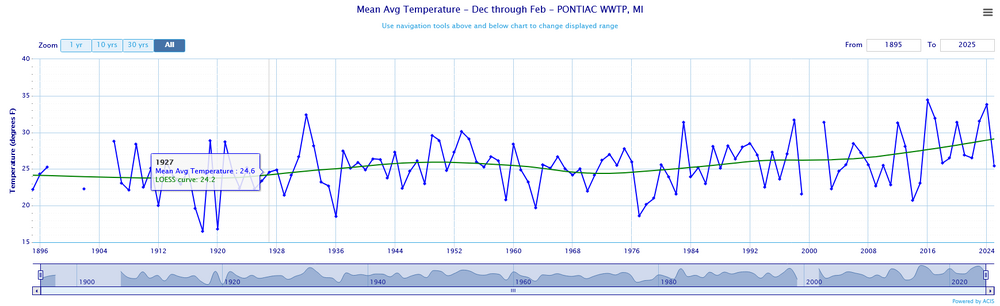
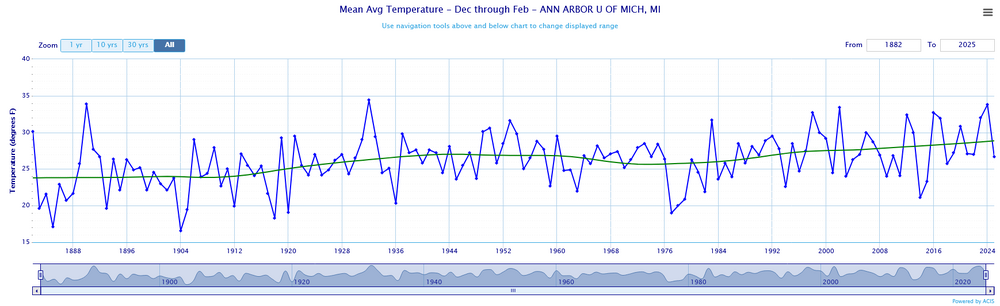
Thanks. Ill bookmark it. I like looking at the Ann Arbor data because they have a consistent record to 1880 and are only about 20 miles due west of DTW, with their weather observing site not changing since 1880. The only problem with that, and im sure its a minor one, is they are a coop site, not first order, so there are bound to be a few errors here and there.
You really did pick a doozy 3-year time period to live in the region lol. That cold was brutal and not normal. At Toledo, the winters of '76-77, '77-78, '78-79 rank as 1st, 2nd, and 8th coldest (since 1874). At Detroit they rank 3rd, 6th, & 12th coldest (since 1874), and at Ann Arbor 4th, 10th, & 13th coldest (since 1881). Depending on the airmass, there are many situations where NW OH can actually be colder (esp at night) than SE MI, with more urban sprawl in SE MI and more rural areas in NW OH. Id suspect there were multiple instances of that in the late 1970s. These colder nights offset the days when warm fronts dont get as far north as Detroit, and you have Toledo & Detroit winter temp averages nearly identical (DTW just a TAD colder), despite the fact that Detroit gets noticebly more snowfall and snowcover.
-
1
-
-
8 hours ago, GaWx said:
Indeed, I am! I find wx data that approaches or sets new records, like for these zonal winds, extra interesting to say the least. Other examples: record obliterating DJF +PNA for non-Nino ‘24-‘25, -5 AO in Feb ‘25, 1/21-2/2025 heaviest sleetstorm on record in my area, etc. My professional and educational background is statistics related in general, which I’ve enjoyed following since being a kid. Since I’m a big wx enthusiast in addition to being a big statistics enthusiast, wx stats are a natural for me to enjoy following.
I too am a huge wx stat fan. Its easily my #1 favorite aspect of weather. I have so many different charts/graphs/papers in folders detailing Detroits weather history from the beginning of record to present, much of which never comes up to be posted here. I also browse other areas stats as well, whenever something comes up that makes me wonder "I wonder how this compares to past events there". My #2 aspect would be actually observering the weather. Been a wx observer since 2004 and measured snow since 1995. A distant #3 is the favorite of many, the actual tracking with this often headache-inducing model data

-
1
-
-
4 hours ago, chubbs said:
That's why I like NOAA (and other groups), who correct for inconsistency due to: station moves, measurement method changes, heat island, etc. Detroit winter warming looks very similar to other US cities.
.thumb.png.285d72e7c31237502af72478a8d7152d.png)
I've never heard of these. Is there a link to look at this data? Not sure about loess curves. It implies starting 1896 with a mean of what, 23°? The mean temp from 1874-1896 was 26.9°, when there was literally only one accurate wayne county station.
Regardless I don't dispute that winters have warmed. They've also gotten snowier and wetter. This is why I like looking at things like the "winter severity index" which takes all things into account. I have studied local winters extensively and certainly concentrate most heavily on snow and snowcover. I can absolutely tell you that 1970s-80s and 2000s-10s winters I'll take in a heartbeat. Hard pass on 1930s-50s winters. In the 1870s-1920s era I'd take majority of them but there are a handful of UGLY ones thrown in I'd need to ditch lol.
-
6 hours ago, LibertyBell said:
Those do match for here.... how did you do in 1917-18, that was our coldest, the rest are similar.
Warmest is almost a perfect match, surprised that number 1 is a winter from the 1800s though lol. How much snow did you get that winter?
1917-18 ranks as the 6th coldest, and 1918-19 ranks 13th warmest. Quite a rubber band effect.
1877-78 is widespread known as "year without a winter" in the upper midwest. We actually did ok with avg snowfall here (43.4") but as I've said before temps and snowfall here don't always go hand in hand. Locally the winter of 1881-82 was the worst for warmth + lack of snow. That remains Detroits warmest winter on record.
The period of 1875-1882 was absolutely wild here with every other year alternating between bitterly cold winters and very warm winters. Not just talking either side of normal. Talking all winters that still currently reside in the top 20 coldest/warmest list.
-
1
-
-
6 hours ago, LibertyBell said:
Many of those other winters had a lot of snow here, so I'm surprised you got screwed in 1995-96.
And it was a la nina too!
The Chicago to Detroit corridor was very screwed in 1995-96. Would've been even worse if not for a march 20th snowstorm. Of those winters mentioned, the other ones were much better winters.
1995-96: 27.6"
2000-01: 39.0"
2002-03: 60.9"
2008-09: 65.7"
2010-11: 69.1"
2013-14: 94.9"
2014-15: 47.5"-
1
-
-
3 hours ago, LibertyBell said:
I'm shocked 1993-94, 1995-96, 2002-03, 2003-04, 2004-05, 2010-11, 2013-14, 2014-15 aren't in the top 20 coldest list.
A poster in the lakes forum has awesome monthly graphs ranking midwest/lakes climate back to 1807.
In the Great Lakes/Midwest:
the top 5 coldest winters
1.) 1903-04
2.) 1978-79
3.) 1884-85
4.) 2013-14
5.) 1874-75
Top 5 warmest winters
1.) 1877-78
2.) 2023-24
3.) 1931-32
4.) 2001-02
5.) 1997-98
-
1
-
-
21 minutes ago, LibertyBell said:
wow I'm surprised all I heard coming out of the Midwest is how historic the arctic outbreak in February was and that was what brought our winter back after the January thaw, Over here in NYC we were below normal all three winter months (and March too) I was surprised to see it was only a little below normal with temperatures.
It seems that here in the NE our snowfall is more dependent on storm track and less on temperatures. Even here in the southernmost part of the NE. And that's what most winter lovers care about.
1995-96 was a colder than avg winter in the midwest, but nothing noteworthy (at least here) outside of the early February cold snap, which still paled in comparisons to multiple cold snaps since then. That cold snap was noteworthy in chicago and Detroit in that it came with bare ground. One of my least favorite winters here in terms of missing all the action. Cold and dry ruled, and Detroit has easily never come as close to getting screwed in the 29 years since.
1995-96 ranks as detroits 44th coldest (of 151 years) winter on record. Since then, the following winters have been colder:
2000-01
2002-03
2008-09
2010-11
2013-14
2014-15-
1
-
-
53 minutes ago, bluewave said:
The bar naturally gets lower when discussing how cold it feels since recent winters have been warming so fast. This winter was actually cold in some regions during January and February. But overall it was a pretty mild winter collectively across the entire CONUS. Since the geographic footprint of the Arctic air coverage has been shrinking over the years. So it’s harder for a cold month in one geographic region to be expansive enough to be a cold one in another region.
But what I'm saying is noting how cold or warm the conus is is totally irrelevant to how someone perceived their winter any individual location. It goes without saying that how cold anyone felt their winter was at their location is best gauged by how it compares to their climate record and their recent winters, not the CONUS. A cold winter by new york city 1951-80 standards would still be a mild winter in Detroit by 1991-20 standards. To say nothing of the recent cold winters in already cold upper midwest/plains and the warmth in already warm snowless places like Florida and Arizona.
-
1 hour ago, LibertyBell said:
NOAA uses 1951-80 as an established baseline to compare future climate trends.
In other words, that's considered the *normal* climate (for better or worse, but we have to start somewhere.)
Never knew that. Seems odd to me. That's a colder and less snowy climate for me then todays 1991-2020.
-
1
-
-
1 hour ago, chubbs said:
The Metro airport obs only go back to 1958. Prior data probably isn't representative of the airport.
Most climate site deals with moves over the course of the climate period. Just one of those things in the climate record. Roads were dirt in the 1870s. DTW airport had much better radiational cooling in the 1960s-80s before the airport expanded to its current status. You just have to deal with the changes as part of the climate record, rather than pick and choose the ones we like and don't like.
-
3 hours ago, bluewave said:
The actual temperature rankings for the entire CONUS finished the winter on the warmer side since 1895. Since recent winters were so much warmer, this winter felt very cold in comparison. The CONUS had 6 winters since 15-16 finish within the top 22 warmest of all winters. But the last time the CONUS had a 22nd coldest winter was back in 09-10. Have to go back to the late 70s for a top 10 coldest winter. So you can see how using departures in a rapidly warming climate fails to provide an accurate perspective.
December 24…..4th warmest
January 25………33rd coldest
February 25……..48th warmest
DJF 24-25……….27th warmest
23-24…..1st warmest winter
15-16….. 2nd warmest winter
19-20…..7th warmest winter
16-17…..9th warmest winter
22-23…18th warmest winter
21-22….21st warmest winter
78-79…..1st coldest winter
77-78…..7th coldest winter
76-77…..12th coldest winter
83-84…..18th coldest winter
84-85…..20th coldest winter
09-10….22nd coldest winter

Just to add, when you say "it feels colder because..." and then talk about CONUS ranks that cancels each other out. An individual experiences winter at their location only, not the entire CONUS. If someone experienced a cold winter in Montana they couldn't care less it was a warm winter in Arizona, and vice versa.
-
1 hour ago, Sciascia said:
Confirmed.
Wow. How close are you to RFD? I see RFD is only at 13.0" so I assume this is biggest event of the season?
-
The NWS/Weather Bureau has been using 30 year averages since the 1930s, nearly 100 years. It's a way to capture recent trends in weather patterns for any one area. It doesn't erase the past data, but it's updated every 10 years to reflect those trends.
So I see no reason why some are against using the current normals. I mean, if you want to use entire period of record, that's cool too. But let's not use the 30 year normals until the unusually cold 1960s and 1970s are erased then suddenly stop so we don't captured the mild winters of the mid 20th century
.
For Detroit, this winter of 2024-25 was:
-0.9° using 1991-2020 avg
-0.2° using 1981-2010 avg
+0.7° using 1971-2000 avg
+1.8° using 1961-1990 avg
+1.1° using 1951-1980 avg
+0.3° using 1941-1970 avg
-0.4° using 1931-1960 avg
-0.1° using 1921-1950 avg
+0.7° using 1911-1940 avg
+1.7° using 1901-1930 avg+0.5° using POR 1874-2025 avg
.png.c9c7ca1b3ad03736cade59f1e7d72fc9.png)

March 2025 General Discussion
in Lakes/Ohio Valley
Posted
Quite a turn around in Omaha. No big amounts, but multiple storms. They were sitting at an incredible 1.0" season to date thru February 10th, and they are now at 13.4" before whatever they get today.
Although, I cant figure out what the other 2 blizzard warnings were besides today and March 4th. Since they are prone to crazy windstorms and blizzards in the plains, seems like the NWS's out there sometimes overdue blizzard warnings (in terms of how often they verify vs when they are issued).