psuhoffman
-
Posts
27,419 -
Joined
-
Last visited
Content Type
Profiles
Blogs
Forums
American Weather
Media Demo
Store
Gallery
Everything posted by psuhoffman
-
Hybrid imo. Definitely not Miller A but there is some stj play and the initial system coming from our west isn’t purely northern stream. Maybe I’ll add something on A/B/hybrid to the snow climo thread later since this keeps coming up.
-
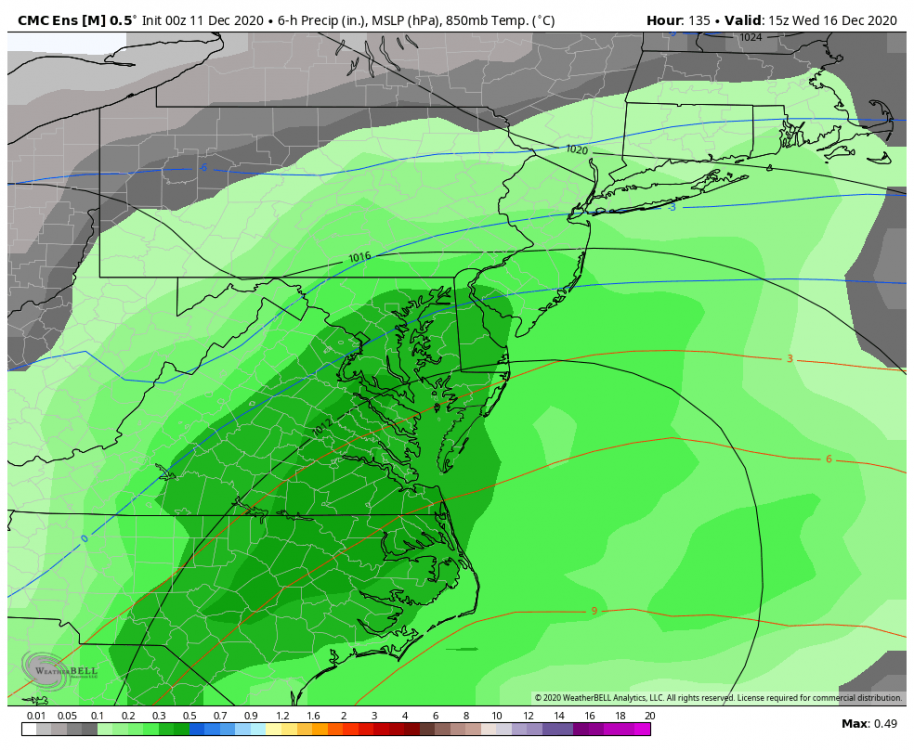
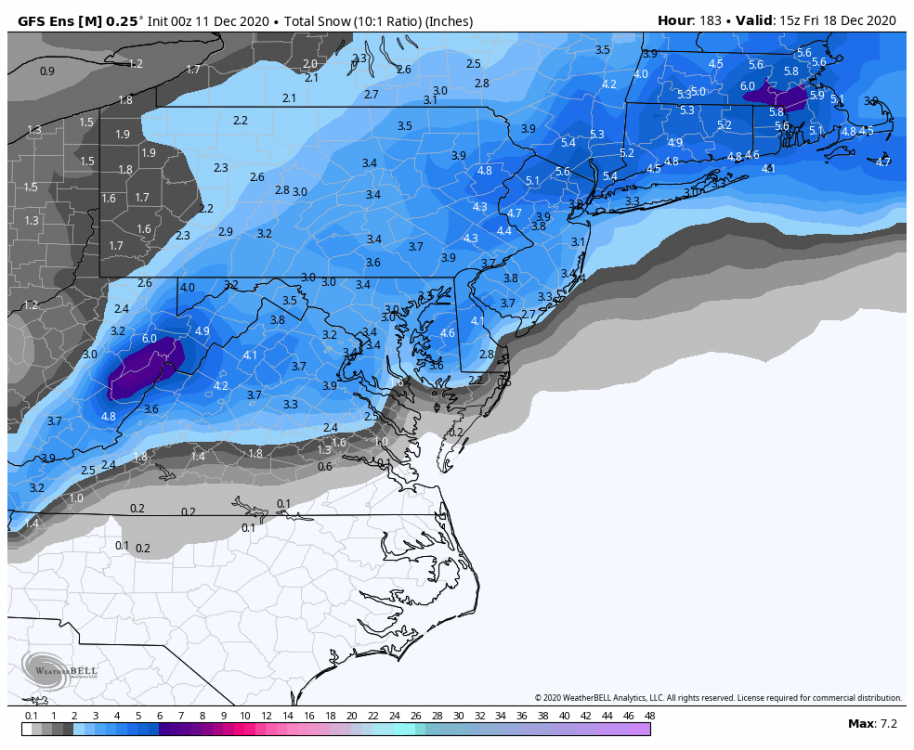
Gefs looked much better than the op
-
Especially NW of 95...


-
How come all the other guidance they continue to release faster but the euro stays 1am. The gap is crazy now. At least years ago we had the ggem/gefs and various other “guidance of the hour” crap coming out between the Gfs and euro. Now everything else is done by 11:45 and it’s a crazy wait. ETA: I am not waiting up. If I happen to wake up fine otherwise it will look the same at 7am as it does at 1am
-
UKMET???
-
You really think you’re going to change his mind
-
We should have a cage match between @Ji and @DTWXRISK to settle this.
-
-
Gefs

-
I just had an idea...
-
You reaping by zoom?
-
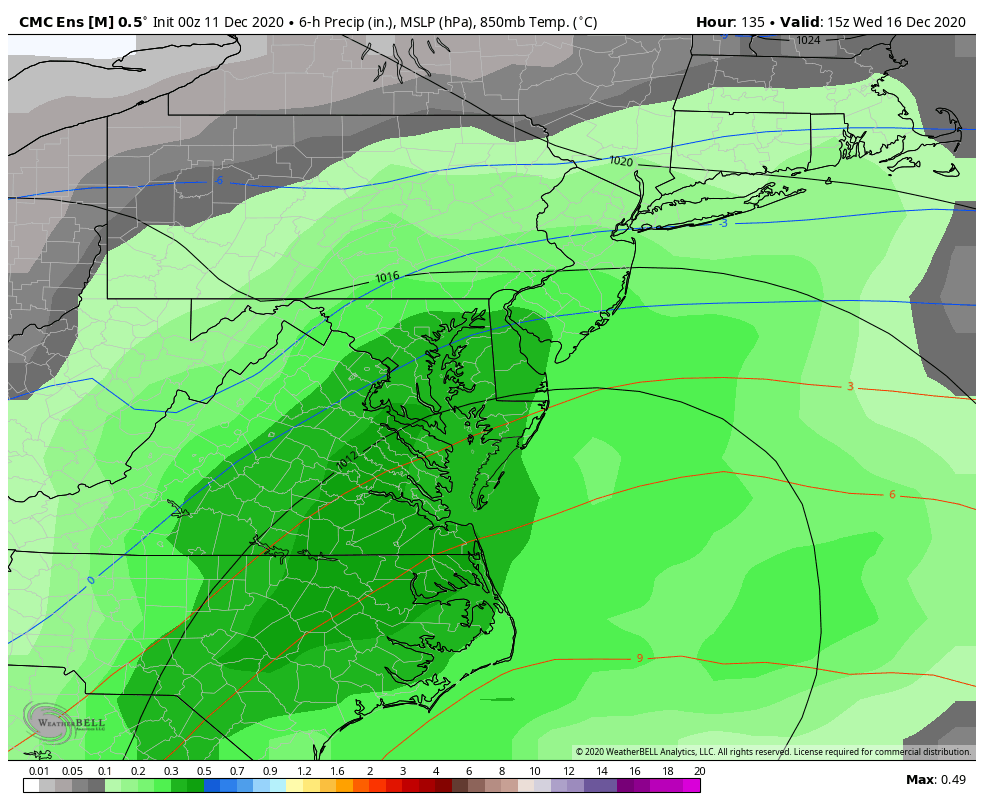
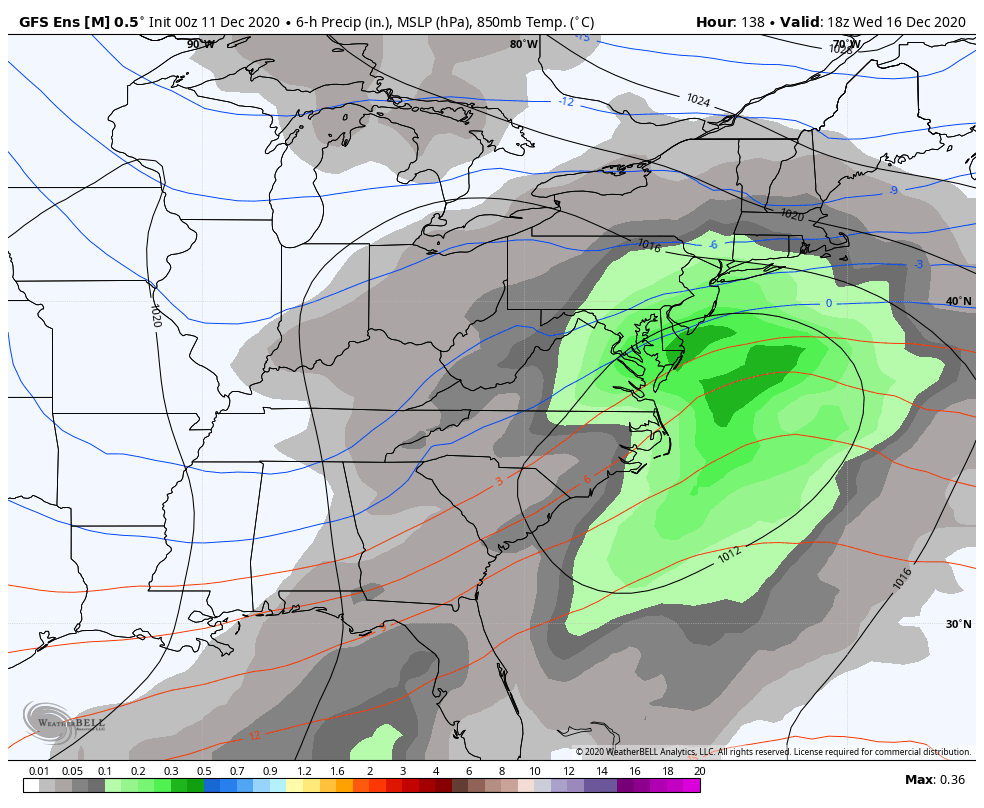
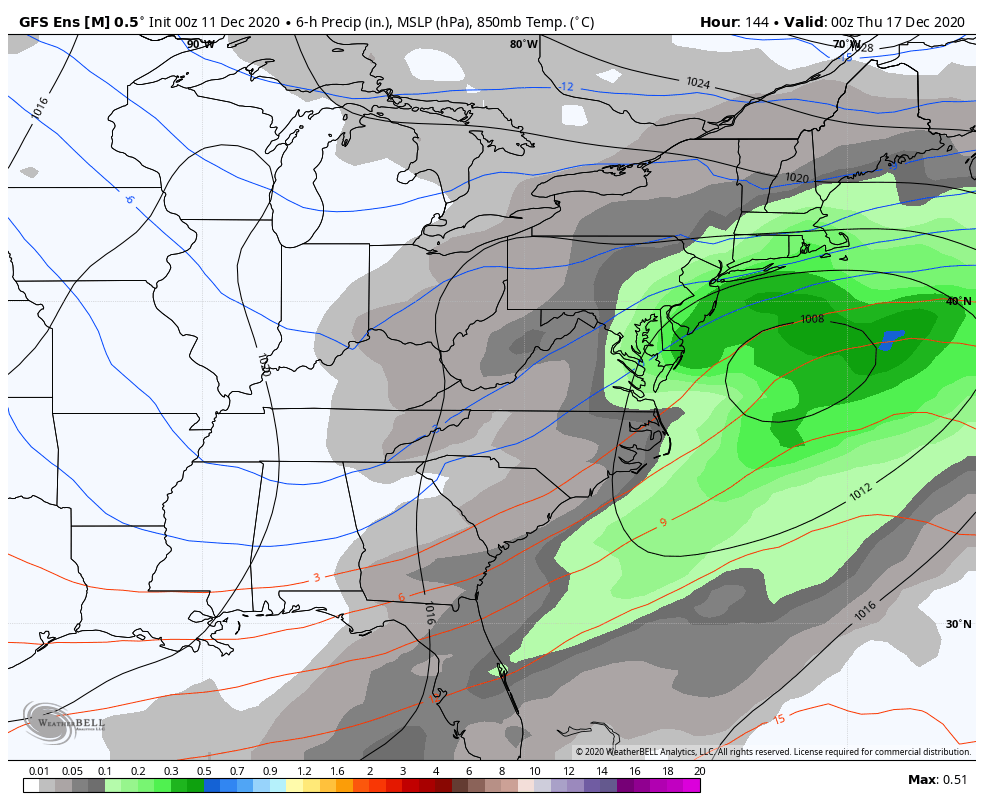
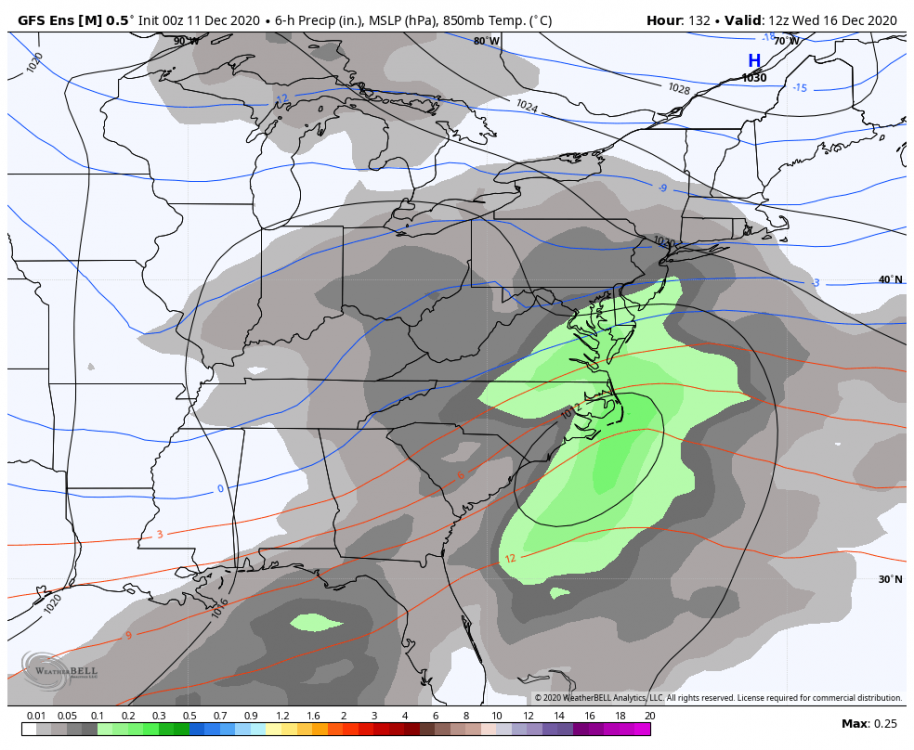
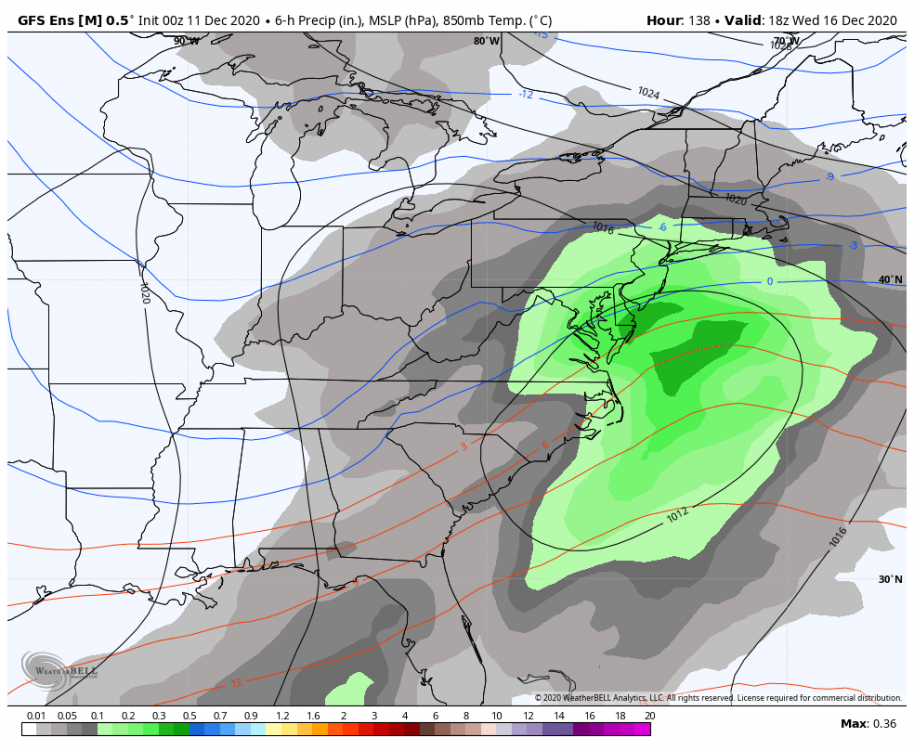
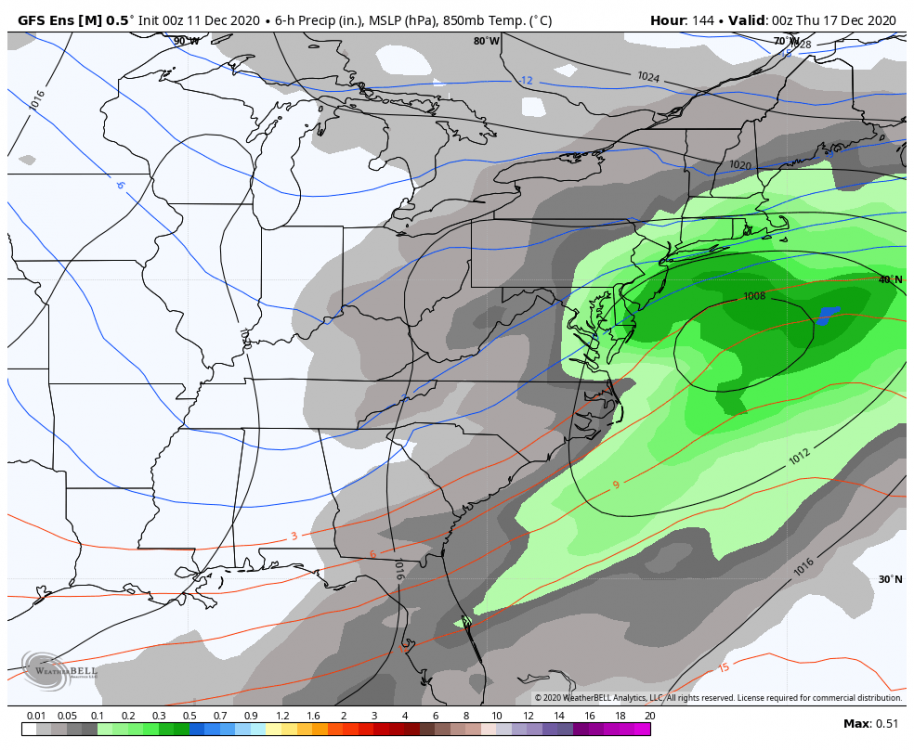
Precip updated. Gefs is a significant improvement over 18/12z. I could tell from the h5 and slp.
-
The TPV pulls west and the next trough dives in too far west so even with a -AO/NAO that’s not so good unless it’s 2010 level blocking. But the guidance was doing that for this week not long ago and you were whining that the storms were tracking now were cutters. So...
-
You love posting the panel right after the one we need
-
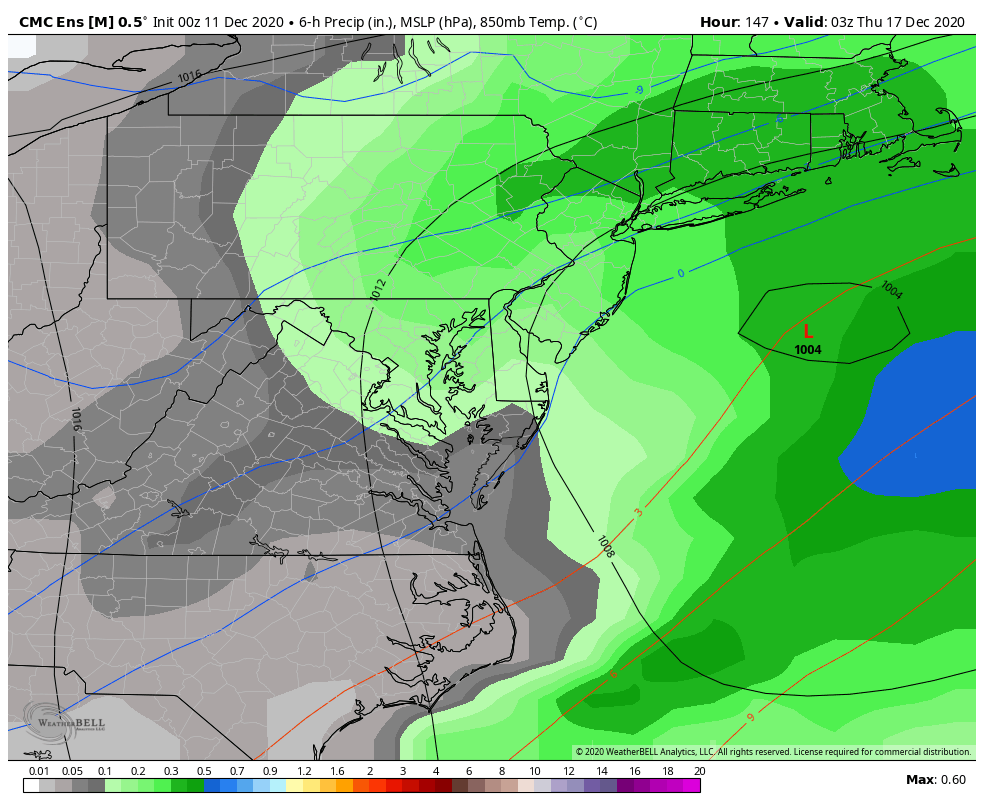
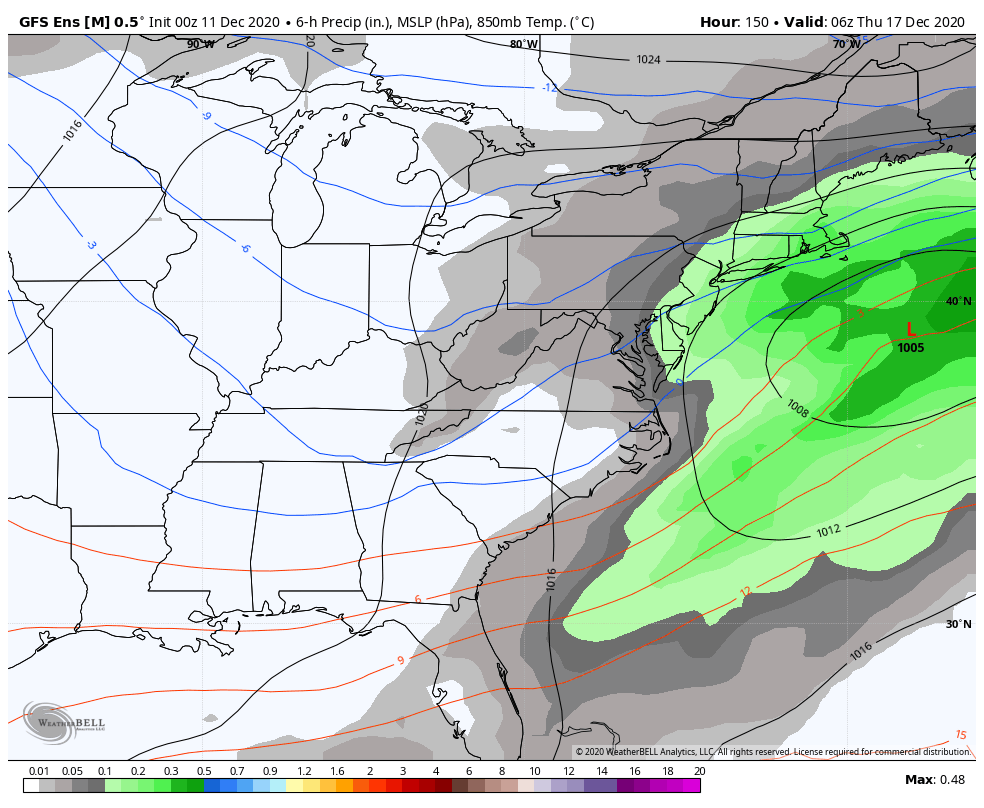
I like the look to the slp on the gefs.
-
Yea the better runs have a lot more stj involvement. There was almost none this run.
-
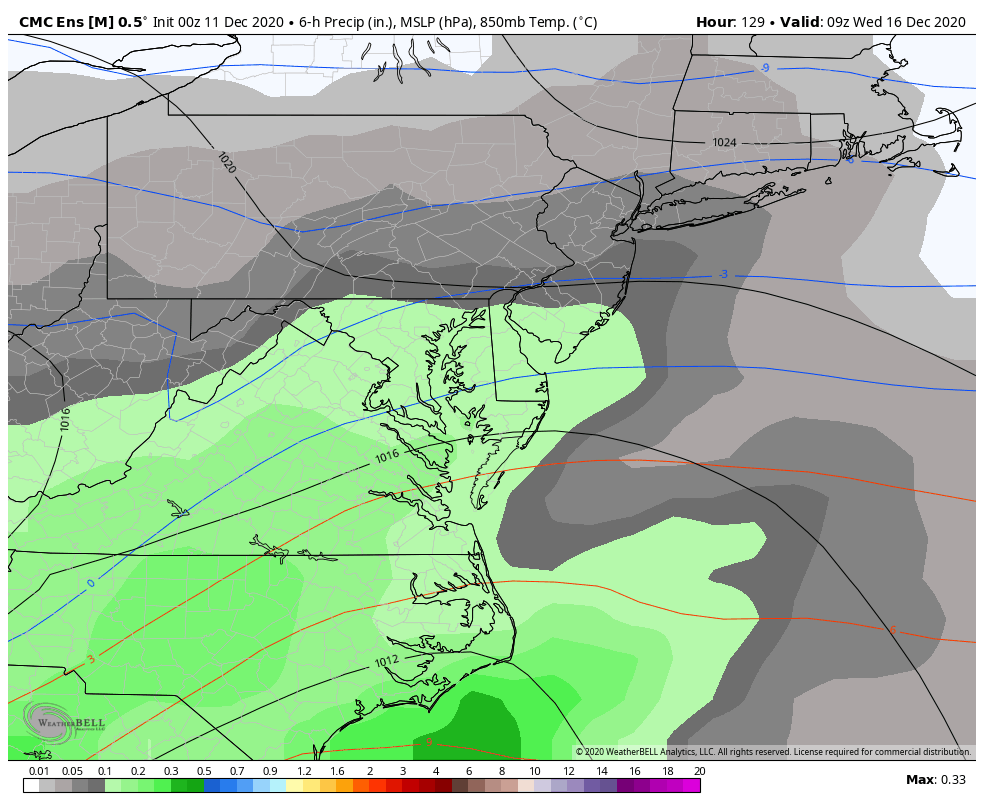
Imo the issue on the GFS...it’s fine through 120 then then it transfers but instead of amplifying and pulling the upper feature in the coastal escapes and the upper level support washes out. The storm never really amplified even to our northeast. Put simply it flubs the handoff.
-
I doubt we should expect the Gfs to handle that perfectly at this range anyways. It’s trending better with the things that matter most. I agree.
-
My bad. 12z. Didn’t realize because I had never looked at it. That should tell you what I think of it.
-
He was talking about Jan 1996
-
One of the oddities of that storm was how the pacific and the blocking played off each other. Like I said earlier everything depends on so many variables. The pac was a mess. Deep Trough in AK and crashing into the west coast. Normally anything would have cut. But there was the most ridiculous block, centered right near Baffin with a ginormous 50/50 stuck under it at the same time. So all it did was take all the Nino STJ and direct it straight up into a massive wall of confluence. Take away the Uber blocking and that pac configuration wouldn’t work. Put a pna ridge and that confluence probably suppresses anything that has to develop with a further east trough axis. That was a combination of factors that only worked in conjunction with each other.
-
We’re on the same page. And 24 hours before Bob Ryan will interrupt the 11pm news to say this is gonna be big!
-
Jan 7. Should start in northern VA with pixie dust around 10PM temp near 18*. About a foot by morning. Some dry slotting during the day before a killer deform finish the next night. About 24” at Dulles. ~30 by you.
-
Great city not just for snow
-
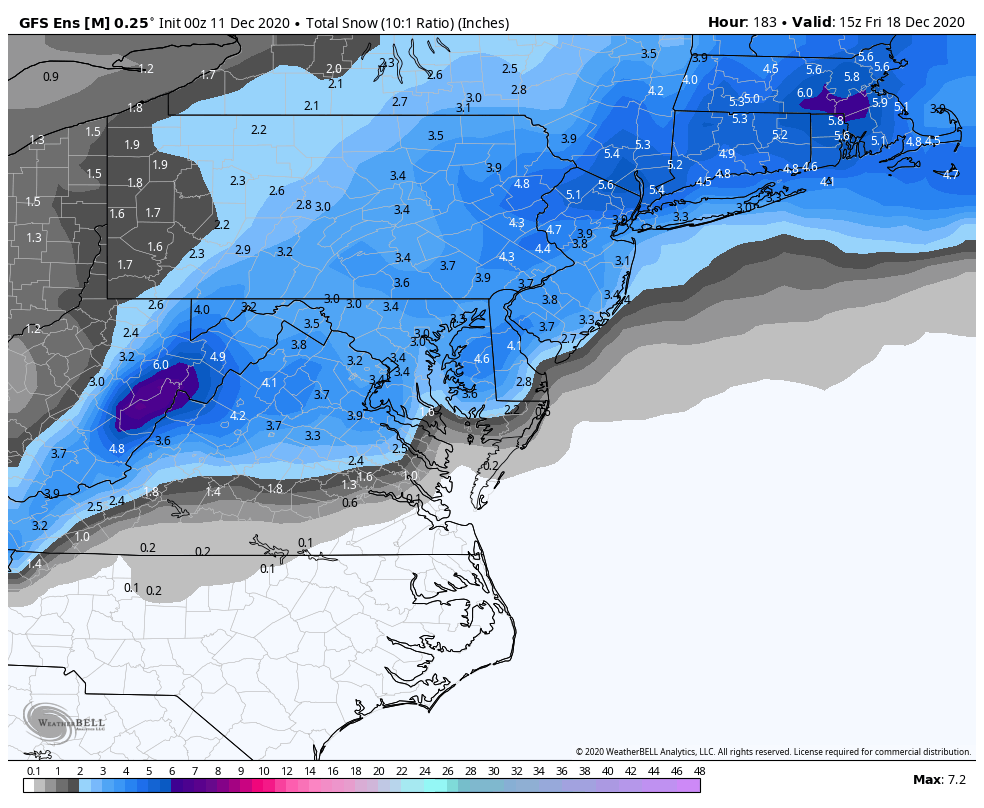
Depends. There wasn’t much correlation on the GEFS members between the two systems. I checked. There is enough separation (as of now). I think the mid week threat is more dependent on the high/confluence and the interaction of the STJ with the NS.