

psuhoffman
-
Posts
27,419 -
Joined
-
Last visited
Content Type
Profiles
Blogs
Forums
American Weather
Media Demo
Store
Gallery
Everything posted by psuhoffman
-

Feb Long Range Discussion (Day 3 and beyond) - MERGED
psuhoffman replied to WinterWxLuvr's topic in Mid Atlantic
12z EPS is a thing of beauty day 10-15! 2 clear strong signals and setting up another just after day 15. The potential is not a long range figment. It’s a result of the pattern the front 10 days simply progressing. This (day 1-10 mean) leads to the threats day 10-15 once cold gets into the pattern. This is a STRONG signal for these leads on an ensemble. day 10/11 Day 13/14 this is more washed out due to timing differences at that range. The pattern is still ripe and setting up another wave at day 15. 24 hours later I see nothing that would make me adjust what I said yesterday wrt how this pattern is likely to progress.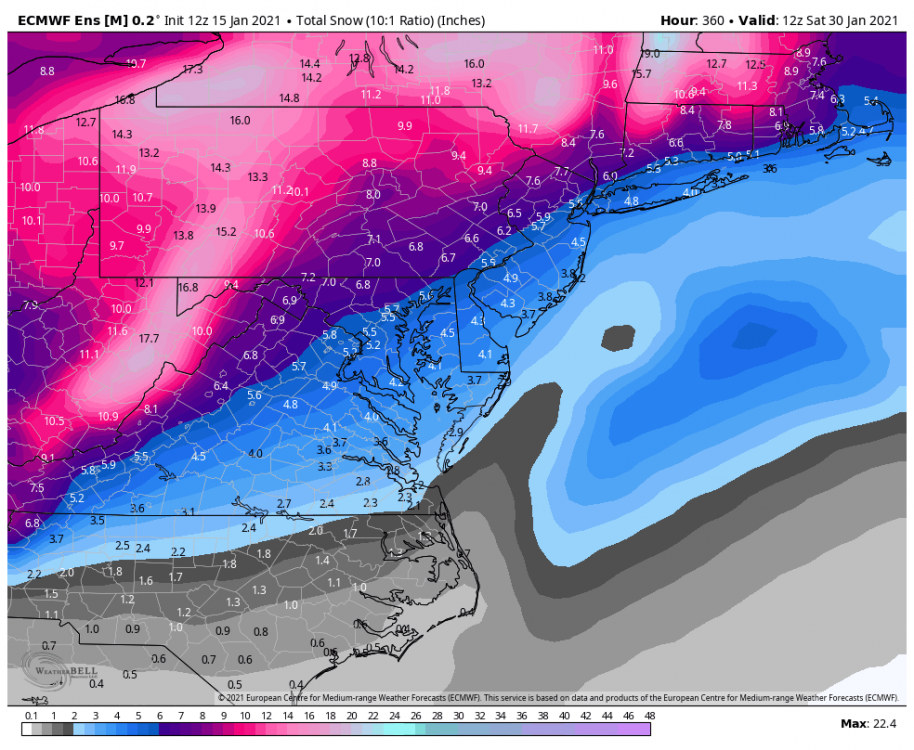
-
Feb Long Range Discussion (Day 3 and beyond) - MERGED
psuhoffman replied to WinterWxLuvr's topic in Mid Atlantic
It was 11 yesterday lol. Honestly though that period between the 24-30 looks really good. I was never invested in the 22. Too many flaws. But if we start to see degradation to the look from the possibly 2/3 waves in the 24-30 time period then I will be more frustrated. That’s been my target and when the progression made sense for a while I’m sticking too it. -
Feb Long Range Discussion (Day 3 and beyond) - MERGED
psuhoffman replied to WinterWxLuvr's topic in Mid Atlantic
-
Feb Long Range Discussion (Day 3 and beyond) - MERGED
psuhoffman replied to WinterWxLuvr's topic in Mid Atlantic
Not kidding...if this ^ doesn’t work...it’s really time to just accept our fate and give up. -
Feb Long Range Discussion (Day 3 and beyond) - MERGED
psuhoffman replied to WinterWxLuvr's topic in Mid Atlantic
Lack of cold means less thermal gradient which means less baroclinic instability or potential energy for storms. What mechanism do waves have to amplify with no boundary? Let’s see what happens with a true tight baroclinic zone for waves to work with. -
Feb Long Range Discussion (Day 3 and beyond) - MERGED
psuhoffman replied to WinterWxLuvr's topic in Mid Atlantic
I will try to be discreet about how I use discrete -
Feb Long Range Discussion (Day 3 and beyond) - MERGED
psuhoffman replied to WinterWxLuvr's topic in Mid Atlantic
@frd @Ji I know this is frustrating but taking a step back to look at the big picture...this was probably the low point in terms of thermal profile in our source regions 2 days ago. Look at our source regions in Canada!!!! It’s near 32 degrees even in Canada at 7am!!! Ugh By day 10 day 15 we have to let this play out. We have not had a pattern with cold available yet. -
Feb Long Range Discussion (Day 3 and beyond) - MERGED
psuhoffman replied to WinterWxLuvr's topic in Mid Atlantic
@Ji the 12z gefs has the best signal for a discreet period (Jan 25-29) that we’ve seen since Dec. -
Feb Long Range Discussion (Day 3 and beyond) - MERGED
psuhoffman replied to WinterWxLuvr's topic in Mid Atlantic
But the wave around the 22nd was a long shot yesterday too. You know that. You’ve pointed out the euro was totally on its own and we knew it would cave. So why the meltdown when exactly what we expected happens? The better threats were always AFTER that. What changed today v yesterday? -
Feb Long Range Discussion (Day 3 and beyond) - MERGED
psuhoffman replied to WinterWxLuvr's topic in Mid Atlantic
Para has a snowstorm day 11. Did I miss something? Today doesn't look bad to me on guidance. So far the GFS/GGEM both have a very healthy wave just south of us around the 24th. Para has a snowstorm around the 26 and the GFS has a hit just beyond that. We have 3 legit opportunities in the pattern coming up and things look just as good today as they did yesterday but everyone is having a melt down. Maybe I missed the memo. -
Feb Long Range Discussion (Day 3 and beyond) - MERGED
psuhoffman replied to WinterWxLuvr's topic in Mid Atlantic
The snow mean day 8-16 looks good but most members get there by 1 hit out of the 3 or so waves in that period. Today’s GFS has 1 hit from the 3rd. Yesterday it had a hit from the second. You are focused on the first wave only. -
Feb Long Range Discussion (Day 3 and beyond) - MERGED
psuhoffman replied to WinterWxLuvr's topic in Mid Atlantic
FWIW I am totally ok with where the threat around the 24th is on guidance right now. -
Feb Long Range Discussion (Day 3 and beyond) - MERGED
psuhoffman replied to WinterWxLuvr's topic in Mid Atlantic
But what if the pac isn't fixable...some of us are focused on ways to work AROUND the pac...because that jet isn't going anywhere...its been a non stop thing for 5 years! So we can either try to work around it or just give up! -
Feb Long Range Discussion (Day 3 and beyond) - MERGED
psuhoffman replied to WinterWxLuvr's topic in Mid Atlantic
two things can be true...Your point is totally correct. But his general pattern comparison is true also...January 2010 didn't do much for many despite good blocking throughout. And since the little bit of snow we got before the Jan 30 storm was VERY marginal...we could make the argument this January is a 2021 adjusted version of 2010. It's not a perfect comp but I think both of you are making true statements. -
Feb Long Range Discussion (Day 3 and beyond) - MERGED
psuhoffman replied to WinterWxLuvr's topic in Mid Atlantic
True but.... one of those events was a clipper, and the other 2 were highly marginal temp events. Clippers are increasingly rare lately. The enhanced pac jet likely has a part in that. Clippers were often pretty discreet waves to begin with...barely amplified enough to produce. The raging pac jet is making it difficult for even pretty major NS features to amplify and phase...let along those discreet waves. I think there is some linkage there. Besides a clipper is a pretty random fluke thing anyways. And we can debate how much of this is a residual effect after the 2016 super nino (although you would think that would have worn off by now especially after 2 cold enso years following it) or how much might be a more permanent issue (no I don't want to start a climate civil war here) but the fact is the base state of north america has been a TORCH since 2016 and marginal events from 10 years ago probably would just be cold rain now. We have all observed the dearth of "minor snow events" lately and there is a really simply logical reason...most of those were marginal to begin with...so what happens if you add a few degrees to those "marginal 10/20 years ago" events? I'll tell you..exactly what we saw...perfect track cold rain. So that storm around New Years where you got some freezing rain...and the one right after where we had a perfect track system and got cold rain...those were the minor marginal events 10/20 years ago. But that doesn't mean we cant snow. But something that BARELY worked 10 years ago likely isn't going to now. So there could be some pattern progression similarities...but you have to adjust for today's base state (temporary or permanent not having that discussion). -
Feb Long Range Discussion (Day 3 and beyond) - MERGED
psuhoffman replied to WinterWxLuvr's topic in Mid Atlantic
I see mixed signals for Feb. Tropical convection (if you extrapolate) isn’t ideal but it isn’t in the worst spot either and it’s been a muted driver so far. I also find it odd that some who dismiss a good look on guidance say 10-15 totally accept a bad look day 25 lol. Some people keep misidentifying normal reversion towards mean at long leads as a sign the -AO/NAO is breaking down. That’s been going on since December. Even now after hints it was breaking long range earlier this week there are signs on the eps and geps that blocking reloads AGAIN into Feb after this retrograding block episode. GEFS is neutral. It lingers the -AO/NAO. I kind of favor a continued high latitude blocking regime. There was another PV split yesterday! The effects of the original SSW event are just coupling with the tpv now. And there are hints at further strat weakening next week. This has the feel of a full season -AO year. That said other factors could continue to mute its effectiveness at delivering cold/snow. But if a decent but flawed pattern is ever going to work February is the time. The picture is murky Imo. Definitive calls for February seem premature. -
Feb Long Range Discussion (Day 3 and beyond) - MERGED
psuhoffman replied to WinterWxLuvr's topic in Mid Atlantic
If a Rex block retrograding from Greenland to Baffin along with a -epo doesn’t work then frankly I’m out of ideas how to countermand the pac jet. -
Feb Long Range Discussion (Day 3 and beyond) - MERGED
psuhoffman replied to WinterWxLuvr's topic in Mid Atlantic
What makes you so sure tropical convection centers near the MC in Feb? Most evidence I see has the most dominant signal in the western pacific. Not as far east as ideal (probably more phase 6/7) but not as hostile as the MC. That and the MJO has been a non factor so far. -
Feb Long Range Discussion (Day 3 and beyond) - MERGED
psuhoffman replied to WinterWxLuvr's topic in Mid Atlantic
There is kinda a catch 22 with that first wave. There isn’t much cold in front. So if it’s not suppressed and it pumps any ridge and rides the boundary it goes north of us. But if it is suppressed it gets squashed. Not saying it can’t be a hit but it’s a very delicate balance because there isn’t enough cold in place ahead of the wave. This isn’t an amplifying coastal type setup. For a west to east boundary wave to work it’s much easier with good cold in front. Let’s see what the eps has to say about the 10-15 period. 12z eps liked it and gefs really hit that time 18z and again 0z. Gefs 5 day mean day 10-15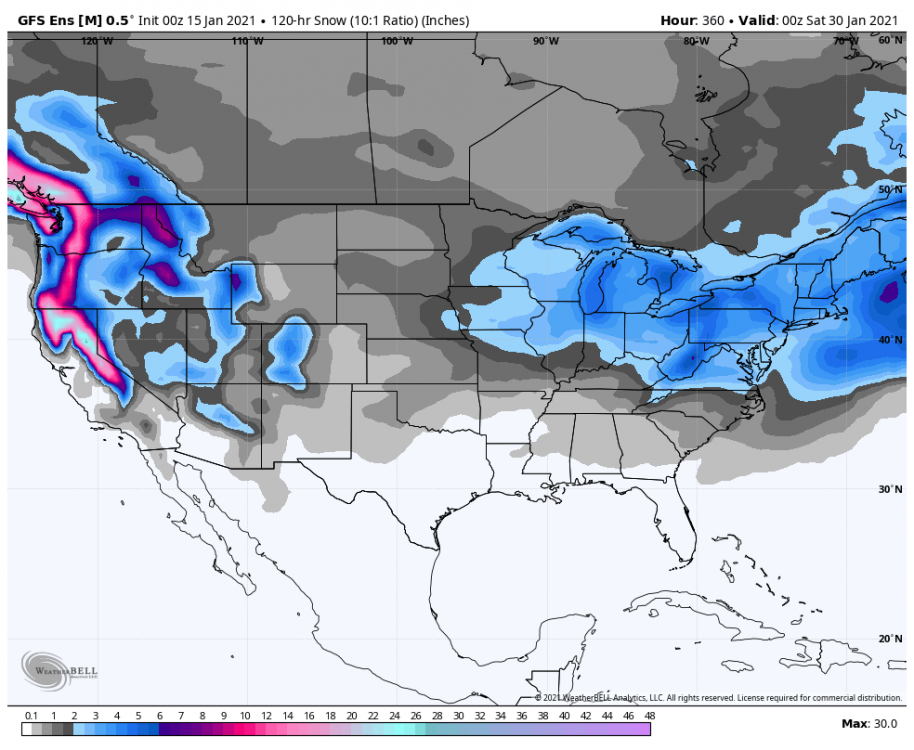
-
Feb Long Range Discussion (Day 3 and beyond) - MERGED
psuhoffman replied to WinterWxLuvr's topic in Mid Atlantic
well...those that wanted cold check out the Para. Not a drop or flake of any precip after tomorrow...dry as a bone for 15 days...but damn cold lol. WAY too much of a good thing. Huge block but develops a TPV vortex just to our northeast under the block and it sits there forever just squashing everything. Nothing even comes close...not even NC...its too suppressed for anything to get east of the MS. Now that would be an epic way to fail after we couldn't buy any cold air the first 6 weeks of winter...to waste a block because its too cold. -
Feb Long Range Discussion (Day 3 and beyond) - MERGED
psuhoffman replied to WinterWxLuvr's topic in Mid Atlantic
I get the frustration...but we have had some hits mixed in lately...the euro snowed on us like 4 straight runs actually. The GFS and para had a few runs with a hit day 10-15 and the ICON just had some snow. We just have not had any consistency with one of these waves yet...guidance is all over shotgun style on how they play out. I still think the progression favors a further south track after the wave on the 22nd, if there even is a wave on the 22nd. It's possible the southern wave shears out and the northern wave stays to our north...and its not much of anything. That is one option because there is so much ridging in front...but then with a sudden wall in the way from the blocking. If you really want to look for something "exciting" I have noticed the trough in the west continues to retrograde, in response to the pac ridge retrogression...and by around day 15 its SOOOOO close to pulling back enough to really dump a huge trough into the east under the block. And this time because there is a ridge in the WPO not a long trough across the whole north pacific...there wouldn't be a raging pac jet blasting into north america. Imagine...a poleward ridge west of alaska to get cold into N America...then a trough off the west coast to get a PNA ridge...then huge trough under the block in the east...going into February. Might as well dream big right? This crap has to end sometime...why not end with a bang. -
Feb Long Range Discussion (Day 3 and beyond) - MERGED
psuhoffman replied to WinterWxLuvr's topic in Mid Atlantic
Give it a few days. It will be a deep south storm Every wave we are tracking is still 7+ days away... a range where there will be significant changes on every op run. But you are tracking them like every little detail on the run is live or die as if its 24 hours away. That very first wave around the 22nd is maybe a day or so away from getting to a range where we might start to get some clarity. But I was never that optimistic on that one anyways. But you would do better to let the full run's come in and then just get a sense for overall trends based on the ensembles rather then getting twisted around by the flip flops of each op run. -
Feb Long Range Discussion (Day 3 and beyond) - MERGED
psuhoffman replied to WinterWxLuvr's topic in Mid Atlantic
Given where the block is by then...I would worry more about suppressed then a cutter like the GFS shows. -
Feb Long Range Discussion (Day 3 and beyond) - MERGED
psuhoffman replied to WinterWxLuvr's topic in Mid Atlantic
The indexes don’t mean much in March with short wavelengths ETA: they do if you want a sustained pattern like March 1960 or 2018 but a fluke storm can happen in almost any pattern the way waves can dig and cut off that time of year. -
Feb Long Range Discussion (Day 3 and beyond) - MERGED
psuhoffman replied to WinterWxLuvr's topic in Mid Atlantic
I like their apple pie


