

TheClimateChanger
-
Posts
1,882 -
Joined
-
Last visited
Content Type
Profiles
Blogs
Forums
American Weather
Media Demo
Store
Gallery
Posts posted by TheClimateChanger
-
-
12 hours ago, Torchageddon said:
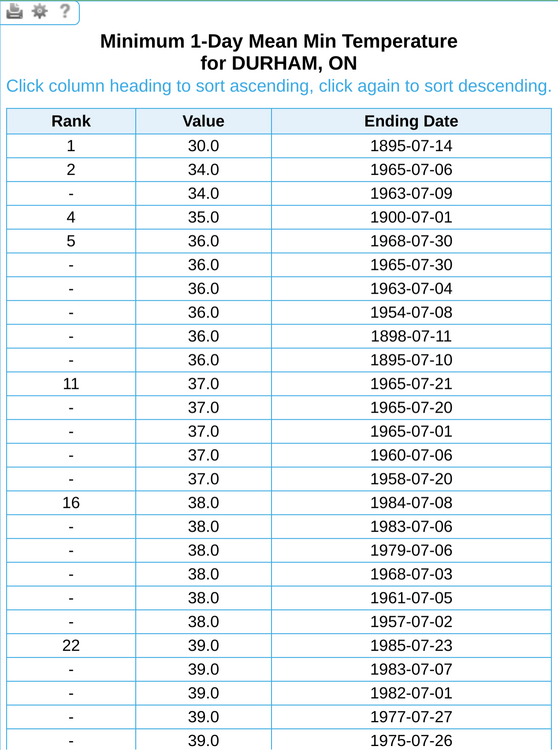
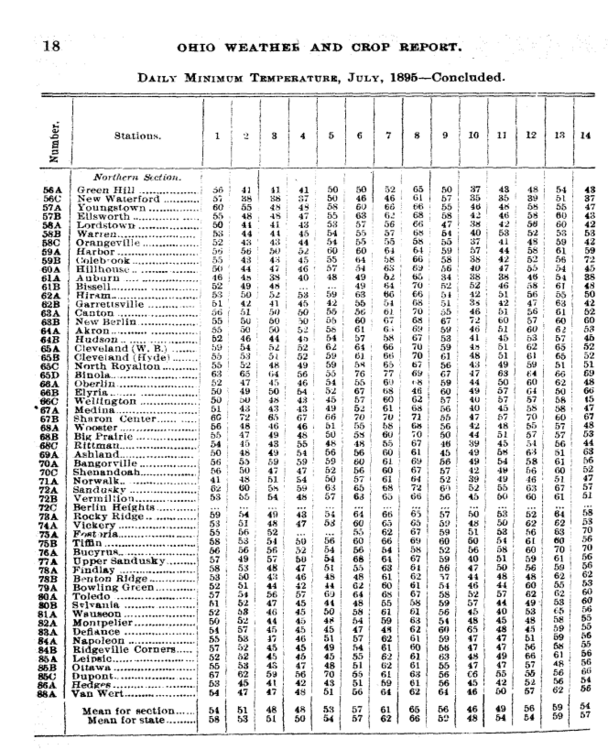
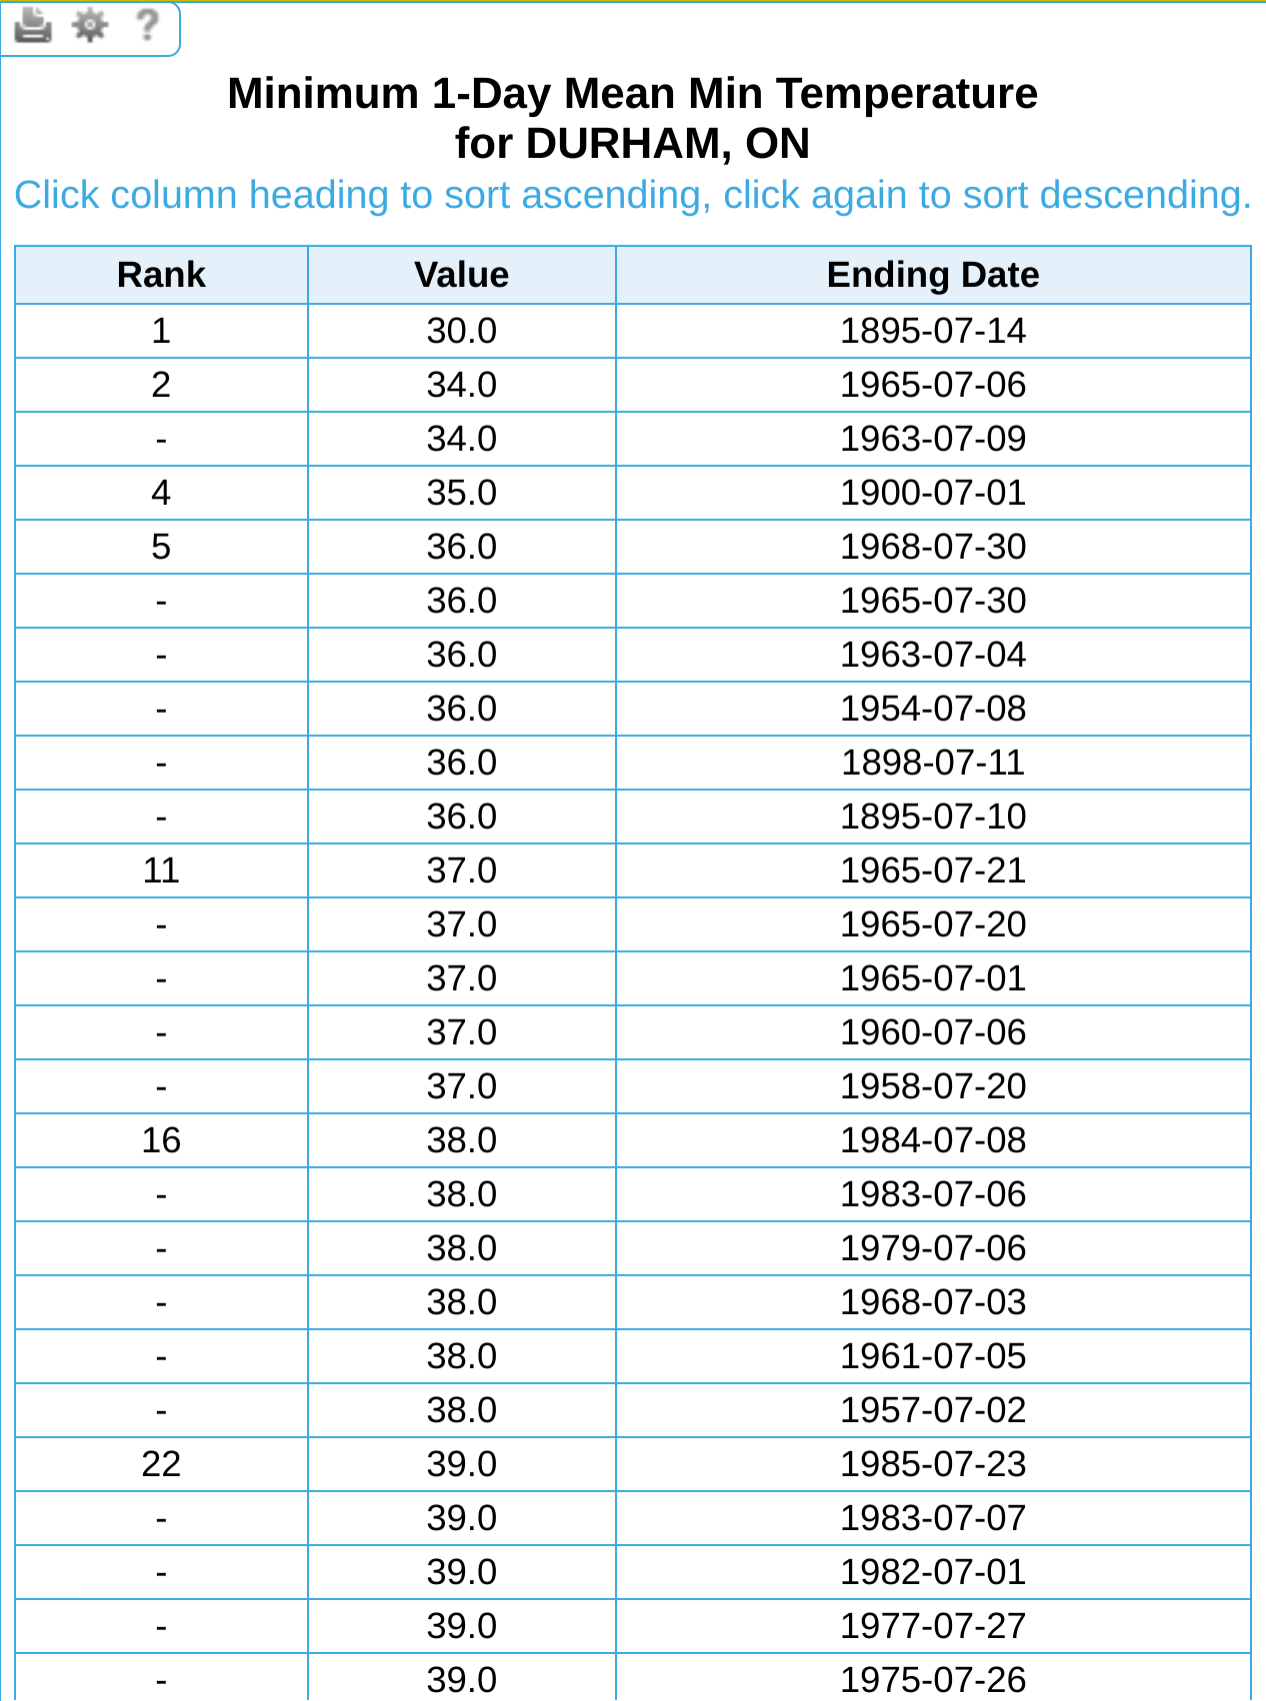
Ohio is further south but those minimums don't seem so crazy to me, what makes me think the 30F is an error is that the next record low for July is 34F tied and were both in the 1960s. If 30F was reached on July 14 1895 then something extraordinary in the records would be present like the airmass or something that could bottom out temps. The frosts were light in OH so above 32F we can surmise.
I couldn't find the raw data from where this was sourced. Environment Canada has the information uploaded, and also shows a subfreezing low on the 14th (-1.1C). A copy of the original record would probably help, as you'd be able to see whether an error was made in transcription. And the observer might have noted the frost or freeze if it occurred. However, it does not look like Environment Canada has these records readily available for download like NCDC.
Looking at surrounding stations, it appears it was a cold morning as there were several reporting lows in the upper 30s to around 40. Not sure if this site was particularly good at radiational cooling, but could be a transcription error (like maybe it was written as 36 or 38, but difficult to decipher).
-
 1
1
-
-
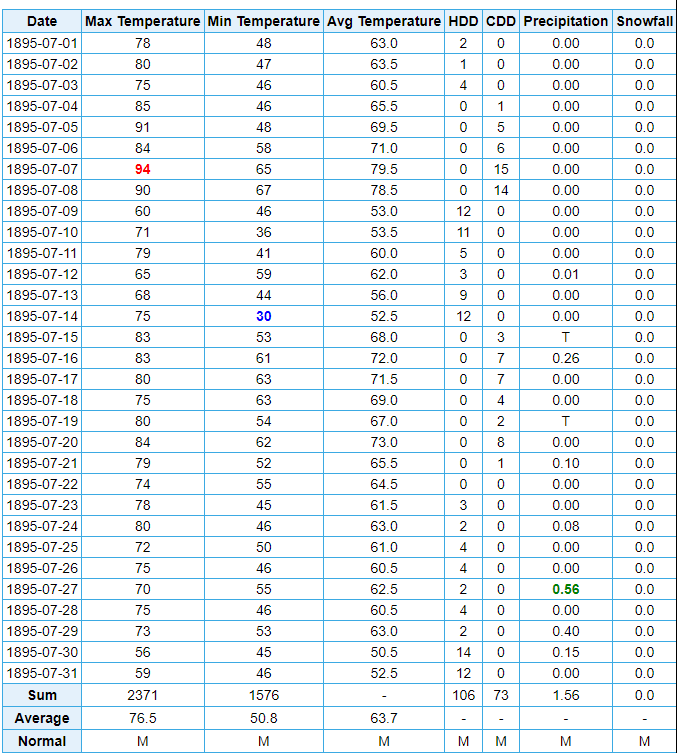
Here was Durham, Ontario, in July 1895:

-
On 6/11/2022 at 10:15 PM, Torchageddon said:
I was using that awesome site Hoosier gave me to look at extremes like mins and maxs in ON and I think I caught an error since there is no way Durham made it below 0 on July 14, even if it was 1895:
I checked another station as close as possible (too bad many don't have 1895 records) to collaborate, and despite being further inland which should help diurnal cooldowns, it wasn't even close to 0 but more like 39F or 4C at Alton's station.
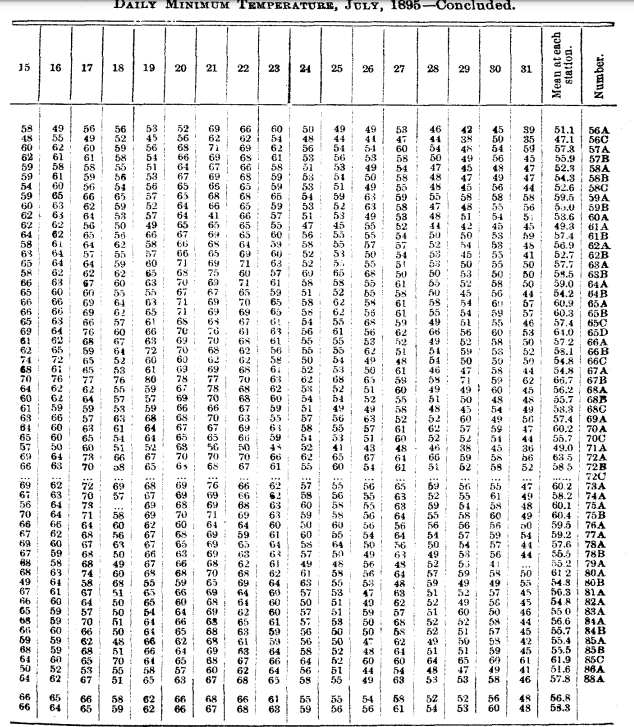
Looks legitimate to me. I think people underestimate how cold it was in the 1800s. Some of the temperatures would be unfathomable today. This is July 1895 roundup for northern Ohio. New Waterford, Ohio had lows of 38 on the 3rd, 38 on the 4th, 37 on the 5th, 35th on the 10th, 35 on the 11th, 39 on the 12th, 37 on the 14th, 38 on the 29th, and 35 on the 31st. The mean low temperature for the month was 47.1F. It's rare just to fall below 50F these days anywhere in the State of Ohio during July. Having a monthly mean low temperature anywhere in the State of Ohio would be unfathomable.
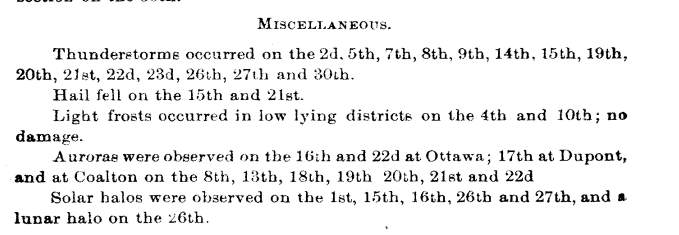
In addition, there were two other sites with mean lows in the 40s... Auburn (49.3F) and Norwalk (49.0F). The coldest low that month was 34F in Auburn on the 9th, but it looks like there low temperatures were shifted forward one day (i.e., the following morning low attributed to the prior day) as that reading is in line with the lows on the 10th, where there widespread low to mid 40s and several 30s. Frosts were recorded on the 4th and 10th that month in parts of the State.
-
On 6/1/2022 at 2:40 AM, Spartman said:
89'd after being stuck at 88 for several hours this afternoon. Highest we'll see for at least the next few weeks.
94F, with a heat index of 107F at Dayton, after a high of 91F yesterday. Looks like a couple more days in the mid 90s this week, with heat indices well in excess of 100F at times.
-
 2
2
-
-
1 hour ago, Ahoff said:
That's going to be some nasty humidity.
It's coming. Heat index up to 113F at the John Glenn International Airport in Columbus, Ohio. Crazy gradient there in central and southeast Ohio along I-70. The current heat index in Zanesville, Ohio, 50 minutes from the airport, is 80F.
-
Just to illustrate this. The KPIT ASOS is at 40.5N, 80.27W. Here's the temperature at that gridpoint when it's printing the 97 in Pittsburgh.

-
1 hour ago, TimB said:
12z HRRR has us getting to 97 tomorrow but first of all, it’s the long range HRRR and second of all, everything else seems to have at least some rain/storms and 90 is indeed a struggle on some models.
One thing to keep in mind is the HRRR is a mesoscale model, so it's designed to take into account small features like elevation changes and urbanization. The 97 shown on the Pivotal maps is centered on downtown. Looks to top out around 94 at the airport, where official records are kept. That's not too unreasonable for a high end estimate, but probably more like 90 or 91, maybe 92, given model consensus.
-
1
-
-
2 minutes ago, Ahoff said:
I can never remember what time of day those time stamps correspond to. What time of day is 12z? I mean it's morning, but what time?
8:00 A.M. EDT / 7:00 A.M. EST. Probably should have shown the prior map at 9Z (5:00 A.M. EDT/4:00 A.M. EST) for a pre-sunrise reading. It was about the same (82F in Pittsburgh).
-
1
-
-
2 minutes ago, TheClimateChanger said:
This would be crazy warm for 12Z. NAM shows mid 90s late Wednesday afternoon ahead of this, but I thought the forecast overnight temperatures Thursday morning were actually more noteworthy...

For context, here are the record warm minimums at Pittsburgh. Every single one of them is from the old downtown station, with the exception of the 78 degree low on July 17, 1990. Of course, if the above map came to fruition, it almost certainly would not hold because there would likely be a rain-cooled low well below that the following evening. Even in the absence of rain, it probably would cool below those levels by 1:00 a.m. EDT. This almost always happens in these situations, but even so I can't ever recall 80+ here in the morning. Usually, its like 75-77 type morning lows that fall to lows in the upper 60s/low 70s due to rain or a cool front passage later in the day.
82 Jul 1, 1901
81 Aug 6, 1918
80 Jul 21, 1930
79 Jul 28, 1901
79 Aug 5, 1918
79 Jul 20, 1930
79 Jul 25, 1934
79 Jul 28, 1901
78 Jun 20, 1924
78 Jul 6, 1911
78 Jul 10, 1881
78 Jul 17, 1990
78 Jul 18, 1887
78 Jul 26, 1892
78 Jul 27 1876
-
This would be crazy warm for 12Z. NAM shows mid 90s late Wednesday afternoon ahead of this, but I thought the forecast overnight temperatures Thursday morning were actually more noteworthy...
-
2 hours ago, Ahoff said:
The weather app is spitting out 94 on Wednesday, even for the airport, lol. It just throws out these wild ass numbers after a model run. Likely will settle around 84 in the end, lol.
I don't know. NWS PBZ seeing the potential for a "few 90 degree days" middle of next week.
.LONG TERM /MONDAY THROUGH THURSDAY/... A pattern shift is then expected next week as persistent upper troughing eventually fills via an amplifying ridge across the southeastern CONUS. Long range solutions indicate potential for 500mb heights ranging between 590-594 dam, which implies the potential for a few 90 degree days by mid week. Meanwhile, with the forecast area on the northern edge of this building ridge, within continued, nwly flow aloft, unsettled conditions should remain possible through at least mid-week with ongoing chances for showers and thunderstorms. -
On 5/18/2022 at 1:20 PM, TheClimateChanger said:
Not sure the KPIT sensor will get there. Can see it stall out at 88, while Syracuse reaches 93.
Nailed it, I think. 84 at KPIT, and 90 in the 'Cuse right now. Looks like these forecast temps should be within about a degree or so of the actual highs.
-
Given it’s currently 67, and it looks clouds and showers are going to be hanging tight for at least a few more hours, even 80 looks questionable despite the long days.
-
1
-
-
On 5/18/2022 at 10:19 AM, Ahoff said:
The Weather Channel likes the chance of records falling this weekend.
Well, the app shows 92 and 94 for downtown Pittsburgh, but only 88 and 91 at Moon Township. Both of which would fall shy of the records of 93 and 92 from the old Weather Bureau office.
-
If it reaches 90 or better tomorrow or Saturday, it would be the fifth earliest year to reach 90+ since records have been kept at KPIT (i.e., dating back to 1953 - records moved to KPIT in September 1952 when the airport opened). Note: Not necessarily fifth earliest reading, since some of the 4 years with earlier 90+ readings may have had more than one such reading (in fact, I know that's the case for 1962).
Should it reach 91 or better, that would be the second earliest such reading. All of the other early 90 degree readings at KPIT were exactly 90 degrees. The only earlier 91+ reading at KPIT was May 18, 1962.
Now, in the off chance it were to reach 92 or better, that would be the first time it's ever been that hot anytime in the month of May at the airport site. Currently, the hottest May reading at KPIT is 91, which was reached once in 1962, 1987, 2011, 2012 and 2018.
-
Not sure the KPIT sensor will get there. Can see it stall out at 88, while Syracuse reaches 93.
-
Looks like it's going to be another tough summer for 90s. I noticed the NWS tweeted the temperature at their office was 82 at 1:49 p.m. The 5-minute average temperature at KPIT at 1:51 p.m., basically centered on the point measurement shared by the NWS, was 80F. I wouldn't expect the NWS office to be two degrees warmer than the airport, being just about a mile away at similar elevation in a shady suburban neighborhood versus an open airport site loaded with asphalt tarmac. Most of our 90s are like 90, 91, so if the ASOS is running a couple degrees too cool, I'd expect a lot of days topping out at 88 or 89 again. Hard to reach 90 if the actually air temperature needs to reach 92 to register that number.
-
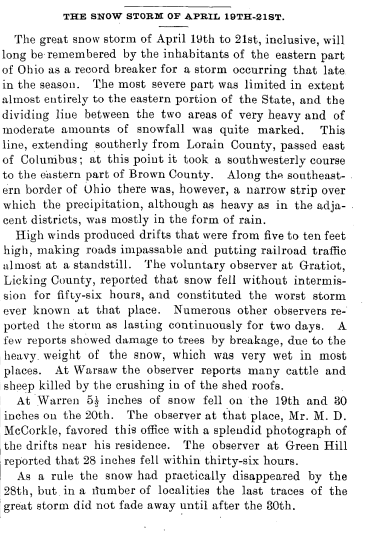
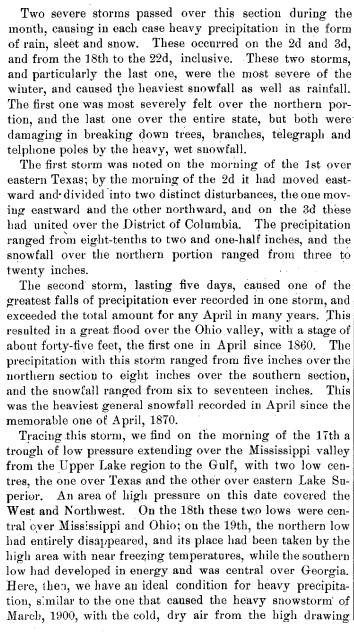
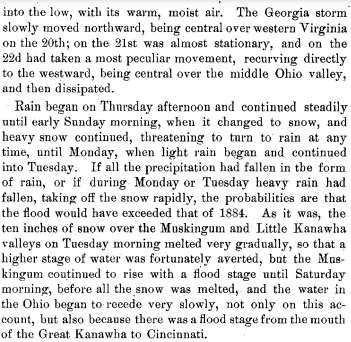
On this date in 1901, the upper Ohio Valley was in the midst of one of the worst, if not the worst snowstorms, on record for the region with storm totals as high as 3 1/2 feet reported in Stark and Licking Counties. Due to the heavy weight of the snow, structural collapses were reported, rail traffic was brought to a standstill and telegraph lines were downed all over the place. The following passages describe the storm - the first from the Ohio Weather Bureau report, and the second from the West Virginia report for context on the storm. Appears northern and southern stream energy phased into a strong storm over Georgia, which tracked slowly north in to western Virginia but ran into a ridge of high pressure and stalled for most of the day, before becoming completely cut off from the flow, retrograding westward into the Ohio Valley, eventually filling and dissipating. There must have been a strong atmospheric river directed from the Atlantic through Pennsylvania and into Ohio and West Virginia and southern New York based on the widespread 3-8" precipitation totals. While the precipitation fell as a cold rain in Pittsburgh, the river crest was one of the top five of the 20th century and unlikely to be exceeded due to flood control measures put in place after the devastating flooding in March 1936. 1901 is the snowiest April on record in Pittsburgh with 13.5" but that was from the earlier storm from the 2nd to 3rd noted in the West Virginia summary. That storm also produced up to 20 or more inches of snow in the higher elevations.
-
1
-
-
This is going to be another cold rain in the 30s, while central and northeast PA get clobbered, isn't it?

-
Just now, KPITSnow said:
Man, two months ago this would have been a nice thump.
Yeah, we can't win around here. In the wintertime, it's often below or near freezing but rain or wintry mix due to warm air aloft. In the springtime, its below freezing aloft but just above freezing at the surface so the snow melts in the last couple hundred feet or makes it to the surface and then melts on contact.
-
Looks like it is accumulating at Seven Springs.

-
Just switched over to wet snow here over the last 10 or 15 minutes, but it looks like the back edge of the heaviest returns are pushing northward.
-
I should add while the advisory for Tucker County only states up to 4 inches, the official NWS snowfall forecast map does show 6-8 inches in the far eastern parts of the county in the very highest of elevations. But I guess due to the localized nature of the heavier totals, they just stuck to the advisory countywide there.
-
30 minutes ago, TimB said:
Have a feeling models like the HRRR with much more reasonable snow totals in the ridges and basically nothing in the metro area will win out. It’s late April and it’s really hard to get an inch or two of snow this late. This isn’t 4/21/21 with optimal timing and probably isn’t even 4/19/18. Probably more analogous to 4/7/17.
12Z HRRR wasn't too dissimilar. I used the actual modeled ratios for this map, which were less than both the 10:1 and Kuchera maps for the ridges. And less than the 10:1 ratio map, but slightly greater than the Kuchera map for the immediate metro. Pretty much in line with what I said above (which admittedly was more conservative than the NAM 3K since I had looked at the full suite of modeling before posting). Little if any downtown, but does show up to an inch in western Allegheny and up to 2" in northern Allegheny. With again the best chances of 2"+ being from Butler County northeast.
Significantly less for the ridges, but still shows up to a foot in eastern Tucker (the Kuchera and 10:1 maps both showed up to 14" in eastern Tucker).


Spring/Summer 2022 Complaint/Banter Hangout
in Lakes/Ohio Valley
Posted
Yes, looks much drier and it appears there was a drought that summer. Looks like a lot of places had diurnal ranges near or even in excess of 30F. The climate seems much too humid and wet to achieve that today. 1988 was somewhat similar, but much hotter in general.