

TheClimateChanger
-
Posts
1,996 -
Joined
-
Last visited
Content Type
Profiles
Blogs
Forums
American Weather
Media Demo
Store
Gallery
Posts posted by TheClimateChanger
-
-
Anyways, can we lock this in?

-
 1
1
-
-
18 hours ago, TimB said:
In fairness, the cold parts of the pattern this winter (Christmas, early February) did get quite cold, though brief and still pretty snowless, and this is no exception.
There were only 5 colder high temperatures since January 1, that I could find - and none by more than 5 degrees.
27 on the 1-14; 29 on 1-31; 28 on 2-1; 31 on 2-3; and 28 on 3-14. Plus, yesterday's 32F reading wasn't hit until nearly 6 pm, aided by the lengthy daylight. Early afternoon was still in the 20s.
-
1 hour ago, Rd9108 said:
Where the hell was this cold in January and Febuary. It's extremely frigid outside.
Yeah, it is quite cold. My car was reading 25 just now and it’s rather brisk.
-
Not really feeling the snow squall potential out there. Looks more like light snow flurries given the minimal humidity to work with.
-
On 3/10/2023 at 5:08 PM, OHweather said:
Areas where the bulk of the snow occurred during the daylight today mightily struggled...we used fairly low snow ratios to come up with the forecast but it was still way too much snow outside of the higher terrain. Had an inch or so here based on what's left in shaded areas.
I don't know enough about the climate stuff discussed on the prior page off the top of my head to chime in, but will read through it and see if I can come up with anything.
I did a quick "sanity check" of the annual snow numbers - I call it the good, the bad and the ugly.
The good:
CLE's data looks solid. Again ignoring any changes in site location and measuring techniques over time. No missing data with the exception, of course, being this year, which is incomplete.
CAK's data looks solid, with the exception of 1947-1948. Snowfall records do not begin in the threaded record until 1/1/1948, so it's missing everything that fell on or before 12/31/1947. Looking at the recorded precipitation and temperatures, it's clear at least several inches fell in November and December 1947 if measured.
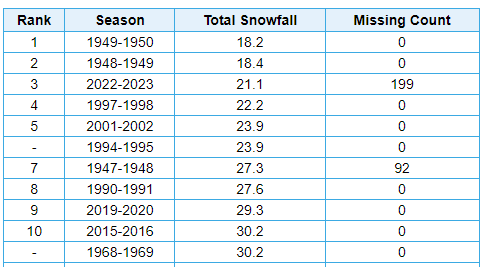
TOL's data looks pretty good, with the exception of 1997-1998. Not sure what was going on there - it was a warm, snow-free winter. But there is a ton of missing data. I know there was a period at a lot of sites in the mid 90s where they did away with snowfall measurements for a few years, not sure if that's the problem here.
As for the other years with missing data, when the missing data is a multiple of 30/31 in the early years of the record, it's usually just warm weather months where nothing was reported being interpreted as missing data. But as in the case noted above, there are circumstances where that might not be the case.
The bad:
Erie's data is mixed. Something weird happened in the 30s and 40s, where a lot of snowfall was observed but not transcribed and shows up as missing data. The years with missing data as a multiple of 30/31 are probably just warm weather months where nothing was reported and so it shows up as missing data, but obviously no snow fell. The years with unusual number of days missing are suffering from data quality issues.
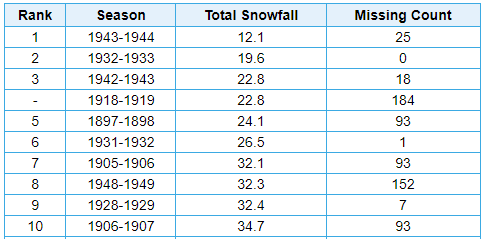
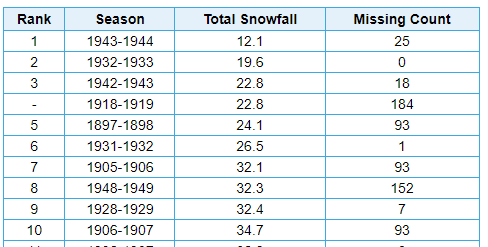
In 1943-44, 48.5 inches were actually observed, but 25 snowfall days are blanked out as missing resulting in the 12.1 inch count. 1942-1943, only monthly numbers were available on the NCDC/NCEI IPS site for the LCDs [and December was missing altogether]. But there were 31" in the months available [less December]. December shows 6.6" of snow on Climod 2, but there are a bunch of missing days - including a stretch where 0.76" of precipitation was recorded with temperatures mostly at or below freezing. Ascribing a 10:1 estimate on those days would suggest 45.1" season total, but this would need to be verified with the actual daily observations or monthly total for December 1942. 1931-1932 shows only one missing day, but that one missing day was March 31, 1932, when 3.8" of snow fell. So the seasonal count should be 30.3 inches. I did not check 1928-1929, but it shows 7 missing days and is in the same general era, so it's probably an undercount as well.
The bad, bordering on ugly:
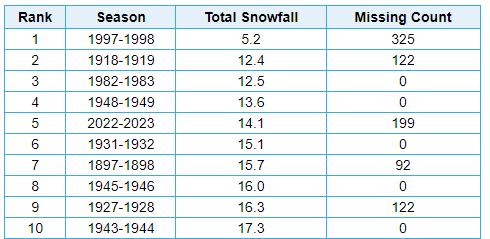
YNG's data is pretty good from the late 40s on, but the 30s and 40s have tons of missing data. The first two years do not show up on your lists, as they were properly excluded due to the missing data, so I've shown 12 years here to encompass the 10 years that are on the list. As you can see, lots of missing data, which mostly is days where no snow fell. However, there are significant data quality issues in some of these years. I looked at 1941-1942 and 1943-1944, and only liquid equivalence of snowfall was reported. The algorithm, or whatever captured this data, interprets 0.04" as 0.4" thereby prescribing a 10:1 ratio to smaller snowfall amounts. However, bigger storms are substantially undercounted. A day with 0.52" showing a depth of 4" is interpreted as 0.5" of snow, so there is a huge undercount. A day with 0.29" of liquid, is reported in Climod 2 / XMacis as 0.3" of snow [when in reality is was probably 3" or more]. Like I said, I only looked at 2 years, so I don't know if this was going on in the other years.
The downright ugly:
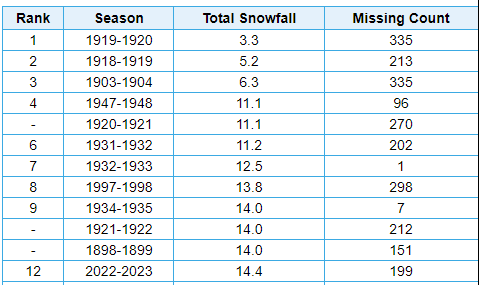
MFD's data quality is really bad. 1919-1920 shows up as the least snowy with 3.3", but this was based only on December 1919 [and there were several days with snowfall that month that were not recorded by the observer, so it's not even a complete month of data] - no records were observed in November 1919, or at all in the entire year of 1920. So obviously 1920-1921 is also incomplete. 1903-1904 also reports 335 missing days. This was a weird case. The coop site observed only precipitation and snowfall at that time. It was actually a rather snowy winter with over 50" of snow observed, but none of that data is transcribed. Like at Toledo, 1997-1998 also shows lots of missing data at MFD as well.
While 1918-1919 looks bad with 213 days missing, it actually appears to be a legitimate reading at least based on what was reported. Also lines up with the historically bad numbers reported elsewhere, but a lot of the other years look to be incomplete [1919-20, 1920-21, 1903-04, probably 1997-98]. I didn't look at every year on here, but given the missing data, likely other issues.
-
2 hours ago, TimB said:
That would shatter the record for biggest storm after the equinox (I think April 1901 and April 1902 come in at about a foot each), so yeah, not expecting that to happen.
Pittsburgh just missed an even worse snowstorm later in April 1901 that dropped 20-40+ inches of snow in eastern Ohio, but dumped about 4" of rain in the city with the worst flood until 1936. Parts of West Virginia also saw more than two feet of snow with the first storm that did hit Pittsburgh. If the atmosphere was capable of producing 40" of snow in Ohio in late April of 1901, surely a foot and a half is possible in Pittsburgh in March even with climate change?

-
3 hours ago, NEOH said:
Well, WW2 was in full swing during that time frame so maybe snowfall reporting/measuring was less of a priority.
I'm not talking about the quality of data, but problems with the digitization of the data resulting in a lot of missing data that actually was observed and/or data improperly transcribed.
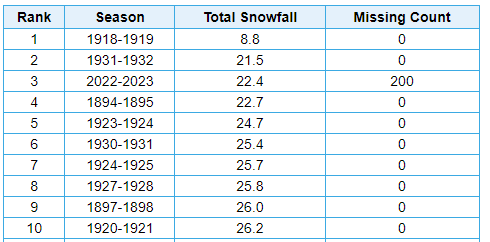
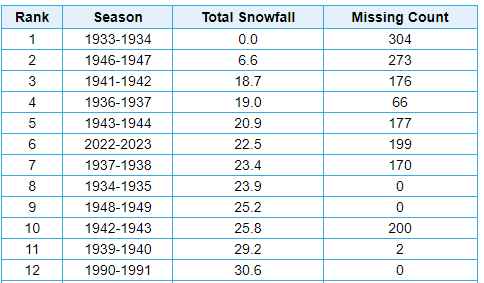
Here's what NRRC Climod2 site shows for lowest seasonal snowfall in Erie, PA:
Which matches with what NWS CLE shows (see: https://www.weather.gov/cle/Top10Annual):
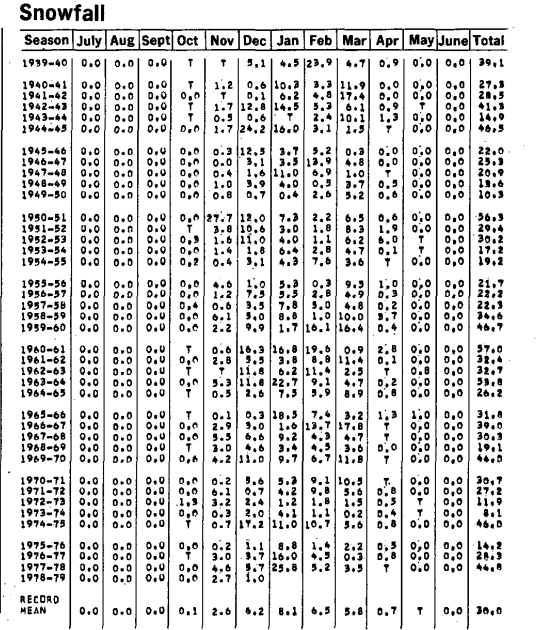
1943-44 is shown to be the least snowiest in both data sets with 12.1 inches; however, there was actually 48.5 inches reported on the raw LCDs. There are 25 days with missing data on the digitized figures - all of them had observed snow that are missing from the total snowfall count.
For example: The raw LCD data for Erie, PA in October 1943 shows 8.2 inches of snow fell, which would be the 4th most on record for the month of October. There appears to have been a mid-month storm system which gave way to lake effect/lake enhanced rain and then heavy, wet snow, judging by the massive precipitation totals.
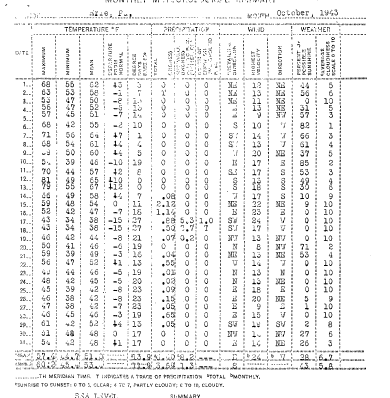
In the digitized data, from which the 12.1" seasonal figure is drawn, the snow from that storm is completely missing. The only missing data in October is the snowfall from the three days in which snow was observed - everything else matches the LCD exactly. This is only one example, it's like the entire winter in Erie. The bulk of the reported snow is not reflected in the digitized data. and reported as missing data. As noted, there is actually 48.5 inches of snow recorded in the official LCDs, which are accessible here: https://www.ncdc.noaa.gov/IPS/lcd/lcd.html
-
This is just a ridiculously bad snowfall season.
-
 1
1
-
-
Sorry for the complaints, but I think there are users here at the NWS in Cleveland that could look into this. These are just two of the more egregious examples. Obviously, don't have time to sift through all of the observations for every year. But the 12.1" was certainly eye-popping and warranted a review of the record books. No clue why all of the snowfall observations from that winter are missing there. Years ago, brought this to attention of the people in charge of the "Threaded Extremes" but nothing is ever done to correct the data.
-
Same story at Youngstown. The "official" record is 18.7 inches in the winter of 1941-42. So far, this winter, 18.4" has been observed. But if you look at the observations from that winter, most of the snowfall records are missing. Not to mention, those observations come from a location in downtown Youngstown, not KYNG airport. So we're talking about nearly 400 feet lower in elevation, urban (lots of steel mills & blast furnaces in those days) versus rural, and several miles further south. It would be like grafting snowfall records from the lakeshore in Lake County onto records from Chardon, Ohio. But even ignoring that, the snowfall observations from many of those early winters are replete with missing and incomplete data because the liquid equivalence of snowfall was reported instead of the actual snowfall and those numbers are then used by whatever algorithm they use as though it was actual snowfall.

Look at this nonsense. It's clear the observer was just listing the liquid equivalent of snowfall in the snowfall column. Whatever algorithm they use to get these figures, ignores the first zero if reported to the hundredths column and gives that as a tenth of an inch. In other words, it basically assumes a 10:1 ratio. But when two digits are reported, like 0.52" and 0.29", it simply rounds them to the nearest tenth. So those days show up as 0.5" and 0.3". Obviously, that's nonsense. The depth increased by 4" on the 17th - erroneously listed in the prevailing wind column.
Simply assuming a 10:1 ratio on all of the days with snow, except 0.8" on the 9th and 4" on the 17th to at least be consistent with the reported depth, gives 11.8". Yet the "official" total is 2.5 inches. You can see the Weather Bureau at the time, correctly indicated snowfall to be missing here.
And it gets even worse. This is the official record for December 1941, but if you look it's labeled 1942 and was received by the Weather Bureau on January 8, 1943. This is indeed the record of observations from December 1942. The December 1941 observations were mistakenly labeled as 1942, and the NWS switched the dates of the wrong month. Just complete nonsense.
Low of -10 on the 21st would be a record in the threaded climate history, yet is deleted from the record books as missing data.
-
On 3/8/2023 at 10:13 AM, NEOH said:
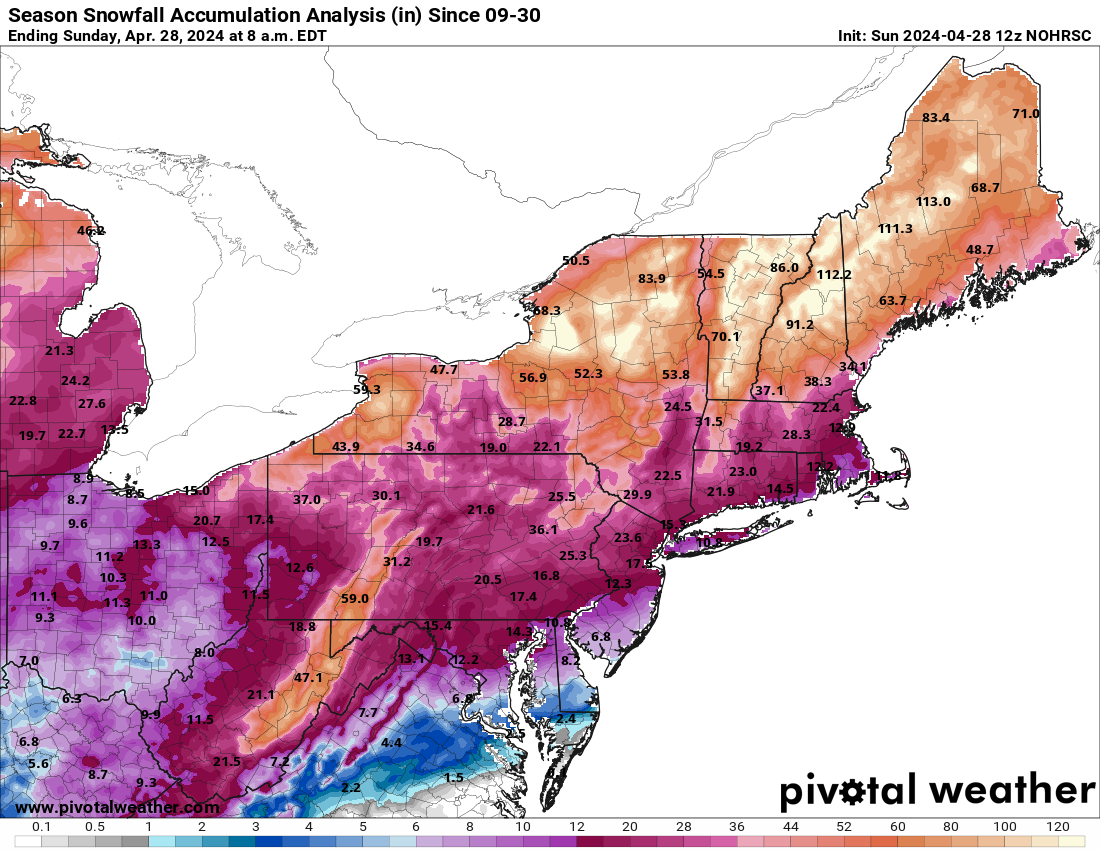
Ha. Good point. This "winter" is in rare territory for snowfall futility. Here's the snowfall map for 2011/2012. Not even close to 60" here at this point. We'll see what happens from here on out... hopefully Friday trends in a good direction.

It's even worse when you realize most of the old snow records are complete nonsense. Like the 12.1" in Erie in 1943-1944. It simply didn't happen. The data is simply missing, and it's really bizarre as the only missing data is like every date in which snow was observed.
According to NWS CLE, Erie observed 12.1" of snow in 1943-1944.
In reality, 8.2" of snow was observed in October 1943 - this is actually the 4th snowiest October in Erie history, but completely eliminated from the record books. The data from the mid-month snowstorm is all missing.
Another 6.4 inches in November 1943, 7.8 inches in December 1943, 1.0 inches in January 1944, 12.5 inches in February, 10.7 inches in March 1944, and 1.9 inches in April 1944. There were 48.5 inches observed that year, which seems paltry compared to modern normals, but there were different techniques then. Regardless, a far, far cry from the 12.1 inches reported by the NWS.
-
Here is the full station history for Pittsburgh as given in the 1978 annual weather summary for the city office.
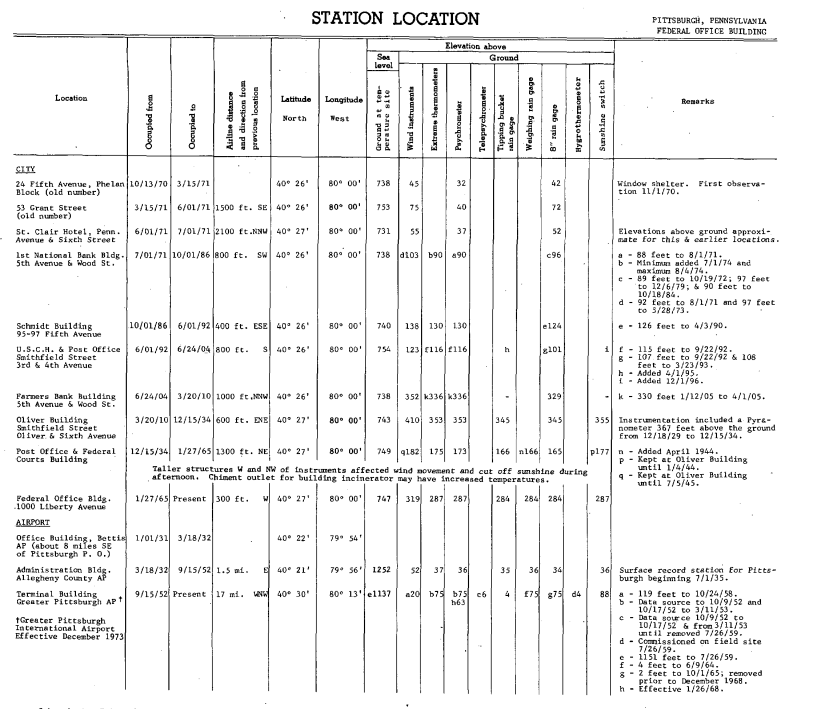
We can see records were taken at various sites downtown until July 1, 1935, at elevations between 731 and 754 feet ASL. The thermometer was sheltered in a windowsill for 1870 and 1871, and then moved to various rooftops at elevations estimated to be between 90 and 353 feet above ground level. In July 1, 1935, the station moved to the Administration Building at AGC, with an elevation of 1,252 feet ASL. The thermometer continued to be mounted on the rooftop at 37 feet above ground level. On September 15, 1952, the station moved to the Terminal Building at PIT, with an elevation of 1,137 feet ASL. The thermometer continued to be located on a rooftop about 75 feet above ground level through at least 1979. Not sure when it was moved to the standard 2 meters above the surface. Rooftop measurements can have a significant warm bias but the first 110 years were exclusively rooftop measurements, well except for the first couple years of a thermometer in a window.
This is our "official" temperature thread.
-
2
-
1
-
-
On 3/4/2023 at 10:12 PM, TimB said:
Could you make the argument that Pittsburgh (in the city) has seen less than 8.8” this winter? I think it’s possible.
Certainly possible. The minimum observed at the NWS City Office site was actually 8.1" from the winter of 1972-1973. Records continued to be taken at the city office until 1979. The official total at PIT that winter was 16.6". We can see the mean accumulation at the downtown city office was only 30", or about a foot less than the mean accumulation at PIT for the period of record (or about 14" less than the current climatological normal value).
Not to mention, the snowboard and measuring the maximum accumulation every 6-hour period is a relatively recent invention. Previously, snowfall measurements were taken once daily and, before that, it was estimated by multiplying the melted liquid amount by 10. See: U.S. Snowfall 1900-2019: A Decade-by-Decade Look | Weather Underground (wunderground.com)
-
1
-
-
7 hours ago, TimB said:
We desperately need next weekend to not turn into the clusterf*** that the Euro showed, if only to take the focus off of this NWS Ike coverup.
You have to admit it's weird. It's like some automated quality control tool came in and completely wiped out the entire storm as though it were a data error.
-
5 minutes ago, TheClimateChanger said:
Maybe this is a Mandela effect? I swear to God in my timeline, Ike was 60+ mph wind gusts. And that's borne out by the newspaper articles of the time. But if you go back and try to pull up observations from the day of Hurricane Ike at the various airports around Pittsburgh today, they are like 40 mph wind gusts maximum observed. I'm so confused.... this is completely baffling? Any insights on this?
THIS IS NOT WHAT HAPPENED! WHAT IS GOING ON?
imeTemperatureDew PointHumidityWindWind SpeedWind GustPressurePrecip.Condition10:51 PM 76 °F 68 °F 76 % S 8 mph 0 mph 28.59 in 0.0 in Cloudy 11:51 PM 76 °F 68 °F 76 % S 7 mph 0 mph 28.57 in 0.0 in Mostly Cloudy 12:51 AM 76 °F 67 °F 74 % SSW 9 mph 0 mph 28.56 in 0.0 in Partly Cloudy 1:51 AM 75 °F 67 °F 76 % SSW 10 mph 0 mph 28.55 in 0.0 in Partly Cloudy 2:51 AM 74 °F 67 °F 79 % SSW 8 mph 0 mph 28.54 in 0.0 in Partly Cloudy 3:51 AM 73 °F 67 °F 81 % SSW 8 mph 0 mph 28.53 in 0.0 in Partly Cloudy 4:51 AM 73 °F 66 °F 79 % SSW 6 mph 0 mph 28.53 in 0.0 in Partly Cloudy 5:51 AM 72 °F 66 °F 81 % SSW 7 mph 0 mph 28.53 in 0.0 in Partly Cloudy 6:51 AM 72 °F 67 °F 84 % SSW 8 mph 0 mph 28.54 in 0.0 in Mostly Cloudy 7:51 AM 74 °F 67 °F 79 % SSW 9 mph 0 mph 28.54 in 0.0 in Partly Cloudy 8:51 AM 78 °F 68 °F 71 % SSW 12 mph 0 mph 28.53 in 0.0 in Mostly Cloudy 9:51 AM 79 °F 68 °F 69 % SSW 16 mph 21 mph 28.51 in 0.0 in Mostly Cloudy 10:51 AM 81 °F 68 °F 65 % SSW 16 mph 0 mph 28.48 in 0.0 in Mostly Cloudy 11:51 AM 84 °F 68 °F 58 % SSW 12 mph 0 mph 28.45 in 0.0 in Cloudy 12:51 PM 85 °F 68 °F 57 % S 13 mph 21 mph 28.41 in 0.0 in Mostly Cloudy 1:51 PM 87 °F 66 °F 49 % S 14 mph 20 mph 28.35 in 0.0 in Mostly Cloudy 2:51 PM 86 °F 65 °F 49 % S 17 mph 24 mph 28.30 in 0.0 in Cloudy 3:51 PM 85 °F 65 °F 51 % S 16 mph 28 mph 28.27 in 0.0 in Cloudy 4:51 PM 86 °F 65 °F 49 % S 17 mph 30 mph 28.24 in 0.0 in Cloudy 9:51 PM 72 °F 58 °F 61 % W 20 mph 41 mph 28.44 in 0.0 in Cloudy Oh wait a second!!! They literally deleted all of the observations between 4:51 and 9:51, and from 9:51 to the end of the day. I think they are missing a good chunk of data. May have gotten pruned by some sort of automated algorithm designed to eliminate faulty data since it was so bizarrely out of whack with September climatology.
I wish there was a way to get some one to look into this to see why the official records show a modest 52 mph wind gust at PIT and many hours of data are simply stricken.
-
Maybe this is a Mandela effect? I swear to God in my timeline, Ike was 60+ mph wind gusts. And that's borne out by the newspaper articles of the time. But if you go back and try to pull up observations from the day of Hurricane Ike at the various airports around Pittsburgh today, they are like 40 mph wind gusts maximum observed. I'm so confused.... this is completely baffling? Any insights on this?
THIS IS NOT WHAT HAPPENED! WHAT IS GOING ON?
imeTemperatureDew PointHumidityWindWind SpeedWind GustPressurePrecip.Condition10:51 PM 76 °F 68 °F 76 % S 8 mph 0 mph 28.59 in 0.0 in Cloudy 11:51 PM 76 °F 68 °F 76 % S 7 mph 0 mph 28.57 in 0.0 in Mostly Cloudy 12:51 AM 76 °F 67 °F 74 % SSW 9 mph 0 mph 28.56 in 0.0 in Partly Cloudy 1:51 AM 75 °F 67 °F 76 % SSW 10 mph 0 mph 28.55 in 0.0 in Partly Cloudy 2:51 AM 74 °F 67 °F 79 % SSW 8 mph 0 mph 28.54 in 0.0 in Partly Cloudy 3:51 AM 73 °F 67 °F 81 % SSW 8 mph 0 mph 28.53 in 0.0 in Partly Cloudy 4:51 AM 73 °F 66 °F 79 % SSW 6 mph 0 mph 28.53 in 0.0 in Partly Cloudy 5:51 AM 72 °F 66 °F 81 % SSW 7 mph 0 mph 28.53 in 0.0 in Partly Cloudy 6:51 AM 72 °F 67 °F 84 % SSW 8 mph 0 mph 28.54 in 0.0 in Mostly Cloudy 7:51 AM 74 °F 67 °F 79 % SSW 9 mph 0 mph 28.54 in 0.0 in Partly Cloudy 8:51 AM 78 °F 68 °F 71 % SSW 12 mph 0 mph 28.53 in 0.0 in Mostly Cloudy 9:51 AM 79 °F 68 °F 69 % SSW 16 mph 21 mph 28.51 in 0.0 in Mostly Cloudy 10:51 AM 81 °F 68 °F 65 % SSW 16 mph 0 mph 28.48 in 0.0 in Mostly Cloudy 11:51 AM 84 °F 68 °F 58 % SSW 12 mph 0 mph 28.45 in 0.0 in Cloudy 12:51 PM 85 °F 68 °F 57 % S 13 mph 21 mph 28.41 in 0.0 in Mostly Cloudy 1:51 PM 87 °F 66 °F 49 % S 14 mph 20 mph 28.35 in 0.0 in Mostly Cloudy 2:51 PM 86 °F 65 °F 49 % S 17 mph 24 mph 28.30 in 0.0 in Cloudy 3:51 PM 85 °F 65 °F 51 % S 16 mph 28 mph 28.27 in 0.0 in Cloudy 4:51 PM 86 °F 65 °F 49 % S 17 mph 30 mph 28.24 in 0.0 in Cloudy 9:51 PM 72 °F 58 °F 61 % W 20 mph 41 mph 28.44 in 0.0 in Cloudy -
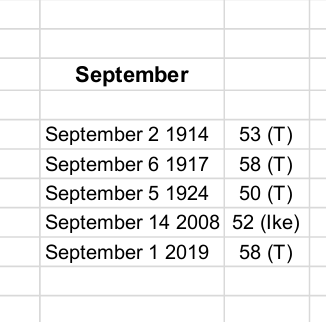
The Hurricane Ike fraud goes so deep that they actually altered the official records for September 14, 2008 to show only a 52 mph peak gust. Unreal. It's no wonder people are skeptical of climate change when they can just go in and change the past like this. I lived in the city then and it was way higher than 52 mph. There were transformers blowing left and right. You can see from the articles several schools were cancelled - that doesn't happen at 52 mph.

-
1
-
-
With a very windy day on tap, let's take a moment to appreciate how the NWS continues to gaslight on Hurricane Ike.
The wind gust records list a peak gust of 52 mph at PIT, which is laughable. See NWS Pittsburgh Records Climate Data (weather.gov), and click on Wind Gust Records [opens in separate downloaded file].
Luckily there's still a lot of residue from this era available on the world wide web.
Pittsburgh area hit by remnants of Hurricane Ike - Pittsburgh Business Times (googleusercontent.com)
STORM: Storm definitely from Ike (timesonline.com)
QuoteThe wind set a record at the Pittsburgh International Airport, where a gust was measured at 67 mph at 8:30 p.m. Sunday. The record high — 62 mph — was set in June 1988. Hendricks said an 81 mph gust was clocked at the Beaver County Airport at 8:37 p.m. — Bob Bauder
At the time, the 67 mph gust was believed to be the all time record at the airport. They now claim there was an 83 mph gust in July 1992, and also since then there was a 75 mph gust in April 2020. But the 52 mph recorded on the records site is just laughable - I think sustained winds from Ike were that high. I bet there were 10 or 20 gusts on September 14, 2008 alone that exceeded the reported September record of 58 mph. What made Ike so dangerous is, unlike a brief heavy thunderstorm gust, this was hours and hours of 40+ mph sustained winds and gusts of 55-65+ mph.
Anyways, third highest gust on record at the PIT airport, and it wouldn't surprise if the sustained winds from Ike were an all-time record. But they've relegated in the record books to run of the mill wind advisory conditions. Just complete gaslighting. Like we get it, your forecast busted. Time to get over it and report the actual observed winds.
-
In other news, the Euro suggests we may have something to keep an eye out for in about 10 days.

-
7 minutes ago, TimB said:
I think this table is wrong. The 59.8 belongs to 17-18, not 18-19, which I think was slightly below normal. The ones below it should be shifted down as well.
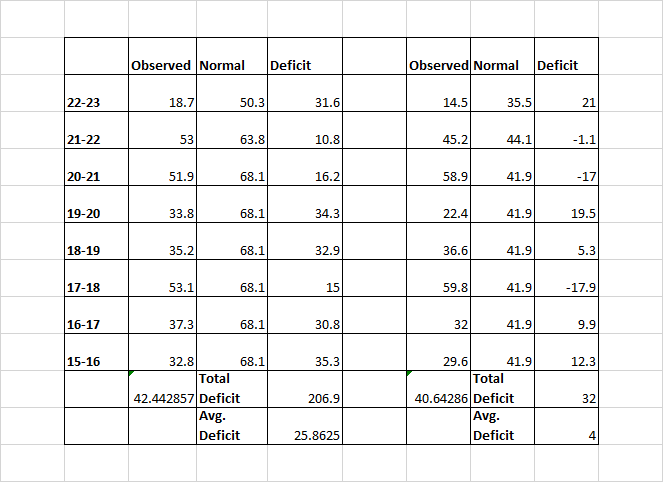
Yeah, I caught that after posting and swapped in the proper graphic. But the gist of the comment is correct. PIT has averaged 40.6" over the last 7 winters... and obviously this winter will drop that down some, unless we get a March 1993 Superstorm. 3 of the last 7 winters were above normal. Still have been relatively fortunate compared to some areas, granted I know places like Erie and Buffalo have had some record-breaking lake effect outbreaks over that stretch.
And... actually with that correction, PIT has still beaten CLE 3 times in the last 8 years. The correct figure of 36.6" was still higher than the 35.2" at CLE.
-
12 hours ago, TimB said:
Yeah I was just joking. I rather enjoyed last summer to be honest. I haven’t forgotten that we managed an ever so slightly below normal 2022 if you look at the entire year. We had to pay for it at some point, and pay for it we did.
We've been really fortunate as well. Cleveland hasn't had an above normal snowfall winter since 2014-2015, and PIT has beaten CLE in 2 of the last 8 years.
The averages are basically the same the last 7 full winters (CLE --> 42.4" and PIT --> 40.6"). By contrast, the 1981-2010 normals were 68.1" and 41.9" respectively. The current normals (1991-2020) are 63.8" and 44.1" respectively. Note, negative "deficits" denote positive departure. Pittsburgh has been above normal for snowfall in 3 of the last 8 winters.
-
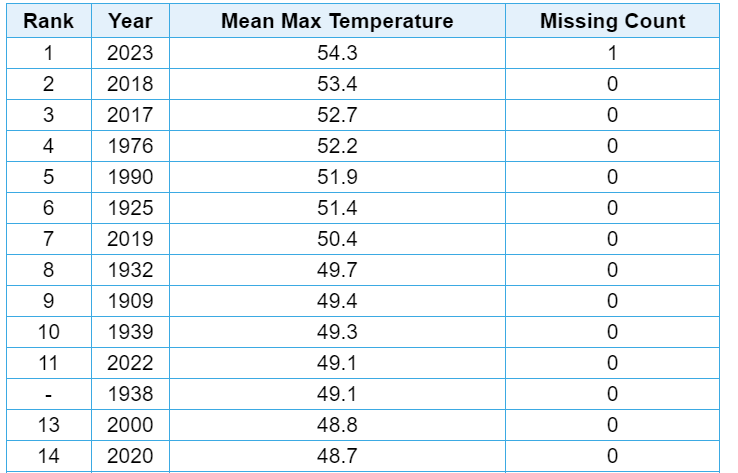
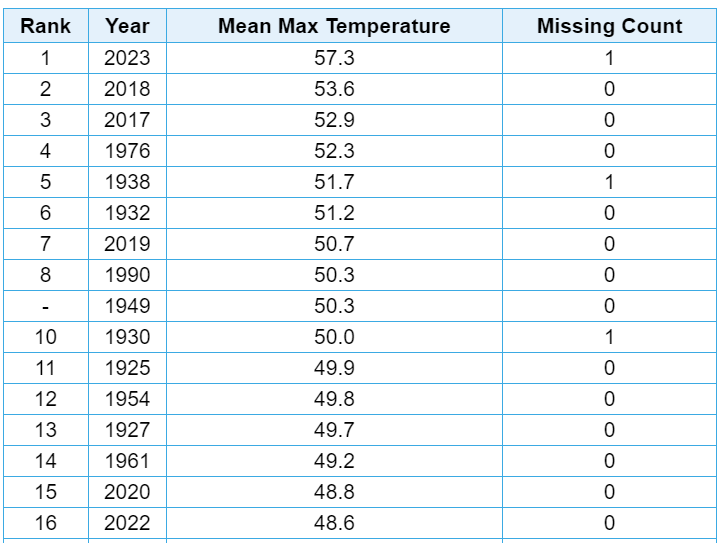
I'm not cherrypicking either. Look at Elkins, and this is at nearly 2000' mind you. 7 out of 125 years saw mean maxima 50+, 4 of them just since 2017. You can see that Super El Nino just completely obliterated the bounds of what was previously possible climatologically. Even 2020 and 2022 were just a bit shy of the 50F mark at Elkins.
50+ mean max months: 1925, 1976 --> starting to speed up here -> 1990 -> *cue This is Fine Dog on Fire Meme* -> 2017 -> all semblance of normalcy obliterated -> 2018, 2019, 2023
-
It could always be worse. You don't have to go too far south before you come across places where the mean monthly maximum this month was in the mid or even upper 50s. Clarksburg, WV saw a mean monthly maximum of 57.3F, which was nearly four degrees warmer than the record in 2018 (101 years of data!).
There's no way to sugarcoat this. It is getting downright ugly just to our south. I don't think we're too far off from seeing occasional winter months in West Virginia where the mean maximum is 60+. You have to think this is going to push into SW Pennsylvania within the next couple of decades and probably get "superheated" as it descends into the Monongahela and Ohio River Valleys. Maybe we'll be seeing Februarys with 60+ average highs at some point.
Clarksburg, WV
-
 1
1
-
-
2 hours ago, TimB said:
And so today concludes the warmest Jan-Feb period anyone who posts here has ever experienced in this area. Warmer than 2017. Warmer than 1998.
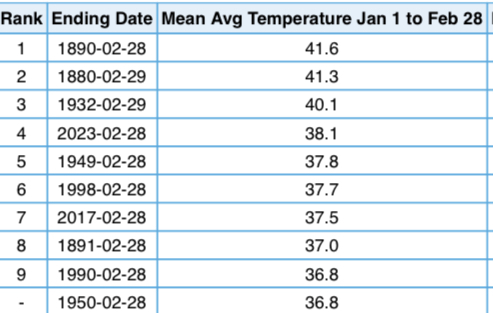
Looks like every threaded climate site in PBZ's warning area set a new monthly mean maximum high temperature record this month. These high temperatures were on par with what was considered normal under the 1961-1990 means in places like Chattanooga, TN and Oklahoma City in February. I just think we have to come to grips with the fact that western Pennsylvania is not a reliably wintry location anymore.
-
1
-


My 2022-23 winter outlook & "what went wrong" Post-mortem
in Mid Atlantic
Posted
https://www.washington.edu/news/2022/10/03/study-suggests-la-nina-winters-could-keep-on-coming/