

TheClimateChanger
-
Posts
1,996 -
Joined
-
Last visited
Content Type
Profiles
Blogs
Forums
American Weather
Media Demo
Store
Gallery
Posts posted by TheClimateChanger
-
-
13 minutes ago, TheClimateChanger said:
I know some people will look at the Smithsonian Institution numbers I've shared from the 19th century, and say "but those are averages of 7 am, 2 pm, and 9 pm" readings and not averages of maximum and minimum temperatures, and my response would be that's there's little difference between the two. First, the times are on local solar time - which for most of Pennsylvania is similar to local standard time. So 7 am and 2 pm are roughly high and low, and 9 pm is roughly in the middle of the two.
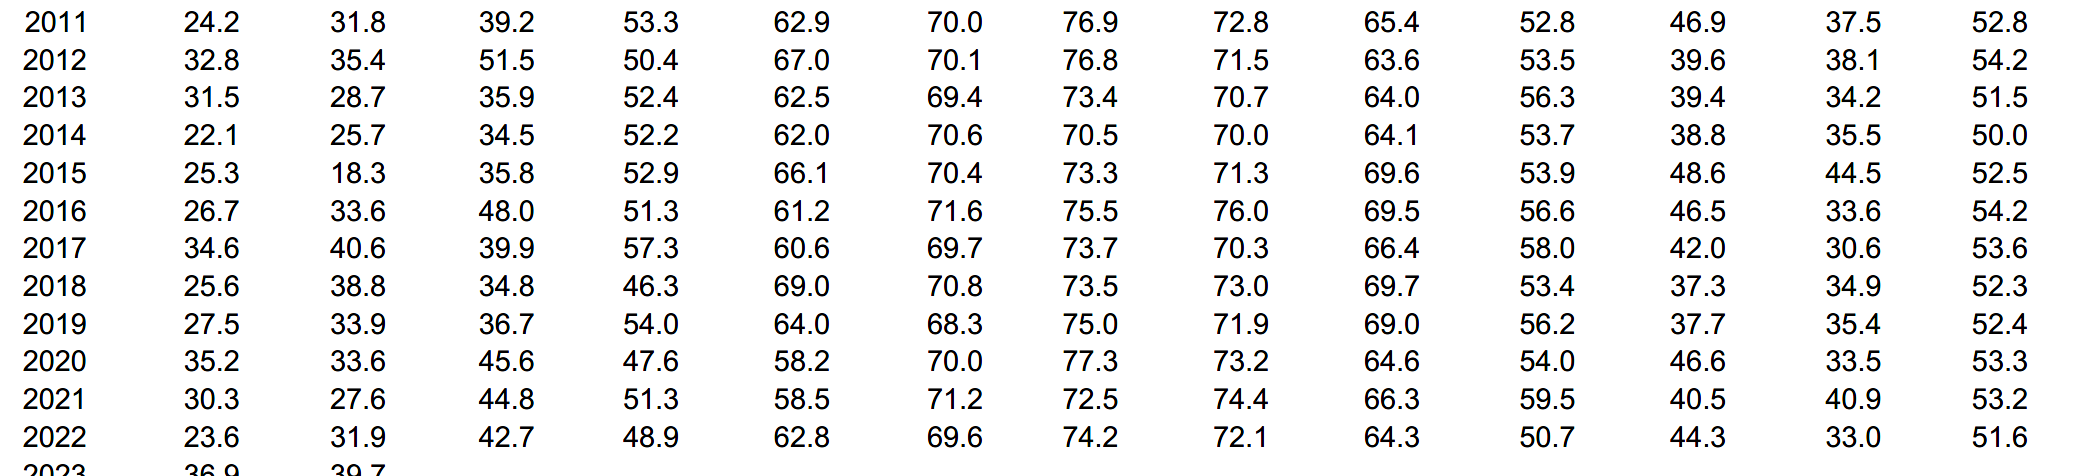
For the sake of comparison, let's look at the Pittsburgh readings for 2011.
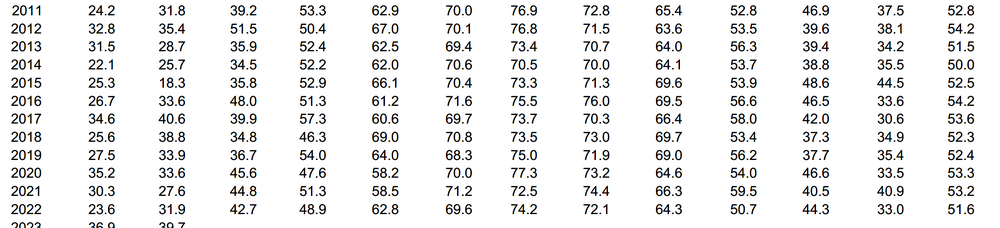
January was 24.2F. From the LCD, the 7 am (standard) mean was 21, the 2 pm (standard) mean was 28, and the 9 pm (standard) mean was 25F. The Smithsonian mean would be reported as 24.7F, or 0.5F warmer than the true mean.
February was 31.8F. From the LCD, the 7 am (standard) mean was 29F, the 2 pm (standard) mean was 36F, and the 9 pm (standard) mean was 32F. The Smithsonian mean would be reported as 32.3F, or 0.5F warmer than the true mean.
March was 39.2F. From the LCD, the 7 am (standard) mean was 33F, the 2 pm (standard) mean was 45F, and the 9 pm (standard) mean was 39F. The Smithsonian mean would be reported as 39.0F, or 0.2F cooler than the true mean.
April was 53.3F. From the LCD, the 7 am (standard) mean was 48F, the 2 pm (standard) mean was 59F, and the 9 pm (standard) mean was 53F. The Smithsonian mean would be reported as 53.3F, or exactly the same as the true mean.
May was 62.9F. From the LCD, the 7 am (standard) mean was 57F, the 2 pm (standard) mean was 70F, and the 9 pm (standard) mean was 63F. The Smithsonian mean would be reported as 63.3F, or 0.4F warmer than the true mean.
June was 70.0F. From the LCD, the 7 am (standard) mean was 65F, the 2 pm (standard) mean was 78F, and the 9 pm (standard) mean was 71F. The Smithsonian mean would be reported as 71.3F, or 1.3F warmer than the true mean.
July was 76.9F. From the LCD, the 7 am (standard) mean was 70F, the 2 pm (standard) mean was 85F, and the 9 pm (standard) mean was 77F. The Smithsonian mean would be reported as 77.3F, or 0.4F warmer than the true mean.
August was 72.8F. From the LCD, the 7 am (standard) mean was 66F, the 2 pm (standard) mean was 81F, and the 9 pm (standard) mean was 72F. The Smithsonian mean would be reported as 73.0F, or 0.2F warmer than the true mean.
September was 65.4F. From the LCD, the 7 am (standard) mean was 60F, the 2 pm (standard) mean was 71F, and the 9 pm (standard) mean was 64F. The Smithsonian mean would be reported as 65.0F, or 0.4F cooler than the true mean.
October was 52.8F. From the LCD, the 7 am (standard) mean was 47F, the 2 pm (standard) mean was 59F, and the 9 pm (standard) mean was 52F. The Smithsonian mean would be reported as 52.7F, or 0.1F cooler than the true mean.
November was 46.9F. From the LCD, the 7 am (standard) mean was 42F, the 2 pm (standard) mean was 53F, and the 9 pm (standard) mean was 47F. The Smithsonian mean would be reported as 47.3F, or 0.4F warmer than the true mean.
December was 37.5F. From the LCD, the 7 am (standard) mean was 34F, the 2 pm (standard) mean was 42F, and the 9 pm (standard) mean was 38F. The Smithsonian mean would be reported as 38.0F, or 0.5F warmer than the true mean.
Just for the record, for the year of 2011, the Smithsonian mean for PIT would have been 53.1F, or just 0.3F warmer than the true mean. Like I said, this was an incredible approximation in the absence of a max/min thermometer.
-
Just now, TheClimateChanger said:
I know some people will look at the Smithsonian Institution numbers I've shared from the 19th century, and say "but those are averages of 7 am, 2 pm, and 9 pm" readings and not averages of maximum and minimum temperatures, and my response would be that's there's little difference between the two. First, the times are on local solar time - which for most of Pennsylvania is similar to local standard time. So 7 am and 2 pm are roughly high and low, and 9 pm is roughly in the middle of the two.
For the sake of comparison, let's look at the Pittsburgh readings for 2011.
January was 24.2F. From the LCD, the 7 am (standard) mean was 21, the 2 pm (standard) mean was 28, and the 9 pm (standard) mean was 25F. The Smithsonian mean would be reported as 24.7F, or 0.5F warmer than the true mean.
February was 31.8F. From the LCD, the 7 am (standard) mean was 29F, the 2 pm (standard) mean was 36F, and the 9 pm (standard) mean was 32F. The Smithsonian mean would be reported as 32.3F, or 0.5F warmer than the true mean.
March was 39.2F. From the LCD, the 7 am (standard) mean was 33F, the 2 pm (standard) mean was 45F, and the 9 pm (standard) mean was 39F. The Smithsonian mean would be reported as 39.0F, or 0.2F cooler than the true mean.
April was 53.3F. From the LCD, the 7 am (standard) mean was 48F, the 2 pm (standard) mean was 59F, and the 9 pm (standard) mean was 53F. The Smithsonian mean would be reported as 53.3F, or exactly the same as the true mean.
May was 62.9F. From the LCD, the 7 am (standard) mean was 57F, the 2 pm (standard) mean was 70F, and the 9 pm (standard) mean was 63F. The Smithsonian mean would be reported as 63.3F, or 0.4F warmer than the true mean.
June was 70.0F. From the LCD, the 7 am (standard) mean was 65F, the 2 pm (standard) mean was 78F, and the 9 pm (standard) mean was 71F. The Smithsonian mean would be reported as 71.3F, or 1.3F warmer than the true mean.
July was 76.9F. From the LCD, the 7 am (standard) mean was 70F, the 2 pm (standard) mean was 85F, and the 9 pm (standard) mean was 77F. The Smithsonian mean would be reported as 77.3F, or 0.4F warmer than the true mean.
August was 72.8F. From the LCD, the 7 am (standard) mean was 66F, the 2 pm (standard) mean was 81F, and the 9 pm (standard) mean was 72F. The Smithsonian mean would be reported as 73.0F, or 0.2F warmer than the true mean.
September was 65.4F. From the LCD, the 7 am (standard) mean was 60F, the 2 pm (standard) mean was 71F, and the 9 pm (standard) mean was 64F. The Smithsonian mean would be reported as 65.0F, or 0.4F cooler than the true mean.
October was 52.8F. From the LCD, the 7 am (standard) mean was 47F, the 2 pm (standard) mean was 59F, and the 9 pm (standard) mean was 52F. The Smithsonian mean would be reported as 52.7F, or 0.1F cooler than the true mean.
November was 46.9F. From the LCD, the 7 am (standard) mean was 42F, the 2 pm (standard) mean was 53F, and the 9 pm (standard) mean was 47F. The Smithsonian mean would be reported as 47.3F, or 0.4F warmer than the true mean.
December was 37.5F. From the LCD, the 7 am (standard) mean was 34F, the 2 pm (standard) mean was 42F, and the 9 pm (standard) mean was 38F. The Smithsonian mean would be reported as 38.0F, or 0.5F warmer than the true mean.
Obviously, to get a better comparison of the Smithsonian Institution means compared to the true means, you would need to look at a longer time frame and more locations. But, in general, the differences are surprisingly small. Remember these Smithsonian people were smart - they may not have had modern technology, but they were resourceful and able to make do with what they had. Generally, there appears to be a slight warm bias in the Smithsonian means - this is particularly the case in the early summer, when the 7 am reading [8 am EDT] would be too late to capture the true minimum temperature. In general, there is already a couple degree rise by that point. This effect is, of course, negligible in the cold season when 7 am EST is around sunrise.
It is worth noting that, a few of these old records, are said to have taken the first reading at sunrise. In those cases, the above effect would not be true and there may even be a slight cool bias in those records. However, the effect again would be very small. The main point is you can look at these old records obtained from three measurements and directly compare them to modern true means without the need for any adjustment since the error is not in one direction, small in degree, and generally a small warm bias. With the small warm bias, the old records are actually underestimating the amount of warming that has occurred.
-
I know some people will look at the Smithsonian Institution numbers I've shared from the 19th century, and say "but those are averages of 7 am, 2 pm, and 9 pm" readings and not averages of maximum and minimum temperatures, and my response would be that's there's little difference between the two. First, the times are on local solar time - which for most of Pennsylvania is similar to local standard time. So 7 am and 2 pm are roughly high and low, and 9 pm is roughly in the middle of the two.
For the sake of comparison, let's look at the Pittsburgh readings for 2011.
January was 24.2F. From the LCD, the 7 am (standard) mean was 21, the 2 pm (standard) mean was 28, and the 9 pm (standard) mean was 25F. The Smithsonian mean would be reported as 24.7F, or 0.5F warmer than the true mean.
February was 31.8F. From the LCD, the 7 am (standard) mean was 29F, the 2 pm (standard) mean was 36F, and the 9 pm (standard) mean was 32F. The Smithsonian mean would be reported as 32.3F, or 0.5F warmer than the true mean.
March was 39.2F. From the LCD, the 7 am (standard) mean was 33F, the 2 pm (standard) mean was 45F, and the 9 pm (standard) mean was 39F. The Smithsonian mean would be reported as 39.0F, or 0.2F cooler than the true mean.
April was 53.3F. From the LCD, the 7 am (standard) mean was 48F, the 2 pm (standard) mean was 59F, and the 9 pm (standard) mean was 53F. The Smithsonian mean would be reported as 53.3F, or exactly the same as the true mean.
May was 62.9F. From the LCD, the 7 am (standard) mean was 57F, the 2 pm (standard) mean was 70F, and the 9 pm (standard) mean was 63F. The Smithsonian mean would be reported as 63.3F, or 0.4F warmer than the true mean.
June was 70.0F. From the LCD, the 7 am (standard) mean was 65F, the 2 pm (standard) mean was 78F, and the 9 pm (standard) mean was 71F. The Smithsonian mean would be reported as 71.3F, or 1.3F warmer than the true mean.
July was 76.9F. From the LCD, the 7 am (standard) mean was 70F, the 2 pm (standard) mean was 85F, and the 9 pm (standard) mean was 77F. The Smithsonian mean would be reported as 77.3F, or 0.4F warmer than the true mean.
August was 72.8F. From the LCD, the 7 am (standard) mean was 66F, the 2 pm (standard) mean was 81F, and the 9 pm (standard) mean was 72F. The Smithsonian mean would be reported as 73.0F, or 0.2F warmer than the true mean.
September was 65.4F. From the LCD, the 7 am (standard) mean was 60F, the 2 pm (standard) mean was 71F, and the 9 pm (standard) mean was 64F. The Smithsonian mean would be reported as 65.0F, or 0.4F cooler than the true mean.
October was 52.8F. From the LCD, the 7 am (standard) mean was 47F, the 2 pm (standard) mean was 59F, and the 9 pm (standard) mean was 52F. The Smithsonian mean would be reported as 52.7F, or 0.1F cooler than the true mean.
November was 46.9F. From the LCD, the 7 am (standard) mean was 42F, the 2 pm (standard) mean was 53F, and the 9 pm (standard) mean was 47F. The Smithsonian mean would be reported as 47.3F, or 0.4F warmer than the true mean.
December was 37.5F. From the LCD, the 7 am (standard) mean was 34F, the 2 pm (standard) mean was 42F, and the 9 pm (standard) mean was 38F. The Smithsonian mean would be reported as 38.0F, or 0.5F warmer than the true mean.
-
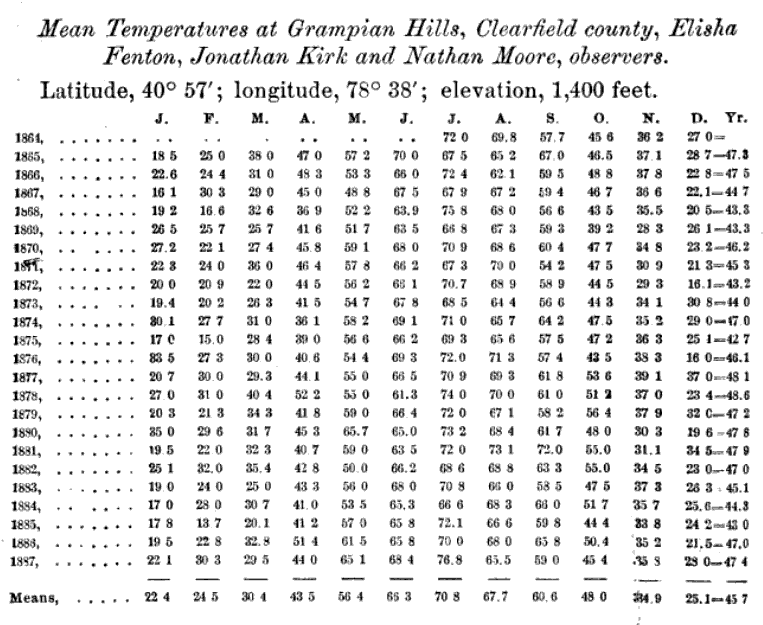
I'm still not finding a urban heat island effect. Like this data for Grampian in Clearfield County, has a mean of 45.7F, with individual years ranging from 42.7F [1875] to 48.6F [1878]. If I compare this to the modern records for nearby DuBois, we find a mean of 47.8F. Again, 2.1F doesn't sound like a ton. But it's massive in this context. 45.7F is the third coldest annual mean in the DUJ records dating back to 1963. And DUJ is 400' higher in elevation than this site, and somewhat further north. There are 10 years in this data set that are colder than anything observed at DUJ since 1963. We would need a high-end VEI 8 just to have a chance to experience what is a natural climate in this state for a few years.
-
1 hour ago, ChescoWx said:

Wikipedia reports the following for West Chester (Blodget's means are in parentheses, along with the difference):
January: 30.7 [29.7] [-1.0]
February: 31.6 [31.5] [-0.1]
March: 40.9 [37.3] [-3.6]
April: 51.2 [48.7] [-2.5]
May: 61.5 [59.9] [-1.6]
June: 70.2 [69.1] [-1.1]
July: 74.9 [74.0] [-0.9]
August: 73.2 [71.5] [-1.7]
September: 66.4 [64.3] [-2.1]
October: 55.1 [53.9] [-1.2]
November: 44.6 [42.4] [-2.2]
December: 33.8 [32.9] [-0.9]
Annual: 52.8 [51.3] [-1.5]
Yeah, this looks similar to the other data I've seen. Looks like spring has the most warming, followed by autumn. It warms more rapidly into spring nowadays, and summer's warmth is more resilient. Does not decline as quickly into fall. The 1.5F difference doesn't sound like much, but it's a big change over the course of the year. And the change is more dramatic for cold years. The modern data set shows around 50F being the lowest, but there were several years in the high 40s in the numbers published by Blodget - including a 47.8F in the notoriously cold year of 1875. For comparison sake, the threaded records for PHL report 50.1F for the mean that year - by far, the coldest annual mean in the threaded records. Second place is 51.8F in 1904. I'd be willing to bet 47.8F is downright impossible for an annual mean in West Chester today. Unless there was a supervolcano eruption that lofted huge quantities of sulfur into the atmosphere.
-
People have no idea how cold it really used to be. I mean can you imagine any low elevation site in the State of Pennsylvania having a year with an annual mean of 40.0F nowadays?
Compare that to today:
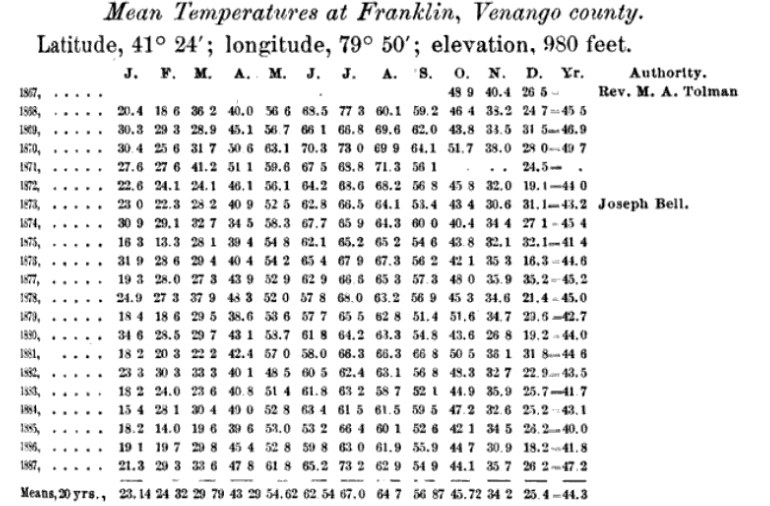
Or even look at the Signal Service records for Pittsburgh. This doesn't look that much cooler than today - but these were taken 500 feet lower than the modern airport records. That's enough of an elevation change to easily account for 2 degrees or more. Even still, there are some doozies mixed in there. 46.9F in 1827, 47.8F in 1856. The modern record cold year (again 500' higher in elevation) is 48.0F in 1976. If there were records at the airport location, it could have been 45 or 46 degrees in those years.
-
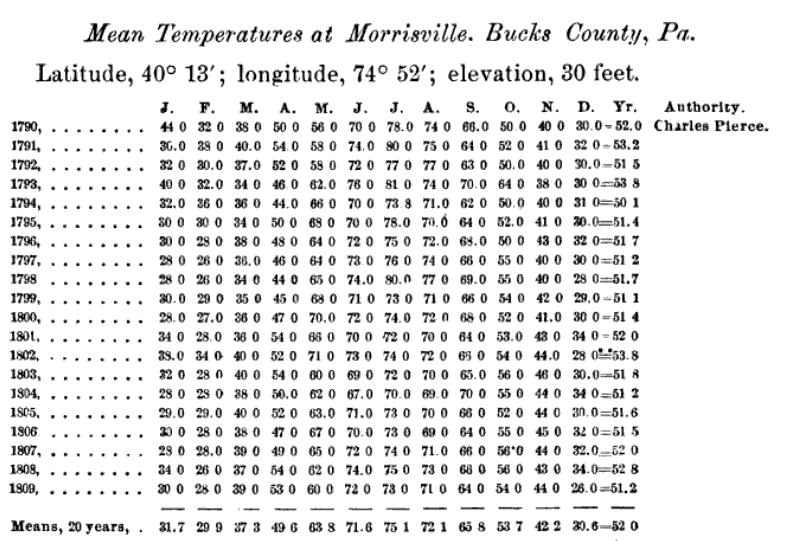
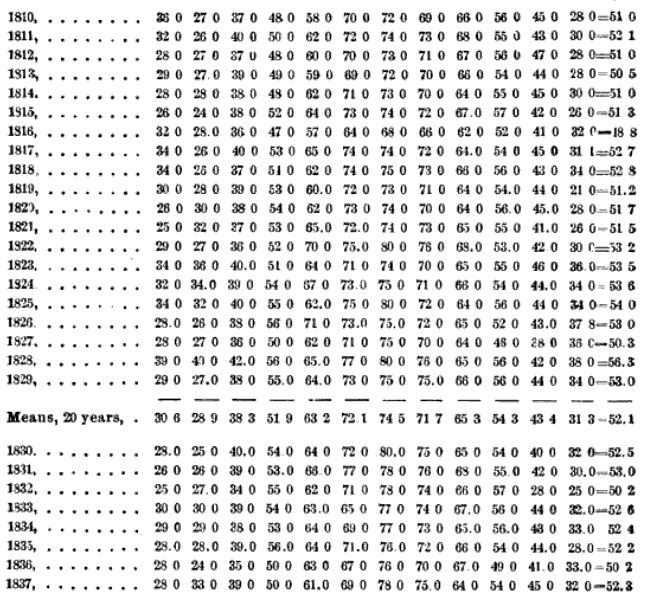
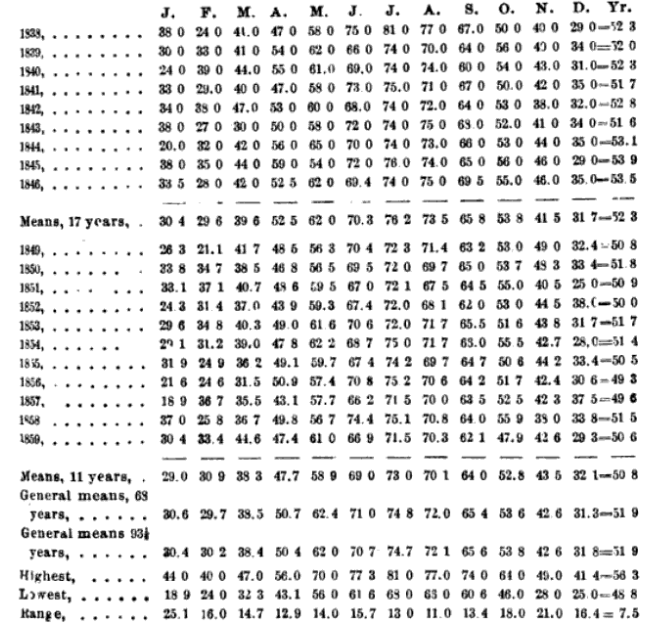
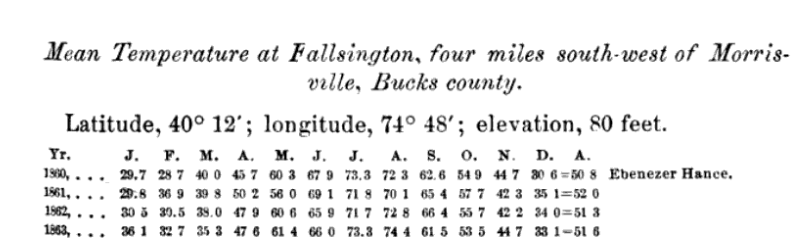
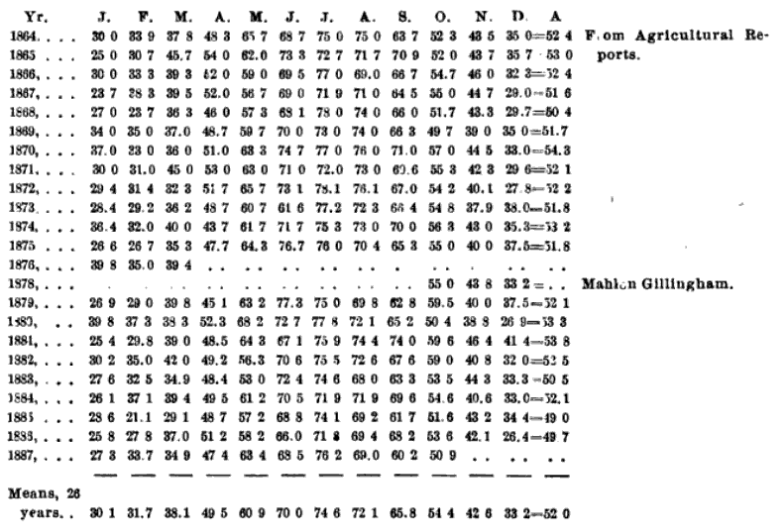
And here's data for Bucks County from 1790-1887. Looks like a mean of around 51.9F, ranging from 48.8F in 1816 (year without a summer) to 56.3F in 1828. We can also see that the year without a summer wasn't an old wives tale. Mean temperatures were 57F in May, 64F in June, 68F in July, 66F in August, and 62F in September. Very chilly.
-
Just comparing it to your post 1890 data, it seems like it used to be significantly cooler in Chester County in the 1850s-1880s.

-
-
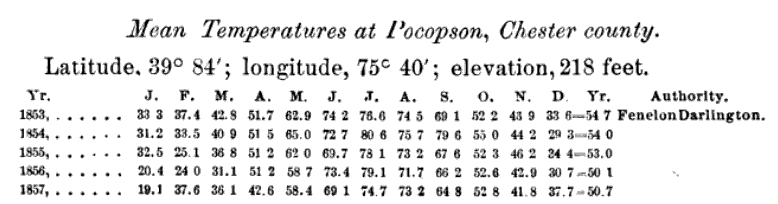
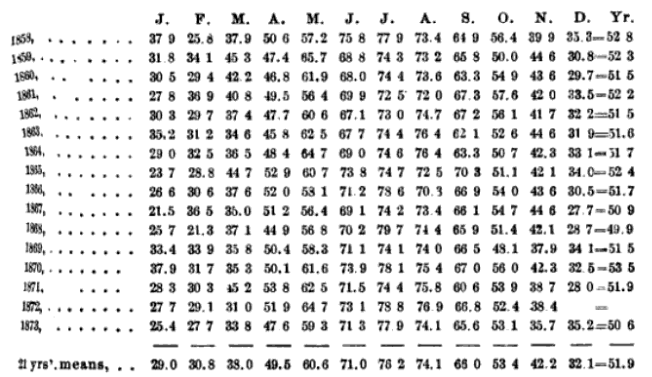
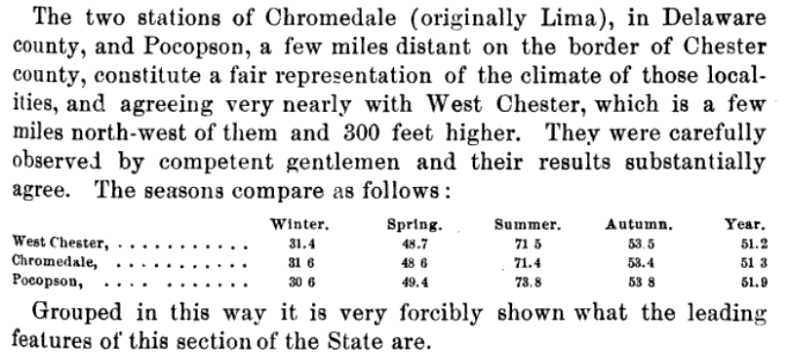
And for Pocopson, in Chester County, he had 21 years of data [1853-1873]. Mean annual temperature was 51.9F, ranging from 49.9F in 1868 to 54.7F in 1853. Unfortunately, this data set ends before the very cold year of 1875. Regardless, I feel like these temperatures are lower than anything reported in recent decades.
-
On 4/20/2023 at 8:41 AM, ChescoWx said:
Satellite record....do we have that data back to the 1880's??
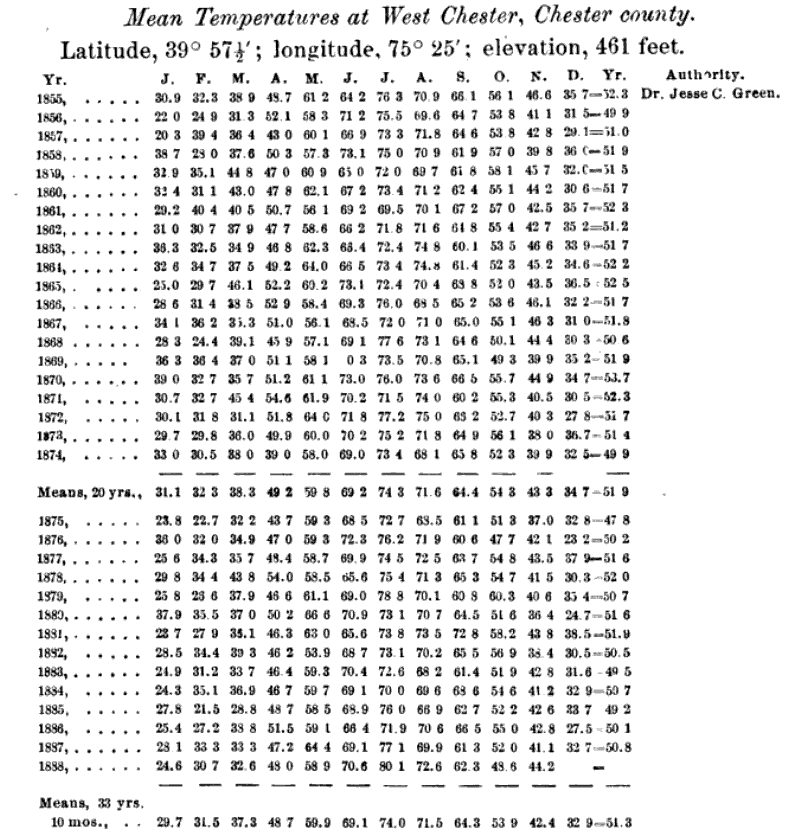
How do your records compare to those published in Lorin Blodget's seminal work on the Climate of Pennsylvania, published in 1889? He had 33 complete years of data for West Chester from 1855-1887, plus all of 1888 except for December, and computed an annual mean of 51.3F, ranging from a minumum of 47.8F in 1875 to a maximum of 53.7F in 1870.

-
Maybe I'm off base here, but, to me, it always seems the urban heat island effect is blown way out of proportion. Sure if you're measuring temperatures in a dense city, particularly over a dark rooftop or asphalt, it's going to be somewhat higher. But other than that, there doesn't seem to be any strong relationship between temperature and population. Just look at the temperatures this month around here, where is the urban heat island effect?
PIT: 54.4F [Allegheny Co., pop: 1.25M] [Elev: 1201 feet] [lat: 40.50N]
PHD: 54.0F [Tuscarawas Co., Ohio, pop: 93K] [elev: 892 feet] [lat: 40.47N]
ZZV: 54.2F [Muskingum Co., Ohio, pop: 86K] [elev: 899 feet] [lat: 39.94N]
DUJ: 53.4F [Jefferson Co, Pa., pop: 44K] [elev: 1804 feet] [lat: 41.18N]
HLG: 55.8F [Ohio County, W. Va., pop: 42K] [elev: 1194 feet] [lat: 40.17N]
MGW: 56.5F [Monongalia Co., W. Va., pop: 106K] [elev: 1227 feet] [lat: 39.65N]
JST: 52.9F [Cambria Co., Pa., pop: 133K] [elev: 2274 feet] [lat: 40.31N]
AOO: 55.0F [Blair Co., Pa., pop: 123K] [elev: 1467 feet] [lat: 40.30N]
Here is data from the second most populated county in Pennsylvania, at the second busiest international airport in the State, versus data taken from a bunch of small airfields in mostly rural counties. Where is the urban heat island effect in this data? Almost like temperature varies by latitude and elevation, and not by population.
-
Just had a brief snow shower here.
-
I noticed PIT reported some flurries late this morning. I also noticed some frozen precipitation around that time as I was doing yard work, but I couldn't tell if it was light ice pellets or snow flurries - the precipitation was very light, and did not last long.
-
 1
1
-
-
On 4/20/2023 at 8:51 PM, Atomixwx said:
Yeah. It's been very, very warm up this way. I can only imagine how many sets of balls have been sweat off Bradforders to this point.
Sent from my motorola edge 5G UW (2021) using Tapatalk
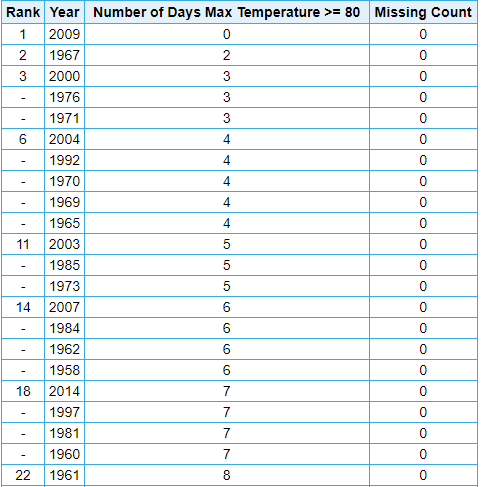
7th 80+ at BFD today. Previously, the earliest date on which 7 80+ readings occurred in a calendar year was May 19, in 1962.
-
1
-
-
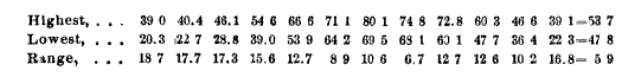
What location do you guys think is warming the fastest due to climate change? I've noticed Burlington, VT seems to be getting hit particularly hard. The current climate there is about on par with what was common in the lower Great Lakes in the late 19th century - early 20th century. But it used to be very, very cold there.
Since 1960, a linear trend line estimates warming at over 9F per century - or just shy of a degree each decade. Again, in the last 5-10 years, the rate of warming seems to be increasing with an abundance of years above even this drastic trend line.
-
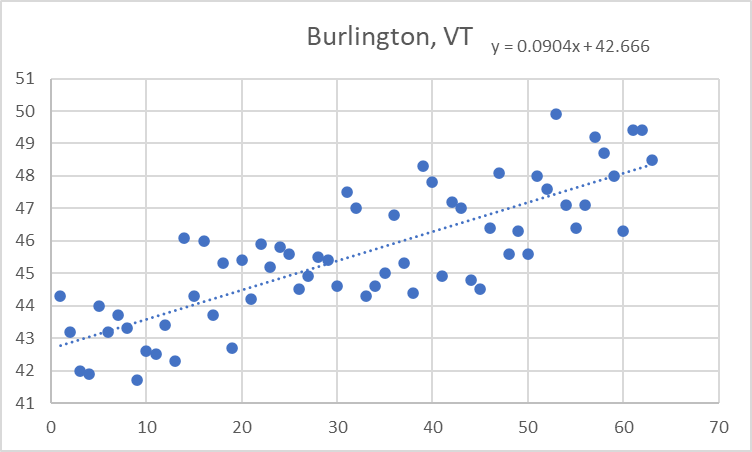
Bradford notched its sixth 80+ reading of the month (not reflected on graphic below), adding to its record-breaking monthly total. Looks like a seventh on tap for tomorrow.
To put that into perspective, there have been 21 Julys (out of 64 years) with 7 or fewer 80+ readings at Bradford. So roughly 1 in every 3 Julys has fewer 80+ degree days than this month.
-
1 hour ago, ChescoWx said:
The loss of nearly 2/3 of the GHCN network since 1970...of which represented rural stations is another overall big problem and biases the data warm...
Even if true, what difference does that make when you've offered no proof that rural locations are cooler or warming less? Here are several examples - zero evidence that the trend is any different for the rural locations than the urban locations.
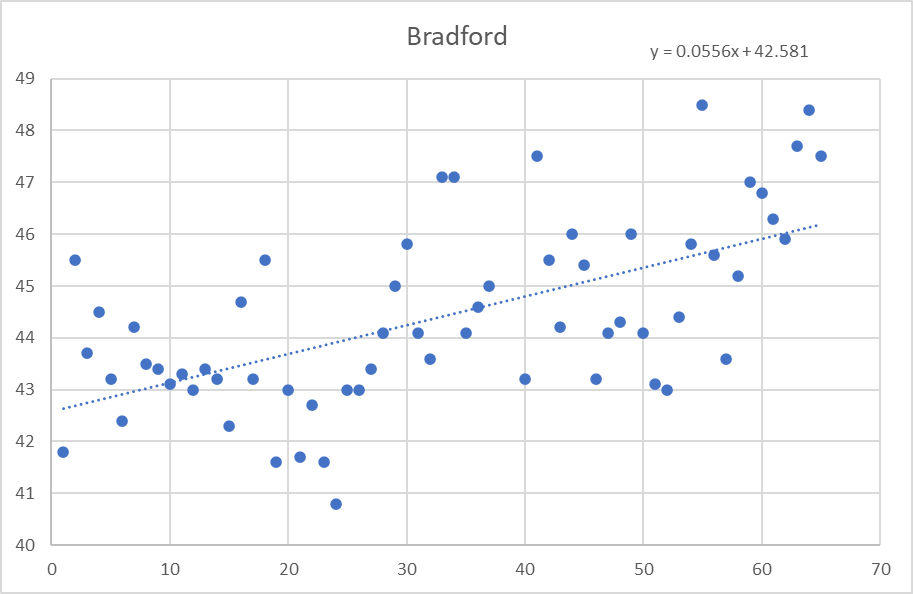
Bradford, PA [McKean Co. population: 40k] - warming at 5.6F/century since 1958
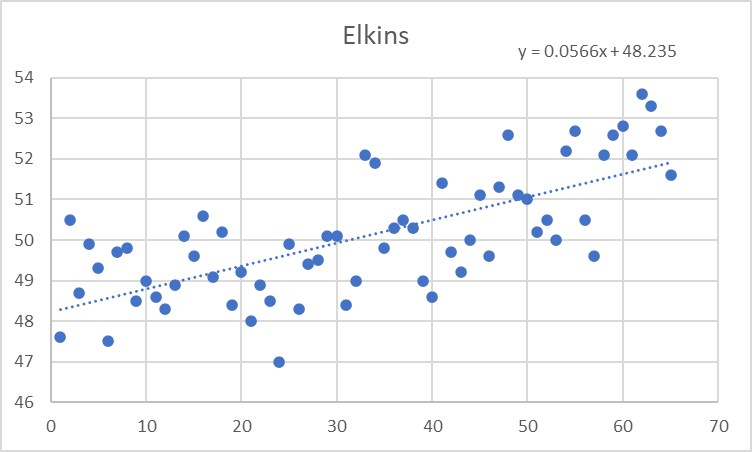
Elkins, WV [Randolph Co. pop: 27k] - warming at 5.7F/century since 1958
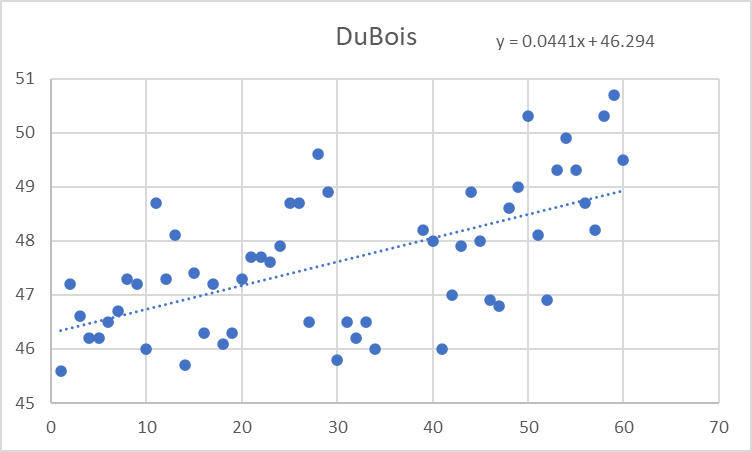
DuBois, PA [Jefferson Co. pop: 44k] - warming at 4.4F/century since 1963 [no earlier data]
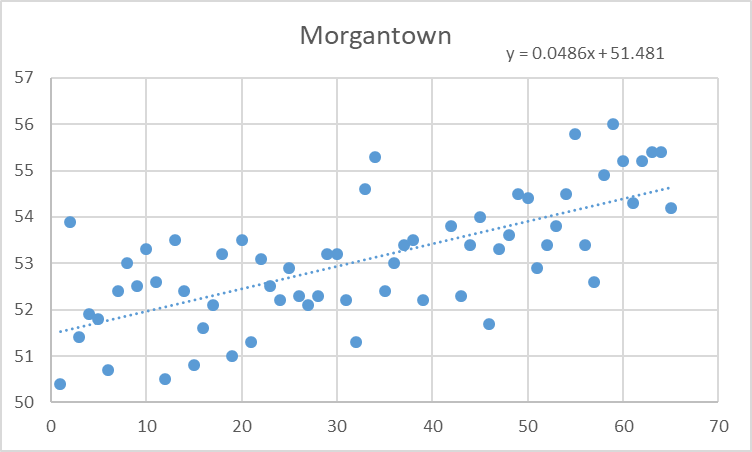
Morgantown, WV [Monongalia Co. pop: 105k] - warming at 4.9F/century since 1958
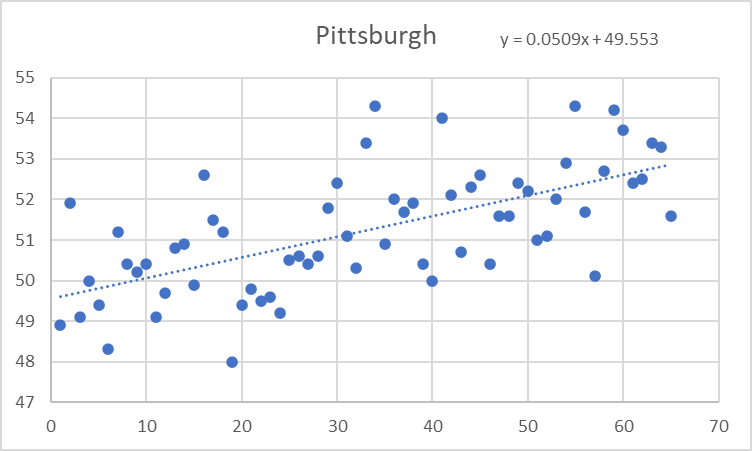
Pittsburgh, PA [Allegheny Co. pop: 1.25M] - warming at 5.1F/century since 1958
-
1
-
-
Yes, I took a look at this recently and couldn't find any evidence of an urban heat island effect when comparing Pittsburgh to a few small towns in the northern Appalachians and Allegheny Mountains. Probably most alarming is the warming is approaching 6F per century, but it's actually accelerating rapidly (evidenced by the fact that recent years are almost exclusively above what would be predicted by the linear trend line).
Since 1958, Elkins, WV has warmed at 5.7F/century. The population of Elkins is 6,950, and Randolph County is 27,932 as of the 2020 census.
Since 1958, Bradford, PA has warmed at 5.6F/century. The population of Bradford is 7,849, and McKean County is 40,432 as of the 2020 census.
Since 1958, Pittsburgh, PA has warmed at 5.1F/century. The population of Pittsburgh is 302,971, and Allegheny County is 1,250,578 as of the 2020 census.
Since 1963, DuBois, PA has warmed at 4.4F/century. The population of DuBois is 7,510, and Jefferson County is 44,492 as of the 2020 census. DuBois is located in Clearfield County [pop: 80,562], but the airport is in Jefferson County.
I can't see an urban heat island effect in this data. These are pristine mountain towns surrounded by national and state forests and park lands - some of the most rural areas east of the Mississippi River. Much, much more rural than Chester County, PA [pop: 534,413], which is the 7th most populated county in the State of Pennsylvania.
-
 1
1
-
-
13 hours ago, donsutherland1 said:
Good charts. It's mostly climate change. I've added Climate Central's instant attribution maps to my above comment.
Don,
I think what’s even more concerning than the fact it’s warming at a rate of 5-6F/century over the last 65 years at these locations is the fact that, looking at the data, it’s clear there’s an accelerating increase. If the linear trend line was actually explaining all of the trend, you’d expect data points to be distributed equally above and below it throughout the period covered by the trend line. Instead, in recent years, the vast majority of temperatures are exceeding what would be predicted by the linear trend. Looks like we may be warming at an instantaneous rate of 7 or 8 degrees per century now. But it would take a couple decades to confirm that.
-
2
-
-
Just now, donsutherland1 said:
In the big cities, UHI and climate change amplify the warmth. But in cities like New York that have a mature urban footprint, climate change is responsible for most of the recent warming.
Today’s heat was made 1.4-4 times more likely due to climate change based on Climate Central’s instant attribution algorithm. Globally, there’s little doubt that climate change is responsible for most of the observed warming.
Interesting, I decided to take a look at this phenomenon with an open mind and selected three remote, rural towns in the mountains mostly surrounded by state and national forest and parkland. And compared them to the records at nearby Pittsburgh. Can't find any evidence of an urban heat island amplifying the warming at Pittsburgh. If anything, as I surmised, the rural locations look to be warming slightly faster.
Here is the comparison. All since 1958, except for DuBois [where records extend only to 1963]. Rounded to the nearest tenth of a degree, I found Bradford to be warming at 5.6F per century; Elkins warming at 5.7F per century; Pittsburgh warming at 5.1F per century; and DuBois warming at 4.4F per century.
-
3
-
1
-
-
59 minutes ago, donsutherland1 said:
Today was a historic day for early heat in New England. Hartford tied its April record high and established New England's earliest 95° or above reading on record.
Records included:
Albany: 89° (old record: 83°, 1938 and 1968)
Allentown: 88° (old record: 87°, 2018)
Bangor: 76° (old record: 74°, 1949)
Binghamton: 85° (old record: 79°, 1968)
Boston: 83° (old record: 81°, 1945)
Bridgeport: 87° (old record: 73°, 1949) ***Hottest temperature so early in the season***
Concord: 90° (old record: 84°, 1870)
Hartford: 96° (old record: 82°, 1941) ***Tied monthly city and state record; Earliest 95° temperature in New England***
Islip: 84° (old record: 73°, 1977, 2002, and 2022)
Manchester, NH: 91° (old record: 79°, 2014)
Mount Pocono, PA: 84° (old record: 82°, 1941)
New York City-Central Park: 91° (old record: 85°, 1941) ***Earliest 2 consecutive 90° days***
New York City-JFK Airport: 82° (old record: 78°, 1949)
New York City-LaGuardia Airport: 89° (old record: 84°, 1941)
Newark: 93° (old record: 88°, 1941 and 2022) ***Earliest 93° or above reading on record***
Portland: 79° (old record: 77°, 1941)
Poughkeepsie: 91° (old record: 88°, 1941)
Providence: 87° (old record: 83°, 1945)
Scranton: 91° (old record: 84°, 1968) ***Earliest 90° reading on record***
Syracuse: 86° (old record: 83°, 1968)
Worcester: 90° (old record: 79°, 1938) ***Earliest 90° reading on record***Cooler weather will follow. Tomorrow will be variably cloudy with some showers. Readings will top out in the middle and perhaps upper 60s. Next week could even see a day where readings struggle to get out of the 50s.
Overall, warmth appears likely to define April in much of the East. If the long-range guidance is accurate the first three weeks of the month could put April 2023 on a trajectory that could rank it among the 10 warmest Aprils on record in the northern Middle Atlantic region. Afterward, the latest EPS weeklies suggest that the month could finish with near normal readings.
The most recent April case to rank among the 10 warmest was:
Boston: 51.7°, 2019 (5th warmest)
Bridgeport: 54.0°, 2017 (1st warmest)
Islip: 51.9°, 2019 (6th warmest)
New Haven: 50.8°, 2022 (6th warmest)
New York City-Central Park: 57.2°, 2017 (2nd warmest)
New York City-JFK Airport: 55.1°, 2017 (2nd warmest)
New York City-LaGuardia Airport: 57.6°, 2017 (2nd warmest)
Newark: 57.2°, 2017 (4th warmest)
Philadelphia: 59.0°, 2019 (3rd warmest)
Poughkeepsie: 53.0°, 2017 (3rd warmest)
White Plains: 53.9°, 2017 (2nd warmest)The ENSO Region 1+2 anomaly was +2.7°C and the Region 3.4 anomaly was 0.0°C for the week centered around April 5. For the past six weeks, the ENSO Region 1+2 anomaly has averaged +1.77°C and the ENSO Region 3.4 anomaly has averaged -0.03°C. Neutral ENSO conditions will likely prevail through at least mid-spring. El Niño conditions will likely develop during the summer.
The SOI was -9.52 today.
The preliminary Arctic Oscillation (AO) was -0.047 today.
On April 12 the MJO was in Phase 6 at an amplitude of 2.004 (RMM). The April 11-adjusted amplitude was 2.033 (RMM).
Based on sensitivity analysis applied to the latest guidance, there is an implied 94% probability that New York City will have a warmer than normal April (1991-2020 normal). April will likely finish with a mean temperature near 57.5° (3.8° above normal). That would rank as the second warmest April on record.
Very impressive, Don. I noticed Bradford, PA reached 86F / 30C at over 2100 feet of elevation, setting a new monthly record (after tying the record of 85 yesterday which was set last year and twice in 1990). There are many years in Bradford where the thermometer has failed to reach 86F / 30C over the entire year. If that had mixed down to the surface, I think we would have been looking at widespread low to mid 90s in the lowlands, with maybe upper 90s in the urban corridor.
As an aside, I feel it weird many people say urban heat island effect is responsible for all or part of the warming trend. To me, anyways, it feels like the remote forested mountain locations like Bradford, Pa. are warming faster than anywhere else in recent years. Just not seeing much evidence of an urbanization effect on the trend.
-
2
-
-
7 minutes ago, Bubbler86 said:
One sort of weather related thing here....Wasps/Yellow Jackets are much more prevalent this spring. Have not had any attack me but a lot of them around.
Yeah, awful around here too. Never seen this in April. Must be the mild winter. Kind of related, but I was reading the Lakes & Midwest forum and someone from Minnesota was noting the start of tick season. I wish we had a no-tick season in this subtropical wasteland of a state. My dog was coming out of the woods just covered in those nasty things all winter long.
-
21 hours ago, TheClimateChanger said:
Bradford reached 85, tying the all-time record for the month of April, set previously on April 24, 2022, April 27, 1990, and April 28, 1990.
Bradford reached 86 degrees today, setting a new all-time April record high. There are many years where it doesn’t even reach 86 all summer long in Bradford. The airport is at 2106’, not far from the NY line. If we had mixed all the way to that layer, we would have been looking at widespread low to mid 90s today in the lowlands.

Pittsburgh/Western PA Spring 2023 Discussion
in Upstate New York/Pennsylvania
Posted
So, I was sharing some information about Pennsylvania climate from the 19th century. Thought I should share this information here too.
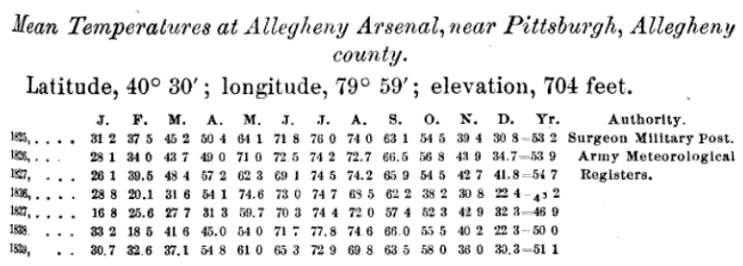
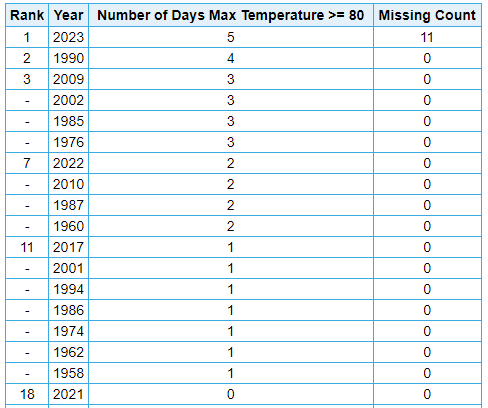
These Allegheny Arsenal (Lawrenceville, Pittsburgh, PA) records are just absolutely lit.
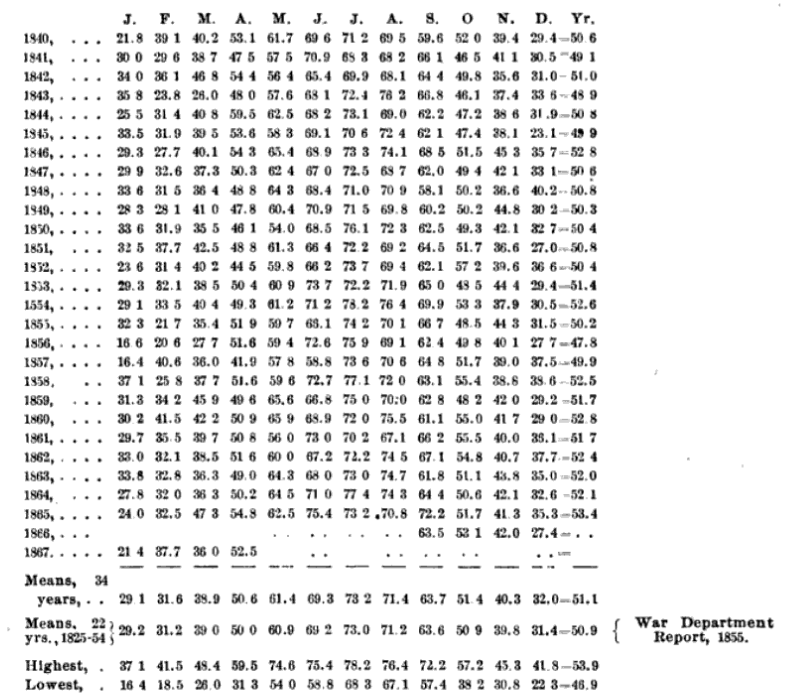
You can probably ignore the data from 1825-1827, which is oddly much warmer than the rest of the records. The period from October 1836 through April 1837 is absolutely insane. And these are from 704', adjacent to the Allegheny River (or about 500' below PIT airport). The overall means [around 51F] aren't too far from the 1991-2010 mean for PIT airport [51.8F], but again these are 500' lower in elevation and somewhat to the south within the boundaries of the present-day city of Pittsburgh [Lawrenceville was a separate borough at the time]. The elevation difference would account for about 1.5F of warming relative to the airport, even ignoring the change of latitude. The mean at PIT airport probably would have been about 49-49.5F at this time. But even this seemingly minor cooling would rewrite the record books - 48.2F in 1836, 46.9F in 1837, 49.1F in 1840, 48.9F in 1842, 47.8F in 1856 would all be among the five coldest in the modern records.
For the record, these were calculated by three daily readings - 7 am, 2 pm, and 9 pm. Probably local solar time, as I believe this predates even standard time zones [and far predates daylight saving time]. I was curious how these would compare to modern means computed from max & min, and I looked at the data for 2011 using the hourly averages reported in each monthly LCD for 7 am, 2 pm, and 9 pm (standard time) and determined the difference is negligible [in that year, this method would have produced a warming bias of 0.3F for the yearly mean]. Obviously, you'd want to take a look at more data to confirm, but it looks like a small bias - and a positive one at that. So these readings are not being artificially cooled by the methodology. The biggest warm bias is in the early summer, because the 7 am standard [8 am EDT] / 7 am local solar time reading would be a couple hours after sunrise and miss the actual low.
Anyways, the 1836-1837 is absolutely insane. This is what has been stolen from us snow lovers. People don't realize how cold it was, and how big of a difference just a couple degrees can really make. I mean we were probably perilously close to tipping into an ice age with these conditions.
October 1836: 38.2F [The coldest in the modern record is 45.9F, or 7.7F warmer than this reading!]
November 1836: 30.8F [The coldest in the modern record is 33.1F, or 2.3F warmer than this reading!]
December 1836: 22.4F [Would tie 1963 for 2nd coldest in the modern record]
January 1837: 16.8F [Would be the 2nd coldest in the modern record]
February 1837: 25.6F [Would tie 20th coldest in the modern record]
March 1837: 27.7F [Would be 2nd coldest in the modern record -- current 2nd place at 31.0F]
April 1837: 31.3F [The coldest in the modern record is 43.8F, or 12.5F warmer than this reading!]
The April 1837 reading probably appears impossible at first glance, but given the temperatures of the preceding six months, there must have been a massive snow cover in place at the end of March 1837 that gradually melted off throughout April offsetting the extreme sun angle.
There's a lot of support for this extreme cold. Cosiguina erupted in 1835, dropping global temperatures by .75C. June 28, 1836 is the only time snow occurred in Sydney, AU when one inch fell. People have no idea how cold it used to be, or how cold the natural climate should be. We should be teetering on the edge of a new ice with a series of major volcanic eruptions.
Next time someone complains about how cold it is in spring, just remember it used to be possible to have subfreezing temperatures in April at the latitude of Pittsburgh less than 200 years ago.