

TheClimateChanger
-
Posts
1,882 -
Joined
-
Last visited
Content Type
Profiles
Blogs
Forums
American Weather
Media Demo
Store
Gallery
Posts posted by TheClimateChanger
-
-
On 6/30/2022 at 11:19 AM, Hoosier said:
More colorful this week

Wow, I didn't realize how dry it's been over such a large expanse. I was just looking at the numbers since around June 14/15, and parts of multiple states have seen essentially no rainfall over that period. Erie, PA (0.02"), several sites in Indiana with only a few hundredths of an inch, Detroit, MI (0.11"). Most sites under a quarter of an inch, with a few 1"+ but those were generally from one or two hit-or-miss events over that stretch. Even in eastern IA, it looks better with 2"+ generally but almost all of that from a single day. And other locations (i.e., Burlington) show little if any rain over that stretch (0.17"). The dryness extends all the way into western New York - Buffalo has had less than 1/3 of an inch since June 9.
-
2 hours ago, Bubbler86 said:
I figured something was wrong with their reporting page as it only shows 88. (Edit-I think I think I see why, the 88 is 8 hours from the previous report)

No, the NWS website simply didn't report the 19:56 observation, which is the METAR in which the 6-hour maximum would have been reported.
Here is the missing observation showing a high of 32.8C:
KCXY 302356Z 00000KT 10SM CLR 31/12 A3012 RMK AO2 SLP197 T03110122 10328 20306 55003
-
 1
1
-
 1
1
-
-
18 hours ago, bluewave said:
Newark is similar to much of NJ south of the I-78 corridor with the warm departures this month. There is plenty of concrete around LGA and they have a colder than average departure. The warmest part of the region has been near Bradford, PA at +2.9° which is more rural. So just a combination of local and regional effects with the omega block. Newark can heat up very quickly with a warm downslope flow. LGA has had quite a bit of onshore flow influence. Bradford, PA is closer to the ridge axis.

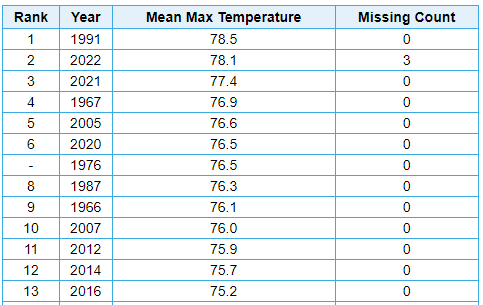
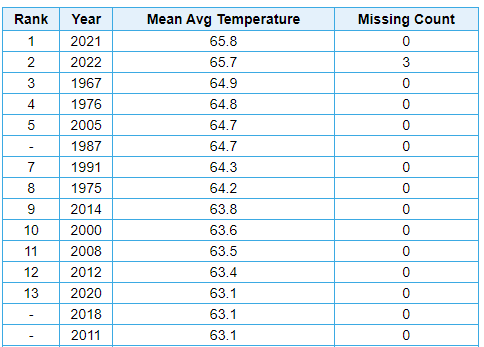
Good post. Bradford reached 90 on June 16, and a whopping 93 on June 22. Also an 89 degree reading on June 21. Prior to this year, the warmest June reading dating back to 1958 (when observations began at the airport) was 89, set in 2021 (June 29), 1994 (June 15 & 17), and 1988 (June 25). Who would ever think that Bradford (at 2105' elevation) would have more 90+ days than Central Park in June, and a maximum monthly reading 3 degrees higher? Even the mean maximum is only 0.4F lower.
-
1
-
-
1 hour ago, RitualOfTheTrout said:
How did everyone fair with the storms yesterday? I was in Wexford and it was pretty mild, but at home I got blasted. Tree limbs everywhere, power outage, fence was crushed by a tree in one section, garbage cans with trash bags in them blown over and the bags blown out. I’m not far from that BP that had the gas pump blown over. Must have been a microburst or something.
Wasn't too bad IMBY. The (empty) garbage cans did blow around a bit, but I didn’t see any tree limbs down or anything like. It did rain quite heavily for a time, which was somewhat needed as the heat and sun had dried things out a lot (and it looks like rain is going to be limited for the next week or so). -
17 hours ago, Ahoff said:
Oddly, I feel like KPIT's is too low, lol.
I don't know. It is a little weird. I saw Bradford (2106' feet near the NY border) was 93 degrees yesterday. That was the highest June temperature ever recorded at the airport, dating to 1958. Actually beat the record of 90 set just last by three degrees. Just goes to show how hot it was aloft yesterday. I saw some of the models had H85 temps up to 23C yesterday.
-
93 degrees at Bradford today (elevation: 2106'). That's the highest temperature ever recorded there in the month of June dating back to 1958. Surpassed the previous monthly record of 90 set one week ago today by a whopping three degrees! The table below hasn't been updated for today's reading, and shows the highest temp as 90F from earlier this month.
Edit: Also ties 3 other dates for the 5th highest temperature of any month. Bradford reached 97 on July 22, 2011; 97 on July 16, 1988; 95 on July 21, 2011; 94 on July 8, 1988; 93 on July 7, 1988; 93 on July 6, 1988; and 93 on August 2, 1988. No other readings since 1958 have exceeded 92 degrees.
1 2022 90 9 2 2021 89 0 - 1994 89 0 - 1988 89 0 5 2020 88 0 - 2018 88 0 - 2012 88 0 - 2011 88 0 - 1991 88 0 - 1968 88 0 11 2017 87 0 - 2005 87 0 - 1993 87 0 - 1987 87 0 - 1969 87 0 - 1966 87 0 - 1964 87 0 - 1963 87 0 19 2013 86 0 - 2008 86 0 - 2007 86 0 - 2003 86 0 - 2001 86 0 - 1999 86 0 - 1998 86 0 - 1990 86 0 - 1975 86 0 - 1967 86 0 - 1959 86 0 30 2019 85 0 - 2006 85 0 - 2004 85 0 - 2002 85 0 - 1984 85 0 - 1981 85 0 - 1976 85 0 - 1973 85 0 38 2016 84 0 - 2015 84 0 - 2014 84 0 - 2010 84 0 - 2000 84 0 - 1997 84 0 - 1989 84 0 - 1986 84 0 - 1971 84 0 - 1965 84 0 48 2009 83 0 - 1980 83 0 - 1978 83 0 - 1974 83 0 - 1961 83 0 53 1992 82 0 - 1983 82 0 - 1979 82 0 - 1977 82 0 - 1970 82 0 - 1962 82 0 - 1958 82 0 60 1960 81 0 61 1972 80 0 62 1982 79 0 63 1985 77 0 1996 M 30 1995 M 30 -
2
-
-
High was 94 at 2:59, low was 71 exactly one hour later.
-
1
-
-
3 hours ago, Hoosier said:
Wonder if anybody in the OV makes it to 100 today.
Well just outside the Midwest but within the Upper Ohio Valley, Beaver Falls, Pennsylvania reached a temperature of 98F. But that's an AWOS, so probably needs an asterisk:
https://w1.weather.gov/data/obhistory/KBVI.html
Highest hourly heat index on any date in the month of June on record at the Youngstown-Warren Regional Airport (dating to 1947) of 105F at 3 PM today, breaking the record of 104F set just week ago.

-
I went to the website cited in that article and generated this for KPIT. It uses available hourly data for the temp and dew point to generate a heat index. Extends back to 1945. According to this, since 1945, the maximum hourly heat index at PIT was 106F observed at 2 PM on June 27, 1978. Last week's heat wave tied the highest recorded heat indices for any June day (dating to 1945) for the 8 PM hour (96F) and 10 PM hour (91F). Keep in mind since this is based solely on hourly data, there could be a higher intra-hour reading.
Here's the link: https://mesonet.agron.iastate.edu/plotting/auto/?_wait=no&q=153&network=PA_ASOS&zstation=PIT&month=jun&var=max_feel&_r=t&dpi=100&_fmt=png

-
2
-
-
Just heard a rumble of thunder here. Looks like we are going to get some much needed relief from the heat.
-
The ever a few degrees too hot sensor at Beaver County Airport in Chippewa Township is up to 96F.

-
1 hour ago, Ahoff said:
Heat Index of 99 also, maybe should have had a heat advisory, as it may still reach that 100 mark.
Edit: in an off hour it hit 92. Tied for the warmest day so far.
Also, a wild gradient is set up. 90s here, and 68 in Philly. Not something you see everyday.
It's a little bizarre really. The heat index at Youngstown is up to 105F, which is the highest heat index on record at that location in the month of June - surpassing the record of 104F set just last week. And there's not even a special weather statement, or mention in the hazardous weather outlook, let alone a heat advisory? It's difficult enough to realize heat advisory conditions around here.
Source for record heat index (dating to 1947): https://www.wkbn.com/weather/heat-index-wednesday-hottest-in-at-least-75-years-in-june/
Current heat index is 105F (93F/75F temp/DP): https://w1.weather.gov/data/obhistory/KYNG.html
-
HRRR says upper 90s possible downtown tomorrow, with mid 90s around the airport. Would normally say these readings are unlikely but given upstream readings (was 100F in Toledo today), I'd say these aren't unreasonable.

-
1 hour ago, TheClimateChanger said:
As of the 5 pm climate report, it appears to have stalled out at 99F. Interestingly, there was a 38F diurnal range (99F/61F). There was also a 38F diurnal range on June 21, 1988, when it hit 100F. Unusual to see a below normal low temperature on a day when the high is approaching 100 degrees.
Update… late day highs at Toledo and Cleveland. Toledo did reach 100, tying the record from 1988. Cleveland reached 95, matching the record set in 1941.
Very similar spread to 1988 at Toledo. 100/61 today versus 100/62 on 6/22/1988. Tied the earliest 100+ reading at Toledo, and the low was one degree below normal for the date.
-
2 hours ago, TheClimateChanger said:
Up to 98 degrees in Toledo, Ohio. Could be the first 100 there since July 7, 2012. If it does reach 100F, it would tie the daily record from 1988. It would also tie June 21, 1988 as the earliest 100F+ reading on record in Toledo.
As of the 5 pm climate report, it appears to have stalled out at 99F. Interestingly, there was a 38F diurnal range (99F/61F). There was also a 38F diurnal range on June 21, 1988, when it hit 100F. Unusual to see a below normal low temperature on a day when the high is approaching 100 degrees.
-
Up to 98 degrees in Toledo, Ohio. Could be the first 100 there since July 7, 2012. If it does reach 100F, it would tie the daily record from 1988. It would also tie June 21, 1988 as the earliest 100F+ reading on record in Toledo.
-
Another 90 in Dayton. That's 5 this month, plus one 89F high temperature. Looks like a near certainty that there will be at least 3 more, and potentially as many as 5 more, by Sunday. That will bring the total to between 8 and 10 for June with several days remaining. Spartman must be thrilled.
-
Oh and I found copies of all of the 1895 Monthly Weather Review publications, which weren't scanned in by NCDC. They were published by the Franklin Institute and appear as an appendix to their annual report, accessible from the link below. These also have daily precipitation records, but not temperature or snowfall. Only monthly. The missing 1893, 1894, and 1896 reports can also probably be found using a similar search term on Google Books, but I didn't try to do so.
-
12 minutes ago, ChescoWx said:
Fantastic!! I had just finished moving the previous data to a spreadsheet for all of the Chesco sites. This looks great!! Did you share a link? if not I will do some digging - thanks again!!
Paul
These were from NCDC's Image and Publication System: https://www.ncdc.noaa.gov/IPS/cd/cd.html
Just select Pennsylvania and choose the month. Unfortunately, Pennsylvania's publications are missing from March 1893 through March 1896 - not sure if that's because the State did not publish one for those months or if the hard copies were lost or destroyed. It looks like the publications begin in September 1887, but Coatesville was not included until March 1888. It was listed in the January and February 1888 publications, but no values published until March of that year. Records for West Chester go back to the inception of the publication.
-
On 5/21/2022 at 6:18 PM, Hurricane Agnes said:
Found the 1888 data. It is in the 1889 Pt. 1 PDF (selectable via a drop-down menu) at NOAA's Signal Corps data at that link - https://library.noaa.gov/Collections/Digital-Docs/Signa-Corps-WB-Annual
Have to scroll down but for example, starting from "pg 254" of Pt. 1, you start to see the individual observer station reports (earlier tables appeared to be the data for full stations that had all the instruments). So the first "Coatesville" reference (just from a quick scan) appears on "pg. 285" (the page number printed on the document) and it appears that the first obs readings started in March of 1888 for monthly/annual mean temp. Then on "pg. 328" are the "max/min/range" temps for Coatesville Mar. - Dec. 1888. Then the piece de resistance - the precip for Mar - Dec. 1888 in Coatesville (doesn't distinguish frozen from liquid, it appears to just be total qpf).
(I blame you for this!


 )
)
He also appears in the Climatological Data reports for Pennsylvania beginning in March 1888, accessible from NCEI. Those reports also include monthly snowfall, which is not included in those Signal Corps reports. At least in the March 1888 report, they did not include daily temperatures and precipitation. But the reports do identify mean temperature, mean maximum temperature, mean minimum temperature, absolute maxima and minima, mean range, and maximum and minimum daily ranges, as well as precipitation, snowfall, sky conditions, and prevailing wind direction.
In March 1888, the mean temperature was reported as 32.3F, with a maximum of 68.5 on the 31st and a minimum of -3 on the 6th. Precipitation totaled 6.28 inches, including 18.5" of snow. Skies were clear on 10 days, fair (partly cloudy) on 12 days, and overcast on 9 days. Prevailing winds were from the west.

-
 1
1
-
-
13 minutes ago, TimB said:
Going to be close but already 76 at PIT. Interesting that this thing was completely dry.
Its not going to hold. The clouds and outflow dropped it enough that I’d be shocked if it didn’t drop to 74. The dew point is also down to 65 (as of the top of the hour) so leaves room to drop some more.
-
1
-
-
31 minutes ago, Homie J said:
We got a severe thunderstorm watch
Surprised it's not a tornado watch, since the Day 1 outlook has us in the 5% zone.
-
4 minutes ago, TheClimateChanger said:
12Z Euro only gets us up to about 84 today. Suffice it to say, that's wrong as it was up to 88 before 1 pm at the airport.
While today's run of the Euro was oddly cool (apparently expecting more cloud cover), the 00z run looks very hot for next week.
-
12Z Euro only gets us up to about 84 today. Suffice it to say, that's wrong as it was up to 88 before 1 pm at the airport.


Pittsburgh/Western PA Summer 2022 Discussion
in Upstate New York/Pennsylvania
Posted
Not sure we will. Most recent run of the HRRR only gets us to around 83F or 84F as it shows cloudiness lingering well into the afternoon. Earlier runs were showing upper 80s but had skies clearing sooner.