

TheClimateChanger
-
Posts
3,506 -
Joined
-
Last visited
Content Type
Profiles
Blogs
Forums
American Weather
Media Demo
Store
Gallery
Posts posted by TheClimateChanger
-
-
-
Flash Flood Warning OHC029-081-PAC003-007-019-073-125-WVC009-029-120430- /O.EXT.KPBZ.FF.W.0006.000000T0000Z-240412T0430Z/ /00000.0.ER.000000T0000Z.000000T0000Z.000000T0000Z.OO/ BULLETIN - EAS ACTIVATION REQUESTED Flash Flood Warning National Weather Service Pittsburgh PA 632 PM EDT Thu Apr 11 2024 The National Weather Service in Pittsburgh has extended the * Flash Flood Warning for... Southeastern Columbiana County in east central Ohio... Northeastern Jefferson OH County in east central Ohio... Allegheny County in southwestern Pennsylvania... Northwestern Washington County in southwestern Pennsylvania... Southern Butler County in west central Pennsylvania... Beaver County in western Pennsylvania... Southern Lawrence County in western Pennsylvania... Brooke County in northern West Virginia... Hancock County in northern West Virginia... * Until 1230 AM EDT. * At 632 PM EDT, local law enforcement reported thunderstorms producing heavy rain across the warned area. Between 0.8 and 1.5 inches of rain have fallen. Additional rainfall amounts of 1 to 2 inches are possible in the warned area. Flash flooding is already occurring. HAZARD...Life threatening flash flooding. Thunderstorms producing flash flooding. SOURCE...Law enforcement reported significant flooding in Oakdale. Roads were closed, and a water rescue occured with a vehicle stuck in flood waters in Oakdale. IMPACT...Life threatening flash flooding of creeks and streams, urban areas, highways, streets and underpasses. * Some locations that will experience flash flooding include... Pittsburgh, Penn Hills, Mount Lebanon, Bethel Park, Ross Township, McCandless Township, Monroeville, Cranberry, Moon Township, McMurray, Weirton, McKeesport, Steubenville, Butler, Franklin Park, East Liverpool, Aliquippa, Canonsburg, Beaver Falls and Monaca. PRECAUTIONARY/PREPAREDNESS ACTIONS... Turn around, don`t drown when encountering flooded roads. Most flood deaths occur in vehicles. && LAT...LON 4090 8052 4096 8051 4083 7969 4033 7984 4026 8030 4034 8079 4090 8054 FLASH FLOOD...OBSERVED FLASH FLOOD DAMAGE THREAT...CONSIDERABLE $$ WM -
7 hours ago, TheClimateChanger said:
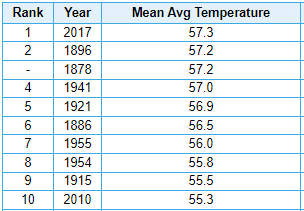
Here are the numbers to beat for a Top 10 warm April. Need to have a final mean temperature at or above 55.3F. KPIT does reasonably well here compared to some other months, with 4 of the current top 10 [1954, 1955, 2010, and the record warmest in 2017].
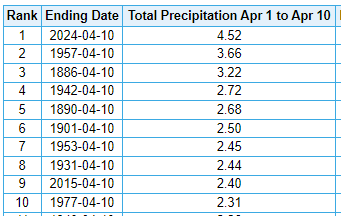
Also, the wettest first 10 days of April on record. This doesn't include the approximately 1/2-inch that's fallen today. We may have a top 10 wettest April on lock by midnight.
Looking at the weather records, there has only been one year with an April among both the 20 warmest and 20 wettest. April 1948 is 13th warmest in the threaded record (54.7F) and fourth wettest (6.03").
-
On 4/10/2024 at 1:25 AM, GaWx said:
TheCCer,
Is the bolded really true?
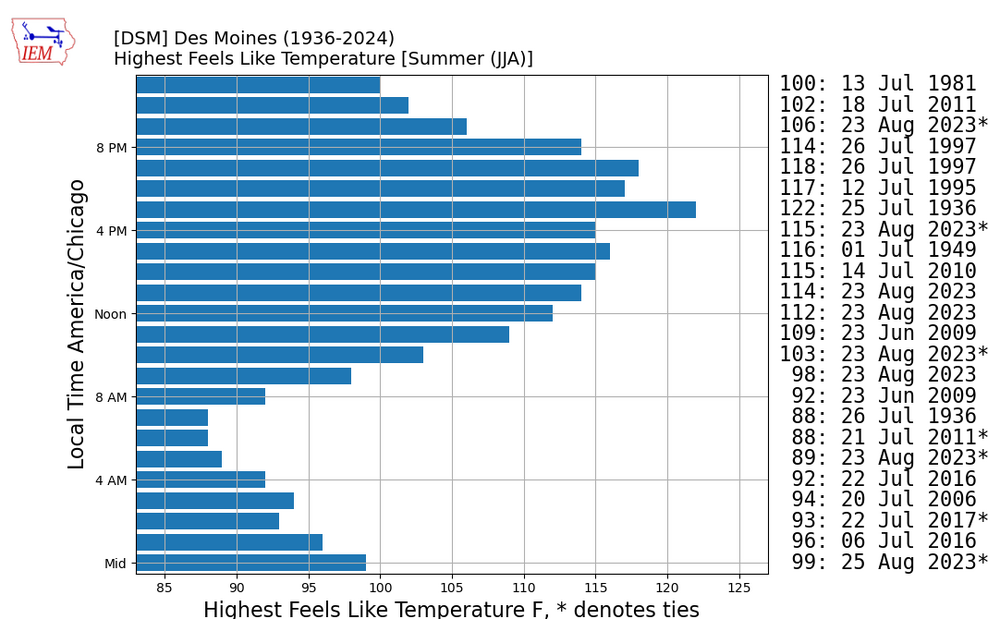
Credit: Chris Kuball for the following Des Moines data from the heart of the Corn Belt
++++++++++++++++
“Out of those top 21 longest stretches of a 100+ Heat Index, only 5 have occurred since 2000.

It does not go back to prior to 1936 but there were several other Dust Bowl years prior to 1936 with extreme heat in IA, as well as previous decades with extreme heat.
Decade and # of times on the list
30's-1(doesn't include the very hot years 1930-35)
40s-1
50s-2
60s-1
70s-4
80s-5
90s-2
00s-1
10s-3
20s-1.
In fact, last year, 2023 getting back up there in the top 21, stopped the longest streak of NOT having a year in the top 21 (11 years from 2012-2023)."
The above doesn't suggest an increase in long dangerously high heat index streaks at Des Moines over the last few decades. If anything, there was a peak in the 70s to 80s.
So, with regard to the longest 100+ HI streaks at Des Moines, where's the beef?
July 1934 was very similar to 1936 at Des Moines, Iowa, albeit a couple of degrees cooler.
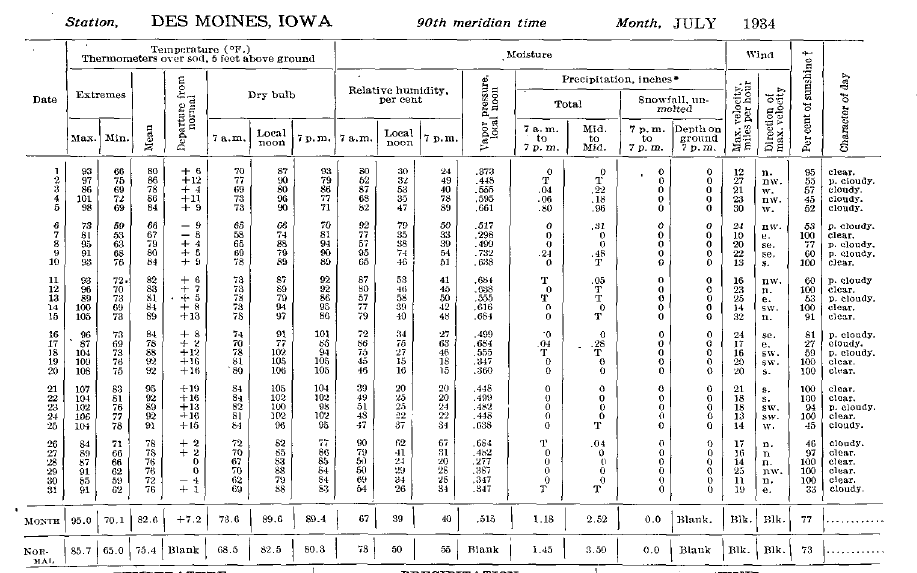
I took the given temperatures and relative humidity values for 7 am, 12 noon, and 7 pm, to create the following tables, for the period from July 14 through July 31. Note that the value for 7 pm on July 16, 1934 (101F) appears to be a scrivener's error, as the observed high temperature was only 96F on that date. It may have been intended to read 91F, but in the table below I had used the given value.
As you can see, there was a stretch of 7 straight days of 100F+ heat indices, which would have nearly certainly extended into the 25th for an eighth straight day if we had more data to confirm. Taken literally, this would also match the 11 of 12 stretch from 1999; however, as noted the value for 7 pm on the 16th appears to be incorrect. And the humidity was otherwise too low for a heat index of 100F or better given the actual high of 96F.
But overall, the heat index values are not that crazy considering this is probably the worst heat wave on record in Des Moines. Heat warning criteria would not have been met on any date. While we think of heat index as additive, most days during this stretch it would have actually resulted in a reading below the dry bulb temperature.
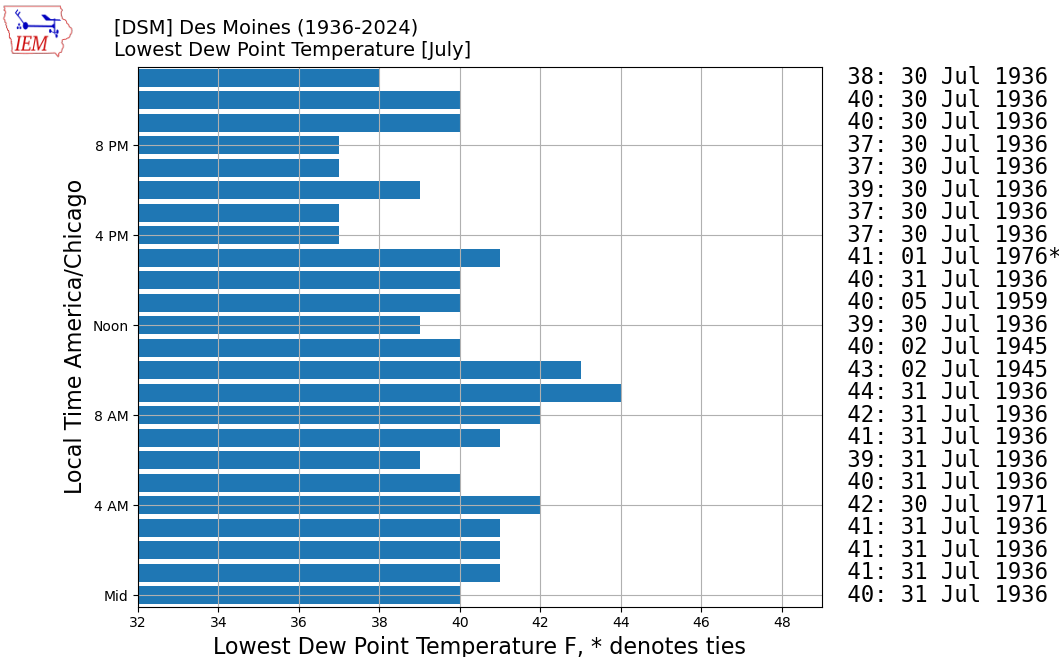
Also, of note, the calculated dewpoint of 39F at 7 pm on the 28th would be among the lowest ever observed at Des Moines in the month of July. There has never been a dewpoint below 40F observed in the month of July since July 30, 1936 (see chart below for lowest hourly readings from 1936 to the present). Even a dew point below 50F would be exceptionally rare today, and yet this value was achieved on numerous dates in this stretch - including some of the record-breaking hot days.
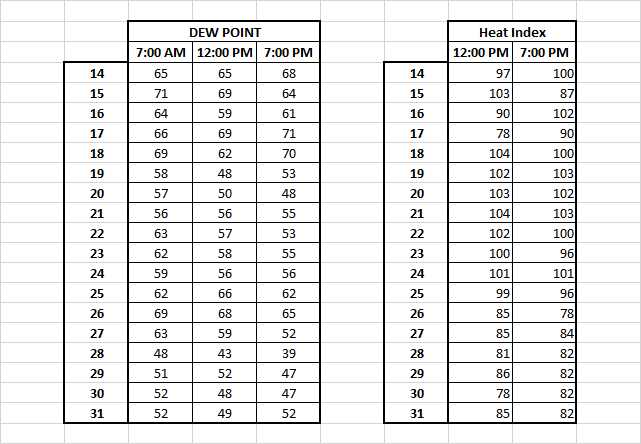
Figure 1. Calculated dewpoints and heat index values at Des Moines, from July 14-July 31, 1934.
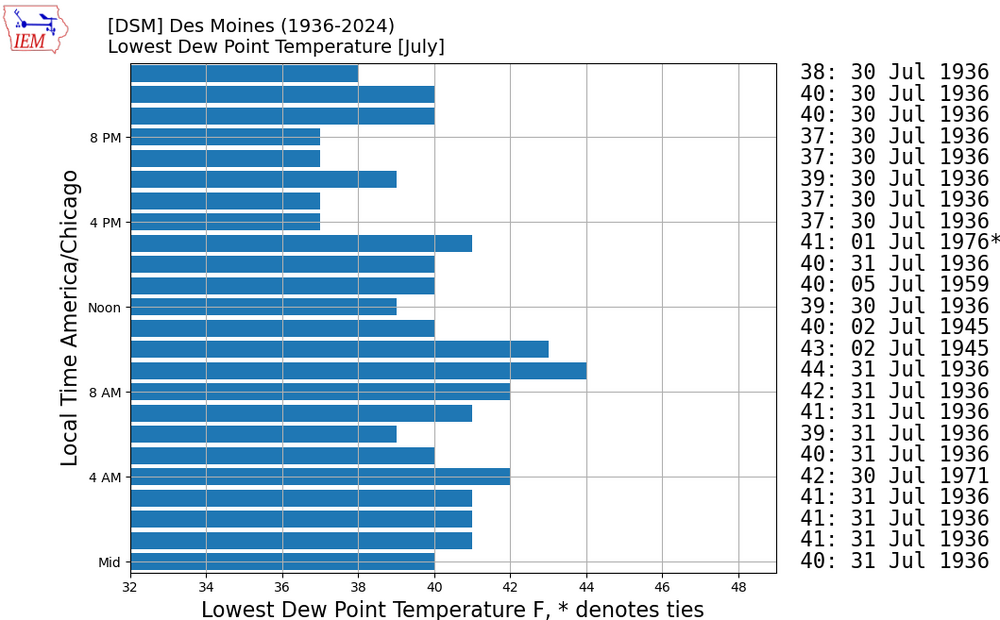
Figure 2. Lowest hourly dew point temperature readings at Des Moines in the month of July (1936-present).
-
Here are the numbers to beat for a Top 10 warm April. Need to have a final mean temperature at or above 55.3F. KPIT does reasonably well here compared to some other months, with 4 of the current top 10 [1954, 1955, 2010, and the record warmest in 2017].
-
Currently running 4.6F above normal for the month, with a mean temperature of 52.2F. A rather pedestrian [compared to some recent periods] 24th warmest overall in the threaded record, and 13th warmest at KPIT, for the first 10 days of April.
With the warm pattern in place, I projected forward through the 17th using the official NWS forecast for KPIT [with an adjustment for tomorrow for a likely midnight high temperature] and found the month to date mean temperature is projected to increase to around 55.9F by April 17th. Should that come to fruition, it would be the 5th warmest April 1 to April 17th period in the threaded record, and second only to 2010 at KPIT. Looks like a decent shot for a top 10 warmest April unless there is a cooldown at the end of the month.
-
13 hours ago, GaWx said:
TheCCer,
Is the bolded really true?
Credit: Chris Kuball for the following Des Moines data from the heart of the Corn Belt
++++++++++++++++
“Out of those top 21 longest stretches of a 100+ Heat Index, only 5 have occurred since 2000.
It does not go back to prior to 1936 but there were several other Dust Bowl years prior to 1936 with extreme heat in IA, as well as previous decades with extreme heat.
Decade and # of times on the list
30's-1(doesn't include the very hot years 1930-35)
40s-1
50s-2
60s-1
70s-4
80s-5
90s-2
00s-1
10s-3
20s-1.
In fact, last year, 2023 getting back up there in the top 21, stopped the longest streak of NOT having a year in the top 21 (11 years from 2012-2023)."
The above doesn't suggest an increase in long dangerously high heat index streaks at Des Moines over the last few decades. If anything, there was a peak in the 70s to 80s.
So, with regard to the longest 100+ HI streaks at Des Moines, where's the beef?
So, yes, to answer your question, I do believe the bolded statement to be true and have presented data to support it. But I should add that I was using extreme values of 105F and 110F. It is true there isn't as significant of an upward trend in hours with heat indices at or above 100F, but these are more run-of-the-mill values for Des Moines in the summertime. I will grant you that consecutive days of 100F+ can be just as dangerous, but the statement you quoted is misleading by focusing solely on consecutive stretches rather than total number of days [plus ignoring increase at higher HX values].
It also inaccurately claims that last year ended the longest stretch with no consecutive periods of 5 days or more with 100F+ heat indices at Des Moines. This is false and rebutted by the very data submitted. There are no such stretches indicated between 1936 and 1949, which is a longer period [13 years] than 2012 to 2023 [11 years].
So I would rate Kuball's statement as misleading, and the claim that last year ended the longest stretch with no 5-day plus heat waves [using consecutive days of 100F+ HX] as pants-on-fire false. The very data he submitted shows the longest stretch to have occurred from July 15, 1936 until June 30, 1949 - a period of nearly 13 years.
-
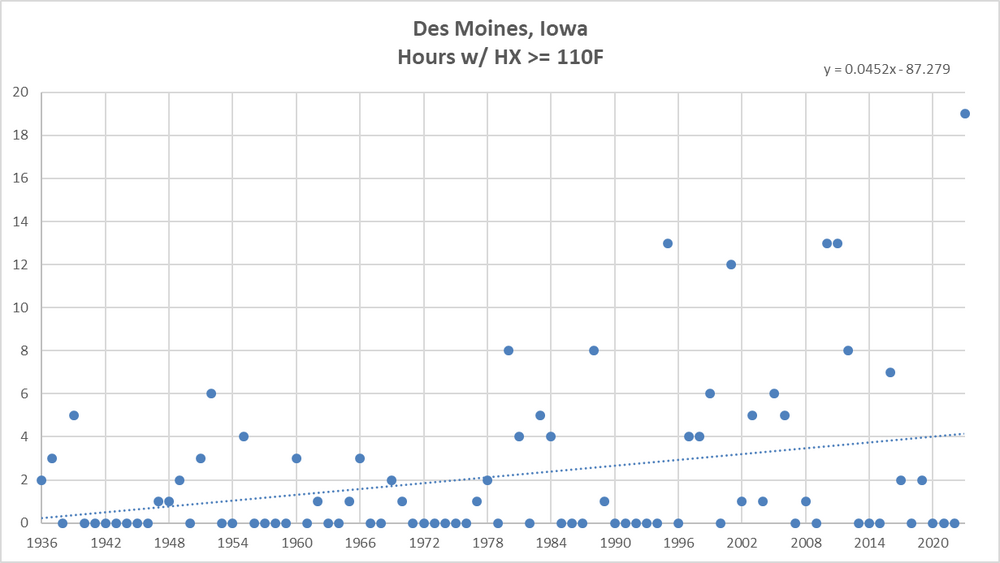
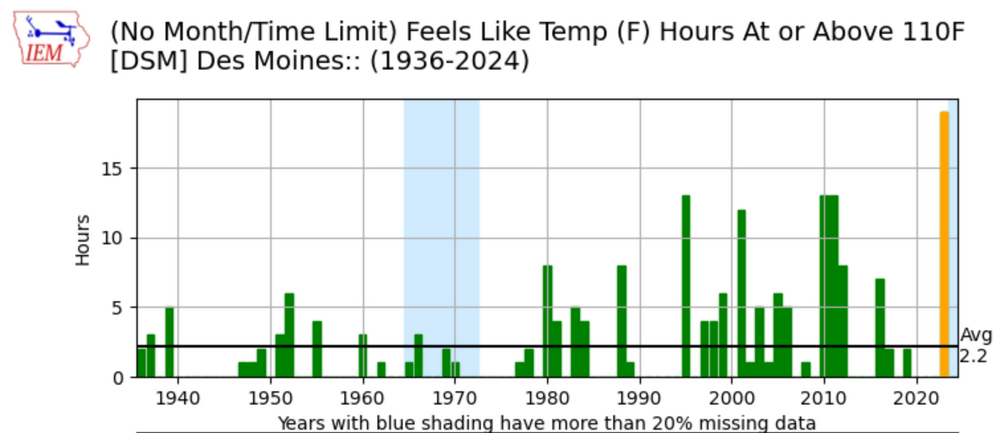
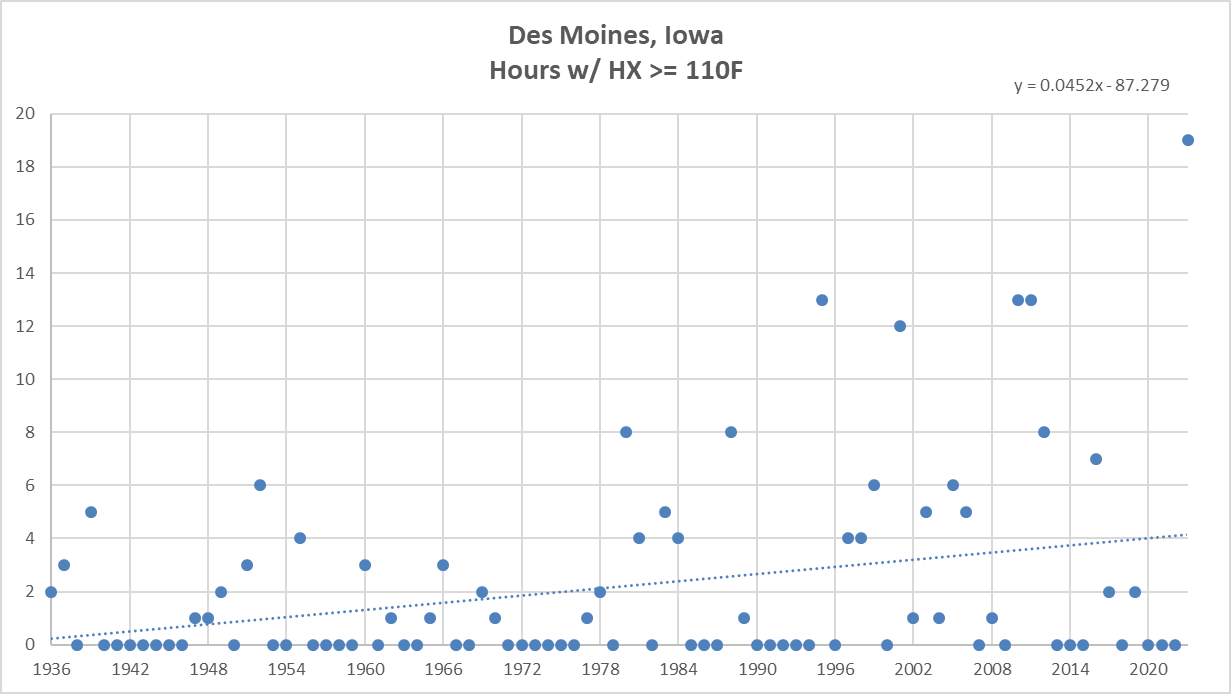
Here is the same data, but with a threshold heat index of 110F [heat warning criteria]. A heat index reading this high was very rare prior to 1980, having not exceeded 6 hours in a year until that year. Since [and inclusive of] 1980, there have been 9 years exceeding 6 hours with heat indices equal to or greater than 110F, and two additional years reaching exactly 6 hours. What happened once in the first 44 years of data has occurred 11 times in the most recent 44 years of data (or 1 out of every 4 years).
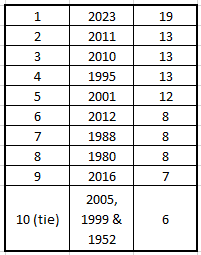
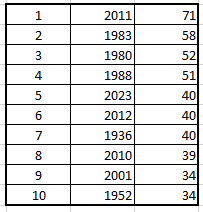
Years with the most hours of heat indices at or above 110F at Des Moines, Iowa. Note last year was nearly 50% higher than any other year of record dating back to 1936.
-
 1
1
-
-
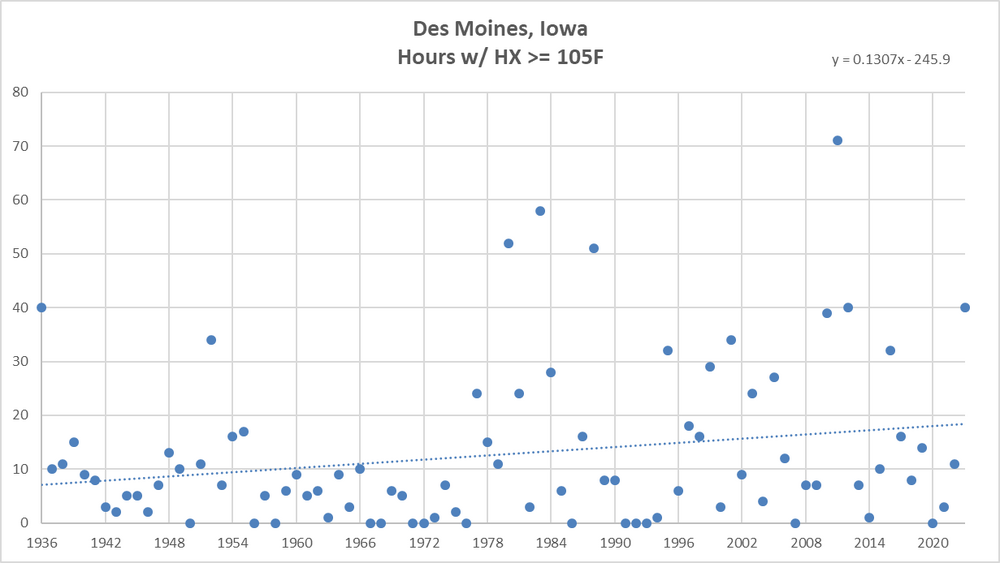
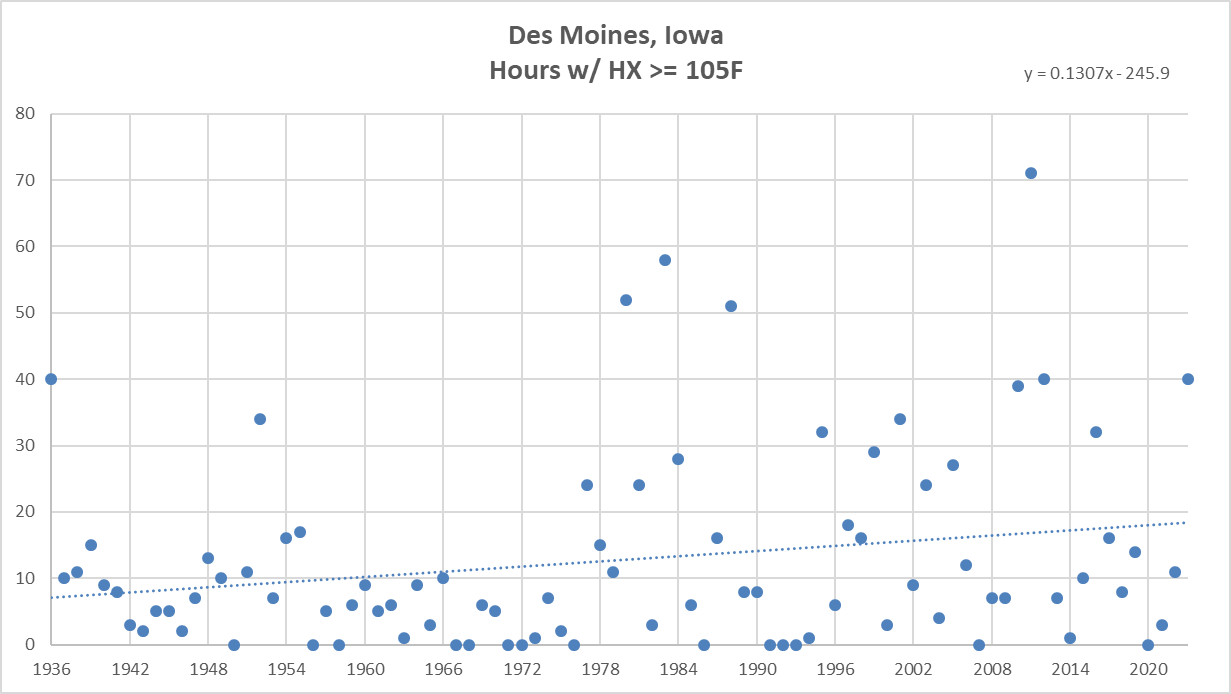
Here's a little more detail on the heat index trends at Des Moines. We can see despite a minimal increase in summertime maxima over the period 1936 to present, the annual hours with a heat index at or above 105F [heat advisory criteria] are increasing at a rate of about 13 hours/year per century on average. For clarification here, the unit of measurement is hours/year - the rate of increase is 0.13 hours/year per year, or 13 hours/year per century.
It is true the 1980s are well represented, but five of the top 10 have occurred since 2001.
-
1
-
-
5 hours ago, GaWx said:
TheCCer,
Is the bolded really true?
Credit: Chris Kuball for the following Des Moines data from the heart of the Corn Belt
++++++++++++++++
“Out of those top 21 longest stretches of a 100+ Heat Index, only 5 have occurred since 2000.
It does not go back to prior to 1936 but there were several other Dust Bowl years prior to 1936 with extreme heat in IA, as well as previous decades with extreme heat.
Decade and # of times on the list
30's-1(doesn't include the very hot years 1930-35)
40s-1
50s-2
60s-1
70s-4
80s-5
90s-2
00s-1
10s-3
20s-1.
In fact, last year, 2023 getting back up there in the top 21, stopped the longest streak of NOT having a year in the top 21 (11 years from 2012-2023)."
The above doesn't suggest an increase in long dangerously high heat index streaks at Des Moines over the last few decades. If anything, there was a peak in the 70s to 80s.
So, with regard to the longest 100+ HI streaks at Des Moines, where's the beef?
The record for 110F+ heat indices was shattered just last summer, with a clear upward trend. Admittedly, 105F is a bit noisier, although the record was set in 2011. Still a long term increase, even factoring in the spike in the 1980s.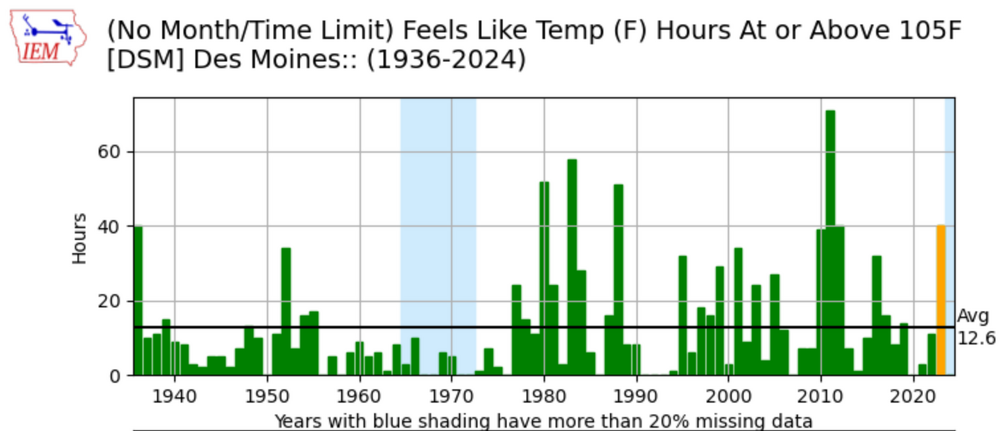
-
1 hour ago, Bubbler86 said:
Guessing MDT made 79 today but will not know for sure until they do the 3 or 6 hour summary. 74 for the high here. They could be 78 or 80 though.
How close to the record? Bradford tied a record of 71F today. DuBois was one degree shy of the record of 76F.
-
The bottom line is this: Even if daytime maxima have decreased slightly in the Corn Belt, humidity has increased substantially moreso. So cooler temperatures should not be read as milder. There has clearly been an increase in the incidence of dangerously high heat indices.
-
1
-
 1
1
-
-
On 4/6/2024 at 5:48 PM, GaWx said:
Charlie,
1) This chart was posted by Chris in his thread on the Midwest warming hole: note the reduced warming or even slight cooling in much of the MW during summer vs most other areas. This is despite large increases in crop sizes.

2) From Midwest pro meteorologist Mike Maguire:“On the albedo of global greening absorbing more sunshine and warming the planet. I can debunk that myth quickly.
We know that the MOST warming is taking place in the coldest places and at the coldest times (higher latitudes during the Winter and at night).
Those are also the times when albedo from the sun has the LEAST impact.”
“The nights (with no sun) have been warming the most, days the least. Also, the driest locations with the lowest humidity are warming the most.
This is because of the radiation physics of CO2 and H2O and not albedo. In areas with the highest water vapor content, water vapor crowds out much of the CO2 absorption from the same bands of absorption. Some of the radiation absorption bands are already saturated from H2O in areas with very high dew points.
In drier areas........which includes ALL cold places, CO2 is able to absorb more long wave radiation because of the absence of H2O absorbing at the same bands.
There's no disputing this proven law of radiation physics!”
Like the deniers always say, cherrypicked. Everybody knows the 1950s had a lot of hot summers.
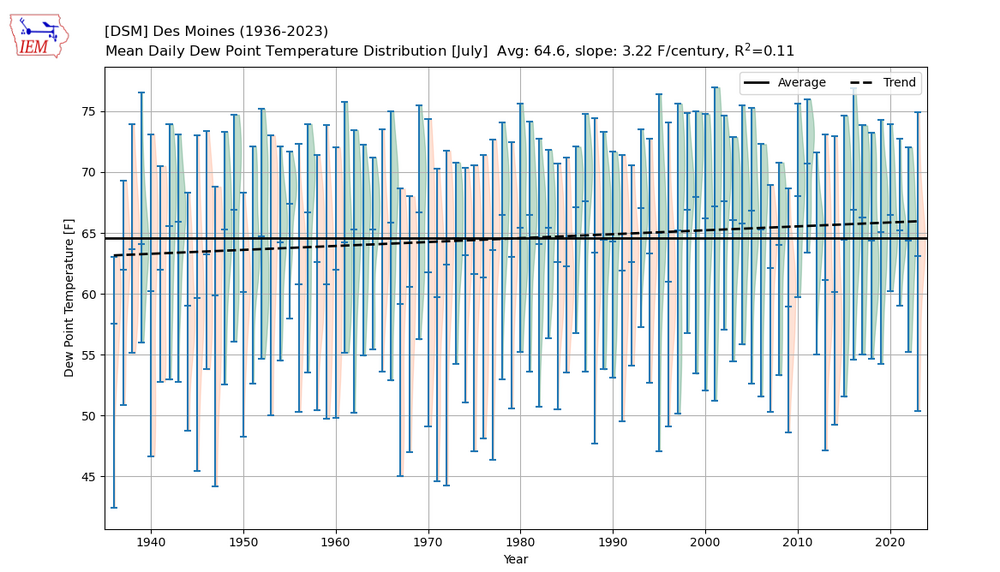
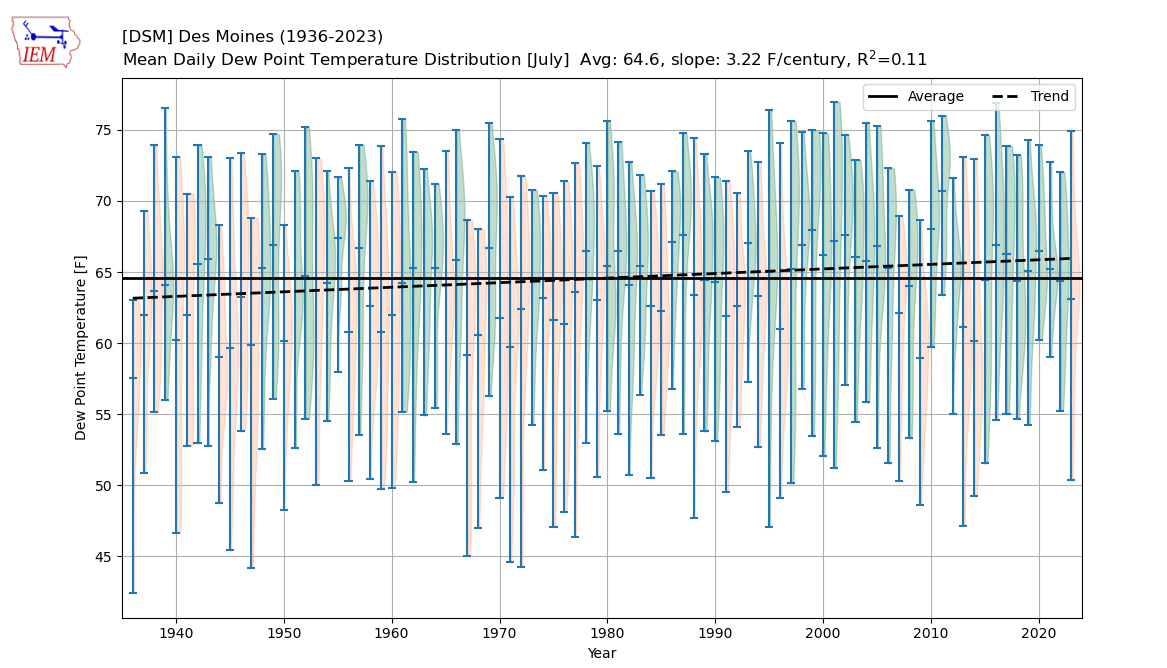
These statements also never account for humidity. The driest July on record in Des Moines was in 1936 (see below), which is also the hottest on record. Remarkably, the average dewpoint was even lower than the very chilly July of 2009, which had the lowest mean dewpoint of any recent years!
In fact, if you look at the highest hourly heat indices on record, you will see they were mostly set just last summer. There was nothing remotely similar to the deadly combination of heat and humidity that occurred last summer during the Dust Bowl. I don't think people realize that, without widespread air conditioning, thousands of people would die each and every summer these days.
In sum, there is no evidence for milder summers in the midwest; rather, dangerous heat and humidity has been on the increase in recent decades.
Note - the 122F from 1936 appears to be erroneous. No other hourly heat index that day was anywhere near that measurement. Appears to be a spuriously high dewpoint reading. Regardless, 8 of the 24 highest hourly heat indices on record in Des Moines were established just last summer. Almost all of the record readings are from this century.
-
1
-
-
Accuweather suggesting we could approach a record high this afternoon. Yinz stay cool aht thar.
-
1 hour ago, TimB said:
Hmm. Is PIT cooking the books?
I think my station runs a little high on the rooftop on sunny days, and also radiates much better than PIT, so it was probably somewhat exaggerated. Looking at 5-minute ASOS observations, looks like falls of 4-6F were common along and near totality. It did drop back to 70F at PIT later in the eclipse, from 71/72F before recovering to 74F.
-
Anyways, certainly looks like April will be another above normal month. Currently, sitting at +2.6F. Looking at the extended outlook, I think we're likely to wind up closer to +5F than to normal.
-
13 hours ago, TimB said:
Went up to northwest PA and watched the total eclipse. Interesting that the partial eclipse didn’t drop the temp at all at PIT, I thought that was expected even at 97% totality. Looks like Erie went 69 to 55 with the eclipse.
My weather station showed a drop of nearly 8F, with solar radiation plunging to less than 5 W/m^2.
-
38 minutes ago, Chinook said:
The temperature dropped from 78 to 72 in northern Arkansas due to the lack of light, also, 82 to 77 at Little Rock
My weather station dropped by nearly 8F and wasn’t even in totality.
-
1 hour ago, nwohweather said:
Really good place to eat!Surprisingly pricy though.
-
1
-
-
Did y’ins catch a glimpse of the sun today?
-
-
4 minutes ago, TheClimateChanger said:
That 47.6F in 1836 is very interesting. I've read in numerous sources of a "great refrigeration" that occurred from about 1835-1838 on par with that of 1816. There was reportedly 2" of snow in Guangzhou [Canton], China in February 1835, suggesting it very well could have been a global [or at least hemisphere-wide] phenomenon.
Berkeley Earth blames it on Cosiguina, which erupted in January 1835, and says there was a global land average temperature drop of 0.75C. However, it doesn't seem strong enough to me for that degree of response.
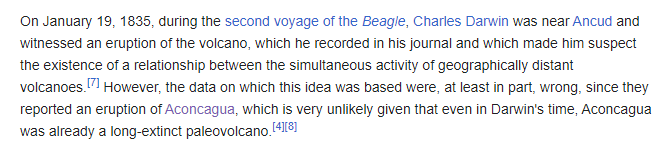
Interestingly, Volcano Osorno apparently erupted in Chile one day prior to the big Cosiguina eruption in Nicaragua. Charles Darwin also believed there was an eruption of Aconcagua, but that's an extinct paleovolcano. Perhaps there was a third eruption in Argentina? Or he just lost his bearings and actually witnessed the eruptions of Osorno and Cosiguina?
-
1
-
-
6 minutes ago, TheClimateChanger said:
Good post, Don. Even more striking when you look at the values observed by the U.S. Army Signal Corps at Fort Columbus [later known as Fort Jay] on Governor's Island, south of Manhattan, from 1821-1854. In that stretch of 34 Decembers, only 2 had a mean temperature in excess of the current normal (41.3, 1829; and 40.4F, 1852). One other year (1848) had a mean right on par with the current normal of 39.3F. While the proximity to water could lead to some cooling in the spring and summer, relative to Central Park, I would assume the proximity to water would lead this site to be warmer in the cold season.
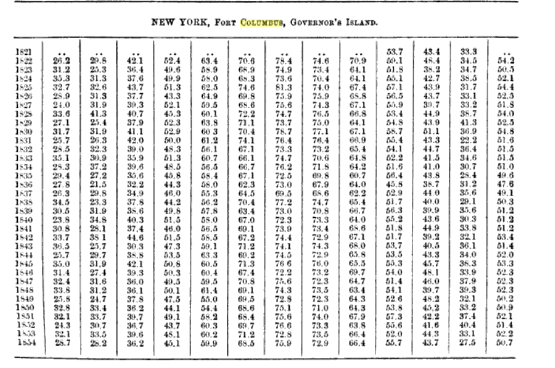
That 47.6F in 1836 is very interesting. I've read in numerous sources of a "great refrigeration" that occurred from about 1835-1838 on par with that of 1816. There was reportedly 2" of snow in Guangzhou [Canton], China in February 1835, suggesting it very well could have been a global [or at least hemisphere-wide] phenomenon.
Berkeley Earth blames it on Cosiguina, which erupted in January 1835, and says there was a global land average temperature drop of 0.75C. However, it doesn't seem strong enough to me for that degree of response.
-
3 minutes ago, TheClimateChanger said:
Good post, Don. Even more striking when you look at the values observed by the U.S. Army Signal Corps at Fort Columbus [later known as Fort Jay] on Governor's Island, south of Manhattan, from 1821-1854. In that stretch of 34 Decembers, only 2 had a mean temperature in excess of the current normal (41.3, 1829; and 40.4F, 1852). One other year (1848) had a mean right on par with the current normal of 39.3F. While the proximity to water could lead to some cooling in the spring and summer, relative to Central Park, I would assume the proximity to water would lead this site to be warmer in the cold season.
On average, I think we can surmise that the mid 19th century climate of New York would have been comparable to that of present-day Albany, about 135 miles to the north (according to Wikipedia). It's still slightly warmer than recent years at KALB, but the airport is at nearly 300' elevation, while the bulk of the city of Albany is only around 100' elevation.


Pittsburgh/Western PA Spring 2024
in Upstate New York/Pennsylvania
Posted