

TheClimateChanger
-
Posts
3,475 -
Joined
-
Last visited
Content Type
Profiles
Blogs
Forums
American Weather
Media Demo
Store
Gallery
Posts posted by TheClimateChanger
-
-
56 minutes ago, CP_WinterStorm said:
I just noticed that the last half of June should be the warmest on record at ORD by a large margin (1°F+) and the warmest since 2012.
Yuck.
Certainly was a very impressive period, with departures in excess of 8F in spots. I wonder if it would be possible to see such large deviations in a summer month for a full 4 weeks. That would be nuts!

-
This June was miles hotter at Charlotteburg Reservoir than anything observed in 1980. Looks like in 1980, you could beat the heat by traveling an hour or so outside the urban heat island, while in 2025, the temperatures are much more uniform even way out in Passaic County.
Climatological Data for CHARLOTTEBURG RESERVOIR, NJ - June 2025
Click column heading to sort ascending, click again to sort descending.Sum 2372 1802 - - 47 190 1.47 0.0 - Average 79.1 60.1 69.6 2.3 - - - - 0.0 Normal 77.8 56.7 67.3 - 51 118 4.85 M - Above Normals represent the month through 2025-06-30. 2025-06-01 62 46 54.0 -9.2 11 0 M 0.0 0 2025-06-02 65 43 54.0 -9.5 11 0 0.01 M 0 2025-06-03 71 45 58.0 -5.7 7 0 0.00 0.0 0 2025-06-04 80 50 65.0 1.0 0 0 0.00 0.0 0 2025-06-05 86 58 72.0 7.7 0 7 0.00 0.0 0 2025-06-06 89 64 76.5 11.9 0 12 0.00 0.0 0 2025-06-07 86 62 74.0 9.1 0 9 M 0.0 0 2025-06-08 76 58 67.0 1.8 0 2 M 0.0 0 2025-06-09 76 58 67.0 1.5 0 2 M M 0 2025-06-10 65 58 61.5 -4.3 3 0 0.57 M M 2025-06-11 77 55 66.0 -0.1 0 1 0.01 M M 2025-06-12 80 62 71.0 4.6 0 6 0.00 M M 2025-06-13 87 60 73.5 6.8 0 9 0.00 M M 2025-06-14 80 59 69.5 2.6 0 5 0.02 M M 2025-06-15 66 56 61.0 -6.2 4 0 0.04 M M 2025-06-16 62 56 59.0 -8.5 6 0 0.01 M M 2025-06-17 64 59 61.5 -6.3 3 0 0.07 M M 2025-06-18 66 60 63.0 -5.1 2 0 0.21 M M 2025-06-19 82 65 73.5 5.2 0 9 0.39 M M 2025-06-20 88 64 76.0 7.4 0 11 0.07 M M 2025-06-21 82 66 74.0 5.1 0 9 M M M 2025-06-22 87 72 79.5 10.4 0 15 M M M 2025-06-23 87 69 78.0 8.6 0 13 M M 0 2025-06-24 97 71 84.0 14.4 0 19 0.00 0.0 0 2025-06-25 97 71 84.0 14.2 0 19 0.00 0.0 0 2025-06-26 95 72 83.5 13.4 0 19 0.00 M M 2025-06-27 76 61 68.5 -1.8 0 4 0.03 M M 2025-06-28 70 59 64.5 -6.0 0 0 0.04 M M 2025-06-29 84 61 72.5 1.8 0 8 0.00 M M 2025-06-30 89 62 75.5 4.6 0 11 0.00 M M -
Just now, TheClimateChanger said:
I don't know the observations from Jersey City and Passaic County don't strike me as very warm for those years. If there was a Sonoran heat release, it must have skipped over those areas.
Climatological Data for JERSEY CITY, NJ - June 1980
Click column heading to sort ascending, click again to sort descending.Sum 2216 1716 - 67 91 2.73 0.0 - Average 73.9 57.2 65.5 - - - - 0.0 Normal M M M M M M M - 1980-06-01 81 62 71.5 0 7 T 0.0 0 1980-06-02 79 65 72.0 0 7 0.00 0.0 0 1980-06-03 82 65 73.5 0 9 1.25 0.0 0 1980-06-04 72 59 65.5 0 1 0.00 0.0 0 1980-06-05 71 55 63.0 2 0 0.00 0.0 0 1980-06-06 69 53 61.0 4 0 T 0.0 0 1980-06-07 74 60 67.0 0 2 0.47 0.0 0 1980-06-08 74 50 62.0 3 0 0.52 0.0 0 1980-06-09 62 44 53.0 12 0 0.47 0.0 0 1980-06-10 58 49 53.5 11 0 0.00 0.0 0 1980-06-11 64 45 54.5 10 0 0.00 0.0 0 1980-06-12 70 47 58.5 6 0 0.00 0.0 0 1980-06-13 68 52 60.0 5 0 0.00 0.0 0 1980-06-14 80 51 65.5 0 1 0.00 0.0 0 1980-06-15 82 63 72.5 0 8 T 0.0 0 1980-06-16 69 60 64.5 0 0 0.00 0.0 0 1980-06-17 68 53 60.5 4 0 0.00 0.0 0 1980-06-18 67 55 61.0 4 0 0.00 0.0 0 1980-06-19 69 55 62.0 3 0 0.00 0.0 0 1980-06-20 68 55 61.5 3 0 T 0.0 0 1980-06-21 76 55 65.5 0 1 0.00 0.0 0 1980-06-22 81 58 69.5 0 5 0.00 0.0 0 1980-06-23 80 62 71.0 0 6 0.00 0.0 0 1980-06-24 79 65 72.0 0 7 0.00 0.0 0 1980-06-25 86 68 77.0 0 12 0.00 0.0 0 1980-06-26 75 63 69.0 0 4 0.00 0.0 0 1980-06-27 90 64 77.0 0 12 0.00 0.0 0 1980-06-28 73 60 66.5 0 2 0.00 0.0 0 1980-06-29 72 63 67.5 0 3 0.02 0.0 0 1980-06-30 77 60 68.5 0 4 T 0.0 0 Reliable observation times are not available prior to 1982. Climatological Data for JERSEY CITY, NJ - July 1980
Click column heading to sort ascending, click again to sort descending.Sum 2526 2034 - 0 272 5.01 0.0 - Average 81.5 65.6 73.5 - - - - 0.0 Normal M M M M M M M - 1980-07-01 73 58 65.5 0 1 0.00 0.0 0 1980-07-02 80 64 72.0 0 7 1.17 0.0 0 1980-07-03 72 66 69.0 0 4 0.13 0.0 0 1980-07-04 84 65 74.5 0 10 0.00 0.0 0 1980-07-05 79 65 72.0 0 7 0.16 0.0 0 1980-07-06 75 63 69.0 0 4 0.00 0.0 0 1980-07-07 79 55 67.0 0 2 0.00 0.0 0 1980-07-08 80 63 71.5 0 7 T 0.0 0 1980-07-09 82 64 73.0 0 8 0.00 0.0 0 1980-07-10 76 67 71.5 0 7 0.00 0.0 0 1980-07-11 84 65 74.5 0 10 0.00 0.0 0 1980-07-12 79 66 72.5 0 8 T 0.0 0 1980-07-13 82 57 69.5 0 5 0.00 0.0 0 1980-07-14 81 61 71.0 0 6 0.00 0.0 0 1980-07-15 85 65 75.0 0 10 0.00 0.0 0 1980-07-16 91 71 81.0 0 16 0.02 0.0 0 1980-07-17 85 67 76.0 0 11 0.10 0.0 0 1980-07-18 83 70 76.5 0 12 0.00 0.0 0 1980-07-19 78 69 73.5 0 9 0.00 0.0 0 1980-07-20 95 73 84.0 0 19 0.00 0.0 0 1980-07-21 94 79 86.5 0 22 0.00 0.0 0 1980-07-22 83 67 75.0 0 10 0.45 0.0 0 1980-07-23 76 68 72.0 0 7 0.03 0.0 0 1980-07-24 83 64 73.5 0 9 0.00 0.0 0 1980-07-25 85 63 74.0 0 9 0.00 0.0 0 1980-07-26 85 68 76.5 0 12 T 0.0 0 1980-07-27 80 69 74.5 0 10 0.00 0.0 0 1980-07-28 76 68 72.0 0 7 0.00 0.0 0 1980-07-29 73 64 68.5 0 4 2.95 0.0 0 1980-07-30 83 65 74.0 0 9 0.00 0.0 0 1980-07-31 85 65 75.0 0 10 0.00 0.0 0 Reliable observation times are not available prior to 1982.
Climatological Data for JERSEY CITY, NJ - August 1980
Click column heading to sort ascending, click again to sort descending.Sum 2469 1995 - 2 225 4.01 0.0 - Average 79.6 64.4 72.0 - - - - 0.0 Normal M M M M M M M - 1980-08-01 78 68 73.0 0 8 T 0.0 0 1980-08-02 86 66 76.0 0 11 2.50 0.0 0 1980-08-03 88 64 76.0 0 11 T 0.0 0 1980-08-04 83 70 76.5 0 12 0.00 0.0 0 1980-08-05 84 70 77.0 0 12 0.04 0.0 0 1980-08-06 85 69 77.0 0 12 0.00 0.0 0 1980-08-07 86 68 77.0 0 12 0.00 0.0 0 1980-08-08 89 72 80.5 0 16 0.00 0.0 0 1980-08-09 86 72 79.0 0 14 0.00 0.0 0 1980-08-10 82 65 73.5 0 9 T 0.0 0 1980-08-11 84 68 76.0 0 11 0.46 0.0 0 1980-08-12 84 68 76.0 0 11 0.03 0.0 0 1980-08-13 79 63 71.0 0 6 0.00 0.0 0 1980-08-14 76 63 69.5 0 5 0.00 0.0 0 1980-08-15 77 68 72.5 0 8 0.03 0.0 0 1980-08-16 72 58 65.0 0 0 0.00 0.0 0 1980-08-17 77 51 64.0 1 0 0.00 0.0 0 1980-08-18 72 60 66.0 0 1 T 0.0 0 1980-08-19 74 62 68.0 0 3 0.03 0.0 0 1980-08-20 67 62 64.5 0 0 0.72 0.0 0 1980-08-21 68 60 64.0 1 0 0.00 0.0 0 1980-08-22 73 60 66.5 0 2 0.00 0.0 0 1980-08-23 74 58 66.0 0 1 0.00 0.0 0 1980-08-24 83 59 71.0 0 6 0.00 0.0 0 1980-08-25 82 65 73.5 0 9 0.00 0.0 0 1980-08-26 80 62 71.0 0 6 0.00 0.0 0 1980-08-27 87 66 76.5 0 12 0.00 0.0 0 1980-08-28 86 65 75.5 0 11 0.00 0.0 0 1980-08-29 71 63 67.0 0 2 0.00 0.0 0 1980-08-30 77 64 70.5 0 6 0.00 0.0 0 1980-08-31 79 66 72.5 0 8 0.20 0.0 0 Reliable observation times are not available prior to 1982. Climatological Data for CHARLOTTEBURG RESERVOIR, NJ - June 1980
Click column heading to sort ascending, click again to sort descending.Sum 2187 1486 - - 151 43 2.99 0.0 - Average 72.9 49.5 61.2 -6.1 - - - - 0.0 Normal 77.8 56.7 67.3 - 51 118 4.85 M -
1980-06-01 71 56 63.5 0.3 1 0 0.30 0.0 0 1980-06-02 77 60 68.5 5.0 0 4 0.31 0.0 0 1980-06-03 76 59 67.5 3.8 0 3 0.02 0.0 0 1980-06-04 79 57 68.0 4.0 0 3 0.60 0.0 0 1980-06-05 66 47 56.5 -7.8 8 0 0.00 0.0 0 1980-06-06 69 41 55.0 -9.6 10 0 0.00 0.0 0 1980-06-07 71 51 61.0 -3.9 4 0 0.32 0.0 0 1980-06-08 69 57 63.0 -2.2 2 0 0.09 0.0 0 1980-06-09 75 37 56.0 -9.5 9 0 0.23 0.0 0 1980-06-10 55 43 49.0 -16.8 16 0 0.37 0.0 0 1980-06-11 58 34 46.0 -20.1 19 0 0.02 0.0 0 1980-06-12 59 35 47.0 -19.4 18 0 0.00 0.0 0 1980-06-13 68 42 55.0 -11.7 10 0 0.00 0.0 0 1980-06-14 73 42 57.5 -9.4 7 0 0.00 0.0 0 1980-06-15 79 49 64.0 -3.2 1 0 T 0.0 0 1980-06-16 79 52 65.5 -2.0 0 1 0.05 0.0 0 1980-06-17 67 45 56.0 -11.8 9 0 0.00 0.0 0 1980-06-18 71 43 57.0 -11.1 8 0 0.00 0.0 0 1980-06-19 70 44 57.0 -11.3 8 0 0.00 0.0 0 1980-06-20 74 49 61.5 -7.1 3 0 0.07 0.0 0 1980-06-21 63 53 58.0 -10.9 7 0 T 0.0 0 1980-06-22 72 44 58.0 -11.1 7 0 0.00 0.0 0 1980-06-23 77 45 61.0 -8.4 4 0 0.00 0.0 0 1980-06-24 82 54 68.0 -1.6 0 3 0.00 0.0 0 1980-06-25 85 64 74.5 4.7 0 10 0.00 0.0 0 1980-06-26 84 56 70.0 -0.1 0 5 0.00 0.0 0 1980-06-27 82 59 70.5 0.2 0 6 0.00 0.0 0 1980-06-28 86 53 69.5 -1.0 0 5 0.00 0.0 0 1980-06-29 75 57 66.0 -4.7 0 1 0.00 0.0 0 1980-06-30 75 58 66.5 -4.4 0 2 0.61 0.0 0 Climatological Data for CHARLOTTEBURG RESERVOIR, NJ - July 1980
Click column heading to sort ascending, click again to sort descending.Sum 2496 1806 - - 15 157 3.15 0.0 - Average 80.5 58.3 69.4 -2.7 - - - - 0.0 Normal 82.9 61.4 72.1 - 6 228 4.59 M - 1980-07-01 74 54 64.0 -7.0 1 0 0.01 0.0 0 1980-07-02 78 54 66.0 -5.2 0 1 0.00 0.0 0 1980-07-03 75 62 68.5 -2.9 0 4 0.13 0.0 0 1980-07-04 71 60 65.5 -6.0 0 1 0.02 0.0 0 1980-07-05 82 54 68.0 -3.7 0 3 0.00 0.0 0 1980-07-06 81 58 69.5 -2.3 0 5 1.02 0.0 0 1980-07-07 70 46 58.0 -13.9 7 0 0.00 0.0 0 1980-07-08 75 52 63.5 -8.5 1 0 0.00 0.0 0 1980-07-09 79 58 68.5 -3.6 0 4 T 0.0 0 1980-07-10 81 61 71.0 -1.2 0 6 0.00 0.0 0 1980-07-11 80 61 70.5 -1.8 0 6 0.00 0.0 0 1980-07-12 80 60 70.0 -2.3 0 5 0.21 0.0 0 1980-07-13 73 49 61.0 -11.4 4 0 0.00 0.0 0 1980-07-14 78 48 63.0 -9.4 2 0 0.00 0.0 0 1980-07-15 83 55 69.0 -3.5 0 4 0.00 0.0 0 1980-07-16 83 66 74.5 2.0 0 10 0.41 0.0 0 1980-07-17 88 68 78.0 5.5 0 13 0.01 0.0 0 1980-07-18 84 62 73.0 0.5 0 8 0.11 0.0 0 1980-07-19 84 59 71.5 -1.0 0 7 0.00 0.0 0 1980-07-20 85 62 73.5 1.0 0 9 0.00 0.0 0 1980-07-21 91 69 80.0 7.5 0 15 0.00 0.0 0 1980-07-22 93 65 79.0 6.5 0 14 0.00 0.0 0 1980-07-23 86 63 74.5 2.0 0 10 0.62 0.0 0 1980-07-24 78 55 66.5 -5.9 0 2 0.00 0.0 0 1980-07-25 80 52 66.0 -6.4 0 1 0.00 0.0 0 1980-07-26 84 56 70.0 -2.3 0 5 0.00 0.0 0 1980-07-27 85 59 72.0 -0.3 0 7 0.00 0.0 0 1980-07-28 82 58 70.0 -2.2 0 5 0.00 0.0 0 1980-07-29 78 61 69.5 -2.7 0 5 0.08 0.0 0 1980-07-30 75 63 69.0 -3.1 0 4 0.53 0.0 0 1980-07-31 80 56 68.0 -4.0 0 3 0.00 0.0 0 Climatological Data for CHARLOTTEBURG RESERVOIR, NJ - August 1980
Click column heading to sort ascending, click again to sort descending.Sum 2460 1785 - - 20 135 1.81 0.0 - Average 79.4 57.6 68.5 -1.9 - - - - 0.0 Normal 81.3 59.5 70.4 - 13 181 4.33 M - 1980-08-01 79 59 69.0 -3.0 0 4 0.00 0.0 0 1980-08-02 80 62 71.0 -0.9 0 6 0.00 0.0 0 1980-08-03 83 62 72.5 0.7 0 8 1.14 0.0 0 1980-08-04 83 63 73.0 1.3 0 8 0.00 0.0 0 1980-08-05 84 63 73.5 1.8 0 9 0.00 0.0 0 1980-08-06 89 64 76.5 4.9 0 12 0.10 0.0 0 1980-08-07 82 59 70.5 -1.0 0 6 0.00 0.0 0 1980-08-08 84 63 73.5 2.1 0 9 T 0.0 0 1980-08-09 86 67 76.5 5.2 0 12 0.26 0.0 0 1980-08-10 83 55 69.0 -2.2 0 4 0.00 0.0 0 1980-08-11 78 56 67.0 -4.1 0 2 0.07 0.0 0 1980-08-12 80 66 73.0 2.0 0 8 0.02 0.0 0 1980-08-13 76 55 65.5 -5.4 0 1 0.00 0.0 0 1980-08-14 76 53 64.5 -6.3 0 0 0.00 0.0 0 1980-08-15 76 55 65.5 -5.2 0 1 T 0.0 0 1980-08-16 76 55 65.5 -5.1 0 1 0.04 0.0 0 1980-08-17 67 47 57.0 -13.5 8 0 0.00 0.0 0 1980-08-18 76 50 63.0 -7.3 2 0 0.00 0.0 0 1980-08-19 71 55 63.0 -7.2 2 0 0.04 0.0 0 1980-08-20 78 58 68.0 -2.1 0 3 0.13 0.0 0 1980-08-21 70 54 62.0 -7.9 3 0 0.00 0.0 0 1980-08-22 67 57 62.0 -7.8 3 0 T 0.0 0 1980-08-23 72 53 62.5 -7.1 2 0 0.01 0.0 0 1980-08-24 80 51 65.5 -4.0 0 1 0.00 0.0 0 1980-08-25 81 53 67.0 -2.3 0 2 0.00 0.0 0 1980-08-26 83 52 67.5 -1.6 0 3 0.00 0.0 0 1980-08-27 86 56 71.0 2.0 0 6 0.00 0.0 0 1980-08-28 86 63 74.5 5.7 0 10 0.00 0.0 0 1980-08-29 85 57 71.0 2.4 0 6 0.00 0.0 0 1980-08-30 80 59 69.5 1.1 0 5 0.00 0.0 0 1980-08-31 83 63 73.0 4.8 0 8 0.00 0.0 0 Reliable observation times are not available prior to 1982. -
2 hours ago, LibertyBell said:
They were Sonoran heat releases directly out of the southwest LOL
I don't know the observations from Jersey City and Passaic County don't strike me as very warm for those years. If there was a Sonoran heat release, it must have skipped over those areas.
Climatological Data for JERSEY CITY, NJ - June 1980
Click column heading to sort ascending, click again to sort descending.Sum 2216 1716 - 67 91 2.73 0.0 - Average 73.9 57.2 65.5 - - - - 0.0 Normal M M M M M M M - 1980-06-01 81 62 71.5 0 7 T 0.0 0 1980-06-02 79 65 72.0 0 7 0.00 0.0 0 1980-06-03 82 65 73.5 0 9 1.25 0.0 0 1980-06-04 72 59 65.5 0 1 0.00 0.0 0 1980-06-05 71 55 63.0 2 0 0.00 0.0 0 1980-06-06 69 53 61.0 4 0 T 0.0 0 1980-06-07 74 60 67.0 0 2 0.47 0.0 0 1980-06-08 74 50 62.0 3 0 0.52 0.0 0 1980-06-09 62 44 53.0 12 0 0.47 0.0 0 1980-06-10 58 49 53.5 11 0 0.00 0.0 0 1980-06-11 64 45 54.5 10 0 0.00 0.0 0 1980-06-12 70 47 58.5 6 0 0.00 0.0 0 1980-06-13 68 52 60.0 5 0 0.00 0.0 0 1980-06-14 80 51 65.5 0 1 0.00 0.0 0 1980-06-15 82 63 72.5 0 8 T 0.0 0 1980-06-16 69 60 64.5 0 0 0.00 0.0 0 1980-06-17 68 53 60.5 4 0 0.00 0.0 0 1980-06-18 67 55 61.0 4 0 0.00 0.0 0 1980-06-19 69 55 62.0 3 0 0.00 0.0 0 1980-06-20 68 55 61.5 3 0 T 0.0 0 1980-06-21 76 55 65.5 0 1 0.00 0.0 0 1980-06-22 81 58 69.5 0 5 0.00 0.0 0 1980-06-23 80 62 71.0 0 6 0.00 0.0 0 1980-06-24 79 65 72.0 0 7 0.00 0.0 0 1980-06-25 86 68 77.0 0 12 0.00 0.0 0 1980-06-26 75 63 69.0 0 4 0.00 0.0 0 1980-06-27 90 64 77.0 0 12 0.00 0.0 0 1980-06-28 73 60 66.5 0 2 0.00 0.0 0 1980-06-29 72 63 67.5 0 3 0.02 0.0 0 1980-06-30 77 60 68.5 0 4 T 0.0 0 Reliable observation times are not available prior to 1982. Climatological Data for JERSEY CITY, NJ - July 1980
Click column heading to sort ascending, click again to sort descending.Sum 2526 2034 - 0 272 5.01 0.0 - Average 81.5 65.6 73.5 - - - - 0.0 Normal M M M M M M M - 1980-07-01 73 58 65.5 0 1 0.00 0.0 0 1980-07-02 80 64 72.0 0 7 1.17 0.0 0 1980-07-03 72 66 69.0 0 4 0.13 0.0 0 1980-07-04 84 65 74.5 0 10 0.00 0.0 0 1980-07-05 79 65 72.0 0 7 0.16 0.0 0 1980-07-06 75 63 69.0 0 4 0.00 0.0 0 1980-07-07 79 55 67.0 0 2 0.00 0.0 0 1980-07-08 80 63 71.5 0 7 T 0.0 0 1980-07-09 82 64 73.0 0 8 0.00 0.0 0 1980-07-10 76 67 71.5 0 7 0.00 0.0 0 1980-07-11 84 65 74.5 0 10 0.00 0.0 0 1980-07-12 79 66 72.5 0 8 T 0.0 0 1980-07-13 82 57 69.5 0 5 0.00 0.0 0 1980-07-14 81 61 71.0 0 6 0.00 0.0 0 1980-07-15 85 65 75.0 0 10 0.00 0.0 0 1980-07-16 91 71 81.0 0 16 0.02 0.0 0 1980-07-17 85 67 76.0 0 11 0.10 0.0 0 1980-07-18 83 70 76.5 0 12 0.00 0.0 0 1980-07-19 78 69 73.5 0 9 0.00 0.0 0 1980-07-20 95 73 84.0 0 19 0.00 0.0 0 1980-07-21 94 79 86.5 0 22 0.00 0.0 0 1980-07-22 83 67 75.0 0 10 0.45 0.0 0 1980-07-23 76 68 72.0 0 7 0.03 0.0 0 1980-07-24 83 64 73.5 0 9 0.00 0.0 0 1980-07-25 85 63 74.0 0 9 0.00 0.0 0 1980-07-26 85 68 76.5 0 12 T 0.0 0 1980-07-27 80 69 74.5 0 10 0.00 0.0 0 1980-07-28 76 68 72.0 0 7 0.00 0.0 0 1980-07-29 73 64 68.5 0 4 2.95 0.0 0 1980-07-30 83 65 74.0 0 9 0.00 0.0 0 1980-07-31 85 65 75.0 0 10 0.00 0.0 0 Reliable observation times are not available prior to 1982.
Climatological Data for JERSEY CITY, NJ - August 1980
Click column heading to sort ascending, click again to sort descending.Sum 2469 1995 - 2 225 4.01 0.0 - Average 79.6 64.4 72.0 - - - - 0.0 Normal M M M M M M M - 1980-08-01 78 68 73.0 0 8 T 0.0 0 1980-08-02 86 66 76.0 0 11 2.50 0.0 0 1980-08-03 88 64 76.0 0 11 T 0.0 0 1980-08-04 83 70 76.5 0 12 0.00 0.0 0 1980-08-05 84 70 77.0 0 12 0.04 0.0 0 1980-08-06 85 69 77.0 0 12 0.00 0.0 0 1980-08-07 86 68 77.0 0 12 0.00 0.0 0 1980-08-08 89 72 80.5 0 16 0.00 0.0 0 1980-08-09 86 72 79.0 0 14 0.00 0.0 0 1980-08-10 82 65 73.5 0 9 T 0.0 0 1980-08-11 84 68 76.0 0 11 0.46 0.0 0 1980-08-12 84 68 76.0 0 11 0.03 0.0 0 1980-08-13 79 63 71.0 0 6 0.00 0.0 0 1980-08-14 76 63 69.5 0 5 0.00 0.0 0 1980-08-15 77 68 72.5 0 8 0.03 0.0 0 1980-08-16 72 58 65.0 0 0 0.00 0.0 0 1980-08-17 77 51 64.0 1 0 0.00 0.0 0 1980-08-18 72 60 66.0 0 1 T 0.0 0 1980-08-19 74 62 68.0 0 3 0.03 0.0 0 1980-08-20 67 62 64.5 0 0 0.72 0.0 0 1980-08-21 68 60 64.0 1 0 0.00 0.0 0 1980-08-22 73 60 66.5 0 2 0.00 0.0 0 1980-08-23 74 58 66.0 0 1 0.00 0.0 0 1980-08-24 83 59 71.0 0 6 0.00 0.0 0 1980-08-25 82 65 73.5 0 9 0.00 0.0 0 1980-08-26 80 62 71.0 0 6 0.00 0.0 0 1980-08-27 87 66 76.5 0 12 0.00 0.0 0 1980-08-28 86 65 75.5 0 11 0.00 0.0 0 1980-08-29 71 63 67.0 0 2 0.00 0.0 0 1980-08-30 77 64 70.5 0 6 0.00 0.0 0 1980-08-31 79 66 72.5 0 8 0.20 0.0 0 Reliable observation times are not available prior to 1982. -
Definitely living up to its billing as the swamp. I was shocked with widespread 100-110F heat indices, that there is not even a heat advisory. I think most places in the US would melt in those conditions. Yikes.
-
On 6/28/2025 at 3:38 PM, LibertyBell said:
No they weren't Only the last 10 days of June are part of summer. If you're familiar with 1980 there was historic heat for all of July and all of August and the first three weeks of September that covered the entire CONUS except for the extreme Pac NW and Maine. A thousand people died in Saint Louis alone from the intense heat (1995 Chicago was similar to 1980 St. Louis.) NYC's couplet of July and August is still the hottest 62 day period on record and August 1980 is the hottest August on record and the only one with a mean temperature of 80.0 or above.
But 1983 was an even hotter summer (going by the metrics I use.)
Looks like those were mostly urban heat island driven heat waves. Much cooler in the 'burbs and sticks back then.
-
With that said, still a far cry from the olden days of the 2010s, when DCA would far outpace all other sites in the CWA not named "Maryland Science Center." Looks like they got most of that so-called UHI in check at National Airport. At the height of its urban heating days, in 2015, it was 1.5F warmer than any other site. Even beating DMH by 1.8F. With the 2015 sensor in place, would probably be making a run for record warmest.

2025

2010

2015

-
Surprised to see DCA is only running +0.5F for the month. Looks to be the lowest of all sites (including reporting cooperative observations) in the IWX CWA, with the majority of stations running between +1.5F and 3.5F. There were a couple stations with an anomaly close to that of DCA, and a few warm outliers (> +4F), but DCA looks to have the lowest anomaly of all sites.
It is worth noting that the "normal" is 0.5F above the 1991-2020 mean, so if not for that added warming from NOAA, it would be +1.0F for the month and more in line with surrounding sites. Most of the co-op "normals" are just based on simple averages, I do believe. As an aside, I always cringe when people object to calling it a "normal" and instead call it "average" when it's NOT an average. The justification being there's no such thing as normal in climate, ignoring that the term has a specific meaning in this context, and calling it an average is just plain incorrect. I have seen some stations where the "normal" is as much as 1.5F above the 1991-2020 mean.

-
8 minutes ago, TheClimateChanger said:
This is a good point. I remember in the 1990s, we had "triple H" weather - hazy, hot and humid, as though haze were a byproduct of hot and humid weather rather than a noxious soup of industrial chemicals. It was common for airport visibility to be 5-7 miles in heat domes, sometimes even 3-5 miles. Compared to today's atmosphere, you don't see such things. In fact, it used to be northwest flow would bring in clean, crisp, unpolluted air from the hinterlands. Now it brings in toxic wildfire smoke and particulates. So more often than not, we wind up with hazy, cool and dry weather, instead of the opposite.
Looking at the numbers, mean summertime high temperatures for the most recent 15 years (2010-2024) are about 1.5-2.5F warmer in most places in the eastern US, compared to the preceding 15 years (1995-2009). Have to wonder how much of that is attributable to a climate signal and how much of that is attributable to the 2010 amendments to the Clean Air Act.
-
 1
1
-
-
17 hours ago, Sundog said:
The event is extremely unlikely but not impossible.
Plus early 80s was peak aerosol pollution, we had capped climate change through air pollution. Then there is also natural variability.
This is a good point. I remember in the 1990s, we had "triple H" weather - hazy, hot and humid, as though haze were a byproduct of hot and humid weather rather than a noxious soup of industrial chemicals. It was common for airport visibility to be 5-7 miles in heat domes, sometimes even 3-5 miles. Compared to today's atmosphere, you don't see such things. In fact, it used to be northwest flow would bring in clean, crisp, unpolluted air from the hinterlands. Now it brings in toxic wildfire smoke and particulates. So more often than not, we wind up with hazy, cool and dry weather, instead of the opposite.
-
On 6/29/2025 at 7:59 AM, bluewave said:
Another top 10 warmest month for the Northeast.
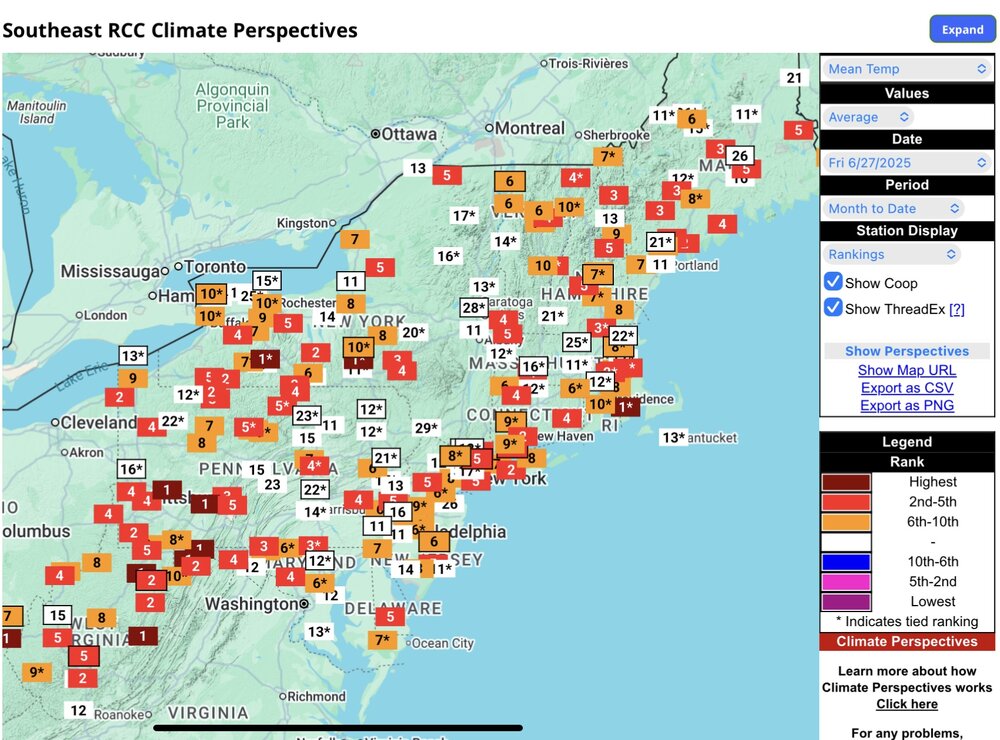
Some very impressive anomalies out there, with several sites reporting temperatures as much as 5-7F above the 1991-2020 mean. Very impressive deviations relative to normal for a summertime month. The New York City metro area has actually been relatively cool compared to many locales.

Widening out a bit (not depicted), the west also has seen similar departures relative to normal, despite a recent cold snap that brought snow to the higher elevations. Looks like this could be one of the warmest Junes on record for the CONUS as a whole. Although I highly doubt we will unseat 2021 for the record warmest, which had some truly insane +6-8F anomalies across much of the intermountain west.
-
On 6/29/2025 at 5:37 AM, Stormchaserchuck1 said:
July has been a big trend month around the 91-20 average. The West coast has been extreme.
Here is July 81-90 vs 91-20, on the front half of the trend

Now here's 2021-on vs the 91-20 average

That's a +5-6F difference in the West coast ridge in July, the most unanomalous month of the year.
0z EPS through the first half of July has the same pattern occurring.


Following Winters around the same base period (91-20) [minus 81-90, plus 21-25] look like this, which is relevant because the same global trend in the July pattern is likely to occur this year

I mean this is just an anthropocene signal, no? Looks like something a climate model would spit out with a cooling hole in July over the heavy agricultural areas due to the unnatural densities of corn and soybeans (and the resulting unnatural levels of evapotranspiration) and irrigation effects, enhanced warming over the arid west with rapid winter warming east of the Rockies.
-
25 minutes ago, TimB said:
I assume today’s average should be enough to allow us to jump past 1994 and 1967 to be the hottest June recorded at Pittsburgh International?
Looks like it. Should finish around 73.1F, which would match 1925 for 11th hottest in the full threaded record and make it the hottest since 1943 in the threaded record.
-
Up to 72.9F on the month at PIT for the mean temperature, matching 1994 as the highest in June since 1967 (73.0F) and surpassing last year’s final average by 0.1F. Pretty impressive turnaround considering the cold start to the month - we had accumulated an aggregate deficit of 22F from the normal value in just the first 2 days of the month.
-
On 6/27/2025 at 9:30 AM, TimB said:
Assuming this morning’s low of 71 holds, it’ll be the 15th time on record that Pittsburgh hasn’t gone below 71 for at least 6 consecutive mornings, the first since August 13-18, 1995 (which is the only other time that’s happened since observations moved to PIT airport in 1952, and the first time it’s ever happened in June.
Edit 10:20 pm: alas, it wasn’t to be. The storms killed it and dropped us below 71 this evening.
Made it down to 69F before midnight standard time, which was also today’s low. Although only at 9 in a row, I’m interested in seeing how many 80+ days we string together. Seemingly no end in sight, though. Strung together 37 in a row in 2020.
-
Certainly, keeping a close eye on the temperatures here as we close out the books on the month of June. It looks like June 2025 will go down in the weather annals as one of the hottest on record. In Southeast Michigan, it looks like Flint and Saginaw will see top 10 heat, and Detroit should finish up around that number in the means when all is said & done. Same with nearby Lansing, where threaded climate records extend back to 1863. In Saginaw, this could be the 2nd hottest June since 1949 (behind only 2005) if current forecasts hold!
Final June 90F count should be interesting as well. Detroit is up to 4 on the month - can they reel off a couple more? In @Spartmanland, Dayton is up to 6, all in a row. Today should make that 7 in a row, and there's a chance for one or two more before the month is through. Haven't seen more than 7 90+ days at Dayton in the month of June since 1994. I know @Spartmanis a big 90-degree enthusiast, and hater of clouds, rain and sub-90 degree readings, so he must be loving this stretch. Suffice it to say, 2017's disastrous 3-day total will not be repeated in 2025.
-
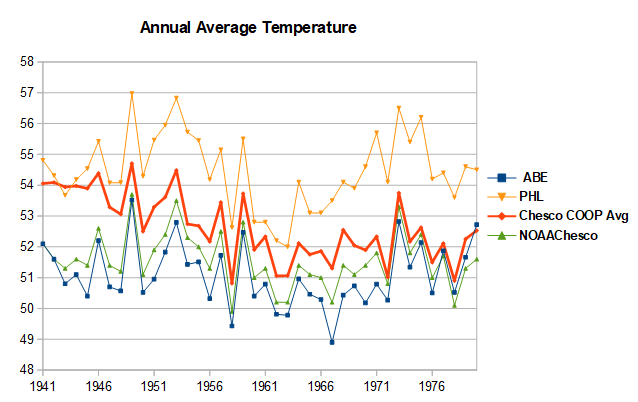
Let's look at May 2025:


xMacis reveals three NOAA stations in Chester County, with a mean temperature of 61.5F. So it's true that the reported mean temperature is higher than the mean of these three stations. But the opposite is true in just about every other county in Pennsylvania.
-
On 6/8/2025 at 6:35 AM, chubbs said:
Your in denial mode. These two charts fit together well. The station moves at Coatesville and West Chester produce spurious cooling if they are left in the raw data. That's why NOAA matches raw data without station moves and you (COOP station avg) don't. You have Chester County as warm as the Philadelphia airport before the station moves. How silly is that.
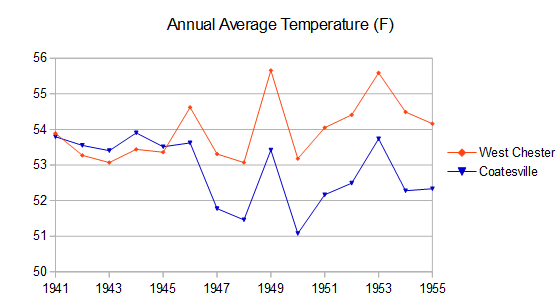
@chubbs - this is all a bunch of subterfuge. In the vast majority of cases, NOAA systematically reduces the reported temperatures from the observed temperatures on a county-by-county basis, often in ways that make little logical sense. Chester County may very well be the only county in Pennsylvania where the opposite is true. So if there is a conspiracy, it's in the opposite direction as the one presupposed with this analysis.
-
10 hours ago, Chicago Storm said:
It hit 94° at ORD and 95° at MDW today.
Both locations were 89°'d yesterday, while all inland areas hit 90°+.
Daily record high minimum of 77F tied yesterday in Chicago.
000
SXUS73 KLOT 270642 RRA
RERORD
RECORD EVENT REPORT
NATIONAL WEATHER SERVICE CHICAGO IL
142 AM CDT FRI JUN 27 2025
...RECORD WARM LOW TEMPERATURE TIED AT CHICAGO-OHARE...
A RECORD WARM LOW TEMPERATURE OF 77 WAS TIED AT CHICAGO-OHARE
YESTERDAY, JUNE 26, 2025. THE EXISTING RECORD WAS SET IN 1931.
$$ -
18 minutes ago, TimB said:
We also had 5 day stretches in both July and August last summer, which I know doesn’t technically negate your statement.
The only other time we had 5 day streaks of 90 degree temps in 3 consecutive summer months (not necessarily the same summer) was July and August of 1887 and June of 1888.
Oh, well, technically off, then. This stretch *matches* the longest since 2020. Honestly, I forgot about those. I thought the June heat wave was 4-day stretch and 5 out of 6 days, but it looks like that hot spell was technically an 89, followed by 2 90s, then another 89, and then 3 90s. And then I guess there were 5-day stretches in both July and August last year, which clearly didn't garner as much publicity as the June heat wave. Granted with the two 89s in the mix, there were likely parts of the area (downtown, some valley locations) that may have seen 7 days in a row but without an official reading.
-
3 minutes ago, TheClimateChanger said:
While it may not have reached 100F officially at the Park, the 99/81 was the first day in recorded history with that specific high and low. A weathergami!
Incidentally, this was probably the largest outbreak of Weathergamis since this has been tracked [which admittedly has only been a couple of years]. A significant number of weathergamis spread from the Plains into the Upper Midwest and Upper Great Lakes, driven by unprecedented low temperatures. Several sites had record high minimum, which by definition will yield a weathergami. Many other stations had low temperatures that have only occurred a handful of times in recorded history and were paired with high temperatures never before seen. Then, this shifted over to New England and the Mid-Atlantic Coast. Over northern New England, high temperatures reached levels seldom ever achieved, and paired with low temperatures that they had never before been paired with. In the Mid-Atlantic, the weathergamis were driven by a mix of unusually high maximum and minimum temperatures, leading to unique pairings. An interesting way to look at this hot spell.
-
3
-
-
2 hours ago, donsutherland1 said:
It did not reach 100°. The high was 99°.
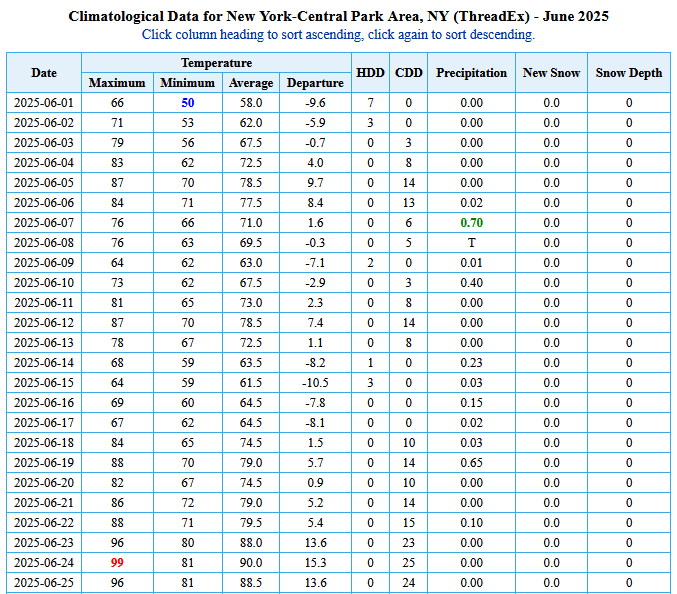
While it may not have reached 100F officially at the Park, the 99/81 was the first day in recorded history with that specific high and low. A weathergami!
-
2
-
-
5 minutes ago, LibertyBell said:
November 1950 triple phaser
1953 was our most extreme summer on record never saw anything like it so it rubber banded back to extreme heat again in 1953 and 1955. Then back to cold again for the last few years of the 50s and the early 60s before the historic heat of 1966 and then cold again after that.
1954 had at least a brief shot of extreme heat as well, but maybe it didn't reach all the way to the coast. I know Ohio and western Pennsylvania had 99-100+ temperatures widespread on the 14th. Typically, the coastal Plain is several degrees (3-6F) warmer during hot spells, but maybe the air mass petered out. I believe those heat waves were enhanced by drought in the middle of the country as well, similar but not as extreme as the 1930s drought.
-
1
-
-
5 minutes ago, TheClimateChanger said:
Another interesting thing, seeing 1936 on that list. That really jives with my research. They claim 1936 is the hottest summer on record, tied with 2021. But it looks like it was overall quite cool for most of the eastern United States. Except for that record heat wave that lasted about a week in July, I'd even say downright chilly. Overnight low temperatures were impressively cold in much of rural Pennsylvania that summer. Without that brief stretch, it looks like it would have been one of the coldest on record in many places. Quite odd that it is tied with 2021 for hottest on record.
If you look into the numbers, the heat was driven by ridiculously high 12F anomalies (on the plus side) in states like North Dakota and South Dakota where nobody lived in 1936 (and still few reside to this day). I wonder how much the loss of crops and at least temporary desertification played a role in amplifying those numbers. They adjust for "urbanization" but don't make any adjustment for the massive amounts of irrigation and the unnatural density of corn and soybeans across the Plains and Midwest. Without the UHI adjustments, I bet 2021 would take the crown, and some other recent summers would surpass 1936 as well. Also, not saying they should make any crop-based adjustments, but it does strike me as odd how certain human-caused environmental changes are factored in, but others are not.
I think 1936 sort of gets a pass because people see all the all-time records (including state records) that extend all the way to the East Coast, but it really wasn't that hot of a summer for most areas in the overall means.

July 2025 Discussion-OBS - seasonable summer variability
in New York City Metro
Posted
Wow, 79 in Phoenix in 1911. And a few days later, a massive heat wave spread all across the eastern U.S. I just looked at the records from the Phoenix area for that month and it was 9.4F colder than the present normals.