

TheClimateChanger
-
Posts
3,506 -
Joined
-
Last visited
Content Type
Profiles
Blogs
Forums
American Weather
Media Demo
Store
Gallery
Posts posted by TheClimateChanger
-
-
1 minute ago, LibertyBell said:
also, for farming purposes maybe a halfway point was better. Definitely not the ice ages and definitely not what we have now. I'd estimate that our ideal climate for productivity and food growth was somewhere between the 1950s and the 1990s, we went downhill rapidly after that.
I added a little context after your quote:
QuoteBen Franklin considered 47-50F annual mean temperature to be the ideal for agriculture and industry. I think patterns of development [prior to air conditioning] support that, with large cities like Chicago, Detroit, New York, Boston, Pittsburgh, Cleveland, Buffalo, etc. falling in that isothermal band. The south was mostly underdeveloped rural/agrarian lifestyle. Maybe some winter homes in Florida. So, prior to the invention of air conditioning, you would probably want to find the climate regime that maximized the areal extent of mean temperatures from the mid 40s to low 50s. Of course, now, most of these places are above 50F in the running means. But he did say 50-53F was the second best temperature band.
-
 1
1
-
-
30 minutes ago, LibertyBell said:
You can also argue that at least some of the warming has had a beneficial impact on humanity.
I think it probably depends on whether you are looking pre- or post-invention of air conditioning. Prior to the invention of air conditioning, I suspect something near pre-industrial is the optimum. Perhaps somewhat colder. Last glacial maximum is probably too cold due to the expansive continental ice shelves, although it would open up a lot of new coastlines. Ben Franklin considered 47-50F annual mean temperature to be the ideal for agriculture and industry. I think patterns of development [prior to air conditioning] support that, with large cities like Chicago, Detroit, New York, Boston, Pittsburgh, Cleveland, Buffalo, etc. falling in that isothermal band. The south was mostly underdeveloped rural/agrarian lifestyle. Maybe some winter homes in Florida. So, prior to the invention of air conditioning, you would probably want to find the climate regime that maximized the areal extent of mean temperatures from the mid 40s to low 50s. Of course, now, most of these places are above 50F in the running means. But he did say 50-53F was the second best temperature band.
-
1
-
-
1 hour ago, Typhoon Tip said:
No problem from me ...
I've smirked the notion in multiple post over the last 10 years. Climate forcing probably began the moment that inquisitive proto modern human picked up stick still aflame at one end somewhere along the sub-Saharan African savanna, and it dawned on him/her. Well not right then - ... but controlling fire.
It just needed 200 years of Industrial humanity to become very obvious ... Before then, it's presence was buried in the noise of natural variability.
Makes sense to me, and I've made this argument in the past. If you read weather records from that era, the general consensus was warming from past eras. I think this is supported by longer-range temperature records and reconstructions. But it does call into question the use of this era as some sort of special baseline. The true baseline may, in fact, have been a continuation of the natural cooling trend that had generally characterized the period since the Holocene Thermal Maximum - perhaps to levels even colder than those of the so-called Little Ice Age. Granted the degree of warming at that time was a tiny fraction of what we see today, so it wouldn't make a huge difference. But this paper would suggest the cumulative human impact is at least slightly higher than commonly reported from temperature datasets which use that period of history as the baseline of a natural climate.
-
5 minutes ago, LibertyBell said:
what about the burnt fields of cotton?
Just ran that by it. It suggests a combination of temperatures near 110F, 75 mph winds and extremely low relatively humidity likely desiccated the crops. It suggests such conditions could wilt and brown the corn, causing drought or freeze-like damage to the crop. The strong winds would have also damaged the crop and caused more heat damage than would occur in a still atmosphere.
-
 1
1
-
-
On 6/15/2025 at 6:05 PM, LibertyBell said:
a firsthand acct
https://www.reddit.com/r/weather/comments/6zjtby/did_the_140f_kopperl_tx_heat_burst_of_june_1960/
1birder
•
2y ago
I lived on a farm outside Kopperl when this happened. I was nine years old and I remember waking up in the middle of the night when our old window water cooler went off. It was eerily silent and then the house was hit by a very strong and HOT wind. My father decided we needed to go to the storm cellar outside the back door and we stayed in there for quite a while. Later we saw the large advertising thermometer at Riddle's Bait shop in Kopperl which had burst from the heat. On the news we saw photos of someone's cotton field and all the plants were scorched. Very, very strange but I had no idea this was such a land mark event.I wrote three comments in different places about the event that you might be able to read if you search my name. I don't know why anyone would doubt that this happened. DFW news stations have shown video taken at the time that clearly pictured the scorched cotton crop. More damage may have been shown but that is what I remember most clearly....along with the shattered thermometer at Riddle's Bait shop. As far as an accurate exact temperature I doubt that could ever be confirmed unless someone in Kopperl was "into" weather and had good instrumentation. The Meridian Tribune is a good county weekly newspaper and they could run something asking for information from others who lived through the event. I was only 9 so someone who was older at the time would be better able to give details. This was a very strange event but I remember being much more frightened when we had to go to the storm cellar during tornados.
I ran this scenario by AI and it concluded the temperature could have reached no more than about 100-110F. It said the warming from a heat burst [compressional heating] would be no greater than the dry adiabatic warming rate, and that a surface temperature of 140F would require an upper atmospheric temperature that would be implausibly high. It suggested the burst thermometers were likely the result of instrument failure due to the sudden change in temperature. Not sure if any atmospheric scientist might want to weigh in.
-
3 minutes ago, TheClimateChanger said:
I would argue it translated to the surface in 2022 & 2024, as well. If you look at Bradford, PA, useful as one of the more remote and sparsely populated locations, in the Eastern CONUS. We see it had never hit 90F in the month of June dating back to 1958 in the month of June prior to 2022. The monthly record of 89F was tied in 2021. In 2022, it reached 90F twice - including a record-breaking 93F on the 22nd. It reached 90F last June an incredible three times! Additionally, it reached 89F once each in 2022 & 2024 (the former monthly record high).
I like to think of it as rural effect warming. Certain persons/entities claim warming is being enhanced or caused by a so-called urban heat island effect, but then when you look at the actual numbers, it's often the most remote locations breaking records all the time. So the urban heating theory makes no sense. If anything, modern technology and siting/exposure standards are such that the UHI signal is less impactful as it was in the past.

You can see the rural effect warming in your data for Caribou, Maine as well. Another remote community near the Canadian border. Look at all those record-breaking June temps in recent years! The complete opposite of what the UHI lie would suggest!
-
25 minutes ago, bluewave said:
It translated to the surface in June 2021 with all-time monthly high temperature records around NYC. EWR ranked #1 and LGA #2. Caribou tied their all-time June high in 2024 with the record Southeast Ridge year. Boston also tied their all-time June high in 2021 and ranked 3rd warmest last year.
Time Series Summary for NEWARK LIBERTY INTL AP, NJ - Month of Jun
Click column heading to sort ascending, click again to sort descending.1 2021 103 0 2 2011 102 0 - 1994 102 0 - 1993 102 0 - 1952 102 0 - 1943 102 0 3 1988 101 0 - 1966 101 0 4 2024 100 0 - 1959 100 0 - 1953 100 0 - 1934 100 0
Time Series Summary for LAGUARDIA AIRPORT, NY - Month of Jun
Click column heading to sort ascending, click again to sort descending.1 2017 101 0 - 1952 101 0 2 2021 100 0 - 2008 100 0 3 1988 99 0 - 1956 99 0 - 1943 99 0 6 2012 98 0 - 1959 98 0 7 2024 97 0 - 2011 97 0 - 2003 97 0 - 1999 97 0 - 1994 97 0 - 1964 97 0 - 1961 97 0 - 1953 97 0 - 1945 97 0
Time Series Summary for Caribou Area, ME (ThreadEx) - Month of Jun
Click column heading to sort ascending, click again to sort descending.1 2024 96 0 - 2020 96 0 - 1944 96 0 2 2023 93 0 - 1995 93 0 - 1988 93 0 - 1983 93 0 3 2021 92 0 - 2003 92 0 - 1979 92 0 - 1963 92 0
Time Series Summary for Boston Area, MA (ThreadEx) - Month of Jun
Click column heading to sort ascending, click again to sort descending.1 2021 100 0 - 1952 100 0 - 1925 100 0 2 1933 99 0 3 2024 98 0 - 1988 98 0 - 1984 98 0 - 1953 98 0 - 1919 98 0 - 1874 98 0 I would argue it translated to the surface in 2022 & 2024, as well. If you look at Bradford, PA, useful as one of the more remote and sparsely populated locations, in the Eastern CONUS. We see it had never hit 90F in the month of June dating back to 1958 in the month of June prior to 2022. The monthly record of 89F was tied in 2021. In 2022, it reached 90F twice - including a record-breaking 93F on the 22nd. It reached 90F last June an incredible three times! Additionally, it reached 89F once each in 2022 & 2024 (the former monthly record high). Just an astounding run. I expect more record-breaking heat in the mountains of northern Pennsylvania with this upcoming heat ridge. What was once without precedence is now a yearly occurrence!
I like to think of it as rural effect warming. Certain persons/entities claim warming is being enhanced or caused by a so-called urban heat island effect, but then when you look at the actual numbers, it's often the most remote locations breaking records all the time. So, the urban heating theory makes no sense. If anything, modern technology and siting/exposure standards are such that the UHI signal is less impactful as it was in the past.
-
 2
2
-
-
Just now, bluewave said:
Then by that narrower definition our region hasn’t ever had an historic heatwave since MTP only made it to 98° back in 2011.
Time Series Summary for MONTAUK AIRPORT, NY - Jun through Aug
Click column heading to sort ascending, click again to sort descending.1 2011 98 1 - 2006 98 0 - 2001 98 1 2 2010 96 1 - 1999 96 0 3 2002 95 5 4 2019 94 2 - 2005 94 0 5 2013 93 2 Yeah, I doubt there's ever been a case where the entire region was AOA 100F on the same date.
-
On 6/15/2025 at 3:25 PM, TheClimateChanger said:
Some scenes from the flash flood emergency on Sunday:
-
 3
3
-
 1
1
-
-
-
Looks increasingly likely that it turns hotter by Sunday. The NWS forecast has low 90s. I took a look at the most recent GFS run and, taken literally, it would suggest 90s Sunday-Friday. Obviously, not ready to commit to that forecast, but either way it should be a hot week. Hopefully, it will be drier as well, with all of the recent rainfall and flooding issues. A very soggy weekend for the US Open Championship at Oakmont.
-
1
-
-
-
25 minutes ago, LibertyBell said:
Yes, I'd like to return to the era of the Mattinglies and Boggs, when we had the top hitters hitting over .350 and not striking out much.
That actually might be happening now with Judge and Freeman.
I think the pitching is too good these days. The MLB keeps changing the game to drum up offense to make it more exciting, missing the fact that baseball is a 3-2 type game like they play in Japan. Now, they have pitch clocks, National League Designated Hitters, shortened strike zones, no infield shifts, extra innings ghost runners, shorter fields, enforcement of the prohibition on the "sticky stuff". They already lowered the mounds in the past; now, they are talking about lowering them more or moving them back. No care for the integrity of the game, only serving to drum up offense for the fans.
I am sure Ty Cobb would not be hitting .400 today - especially if they still had the same high mound and none of these other modern inventions.

-
27 minutes ago, LibertyBell said:
Whats the difference between Miami and Jacksonville..... Jacksonville is further north but gets hotter in the summer, why?
I did run my hypothesis by Grok, and he agrees that climate change can increase average temperatures in the summer while also lowering day to day variability. So this might explain why the data shows warming, while you remember more 95F & 100F days in the past. A sufficient increase in average temperature should be more than enough to overcome the lessened variance in the future.

-
1
-
-
Upper 80s on tap for today. Should be the hottest of 2025, so far. The warmest reading observed this year at KPIT is 86F, on June 4th and on April 19th.
-
14 hours ago, OrdIowPitMsp said:
High of 73 in Minneapolis, 94 in Des Moines. Quite the airmass change for anyone traveling on I-35 today.
Actually, made it up to 95F at Des Moines yesterday, with a record-tying 96F at Waterloo, Iowa!
-
8 minutes ago, LibertyBell said:
Whats the difference between Miami and Jacksonville..... Jacksonville is further north but gets hotter in the summer, why?
By hotter, I'm assuming you mean by maximum temperatures. By mean temps, Miami is about 2-3F warmer than Jacksonville. I would chalk that up to JAX having a more continental-influenced climate. While both are on the coast, Miami is at the tip of peninsular Florida. The increased latitude is less significant in the summertime, with insolation probably being about the same at both locations.
-
3 minutes ago, TheClimateChanger said:
It will probably be like Miami. Looking at a linear regression of 90F+ days, we can see an increase from 31 to 117 such days since 1960. In 1972, there were only 3 days at or above 90F for the entire year! So it went from about one month of 90s to about 1/3 of the calendar year in the 90s.

Although I think Bristol, Tennesee is probably a better analog. 20 years ago, a regression from 1960 shows very little increase in 90+ days. The same regression run through 2024 now shows an increase of more than 3 weeks of such days. Definitely illustrates the folly of extrapolating from an existing trend without looking at what's going on behind the data. If one had examined the Bristol data closely, they would have noted an increase in the mean high temperature but found the increase in 90+ days somewhat offset by a decrease in internal variability [i.e., day-to-day variance]. So once normal highs climbed a bit more, the number of 90+ days exploded in the last 20 years.
1960-2004

1960-2024

-
On 6/10/2025 at 11:34 AM, LibertyBell said:
Hopefully an increase in 95 and 100 degree days too even with onshore flow (with higher SST.)
It will probably be like Miami. Looking at a linear regression of 90F+ days, we can see an increase from 31 to 117 such days since 1960. In 1972, there were only 3 days at or above 90F for the entire year! So it went from about one month of 90s to about 1/3 of the calendar year in the 90s.
-
On 6/10/2025 at 11:45 PM, dWave said:
Normal highs already max out in the upper 80s. Since July daily averages are pretty flat, the avg high for the month is nearly the same.
87/72 at LGA
EWR 87/70
Teterboro 87/69
Meanwhile Central Park tops out at 85/71.
Philly 88/70
Down in DC they now have normals in July at 90...90/73
To clarify, I was referring to the mean high temperature for all of meteorological summer. As an example, a linear regression for Newark shows an increase in mean summer highs from 82.9F to 85.8F between 1960 & 2024. So the mean summer high should reach into the upper 80s over the next couple decades, at which time, July averages would probably be near 90F.

-
1
-
-
Second 90F reading of the short season to date at O'Hare Airport in Chicago.
-
1
-
-
51 minutes ago, bluewave said:
The atmosphere was much drier in those days than it is now. So even though the background pattern wasn’t as warm, it was easier near the shore with westerly flow to reach 100° from time to time. So extended 90° heatwaves were easier to achieve. This is why we haven’t had a 20 day official heatwave around the region since 1988.
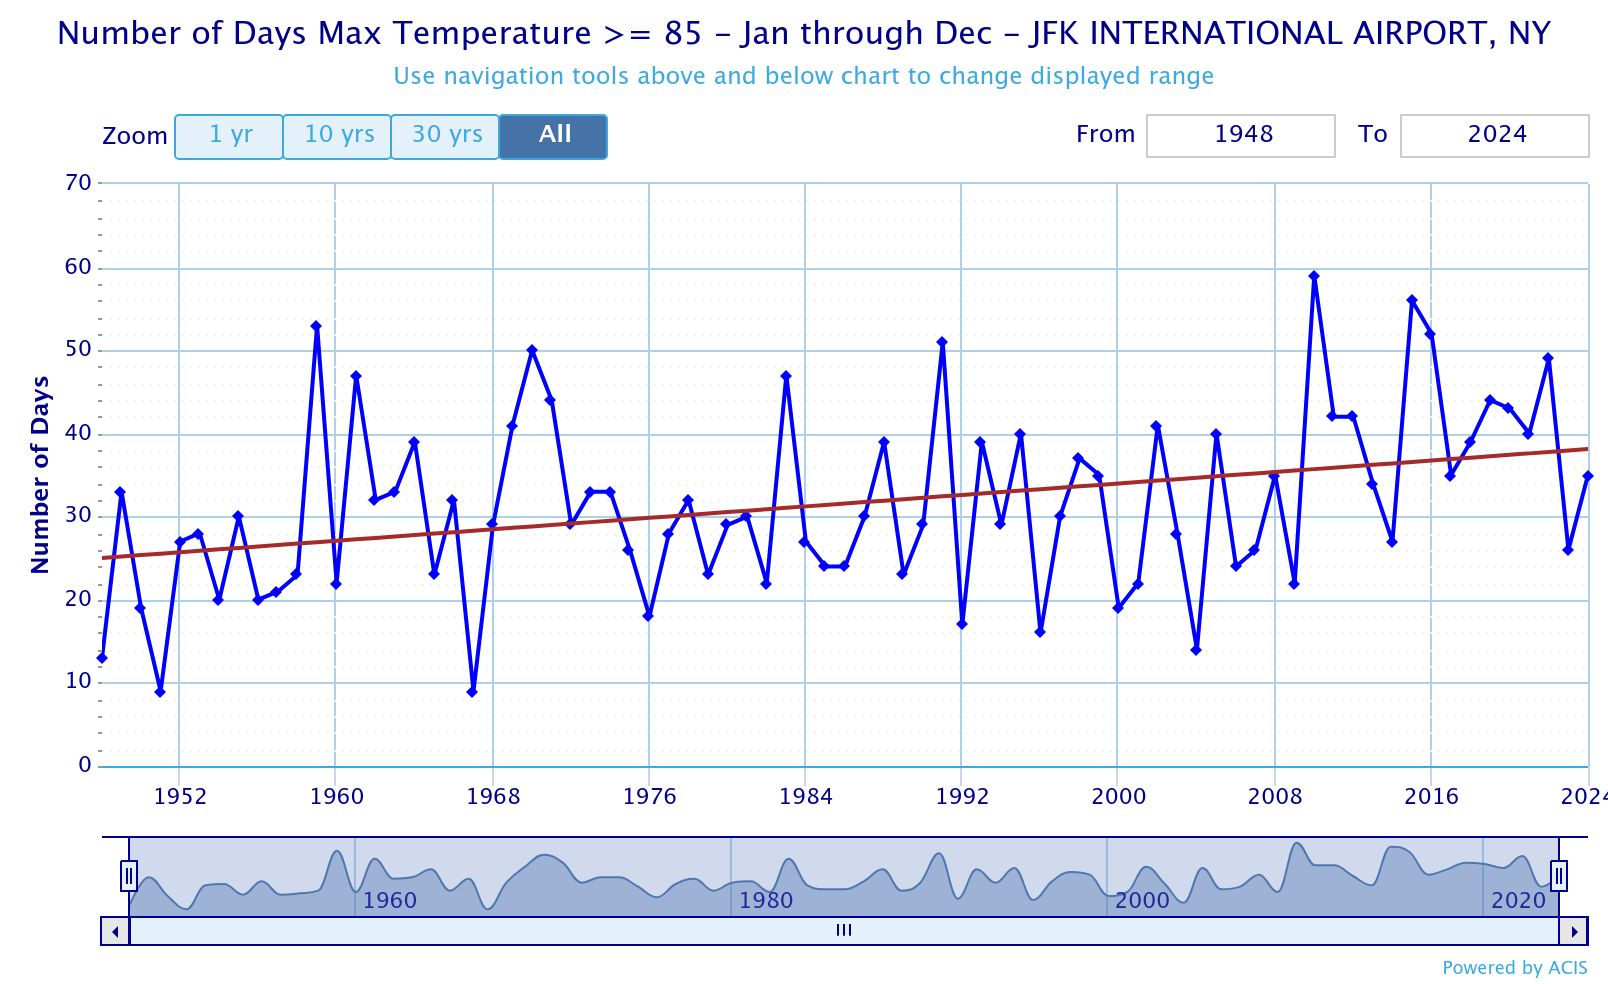
While the overall summer temperatures have been on the rise, the high end 100°+ heat has been missing since 2013 due to all the onshore flow and rain. Plus the higher dewpoints allow the 70° minimums to increase at faster rate than the 90° maximums. Also notice how much faster the 85°day count is increasing above the 90° day count. This is pointing to a much more humid climate with more clouds and showers. Higher dew points also prevent the overnight lows from dropping as low as they used to.
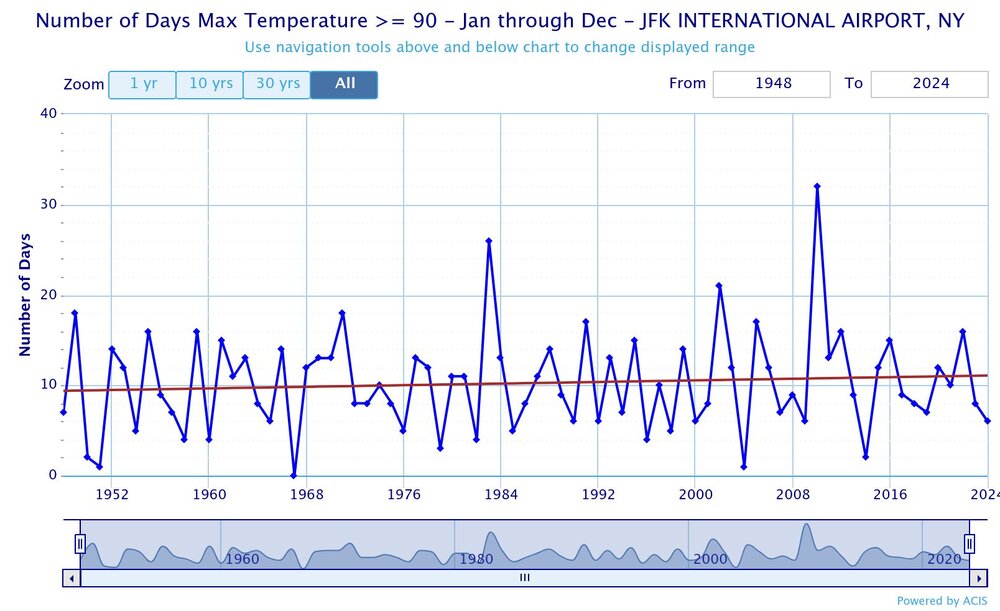

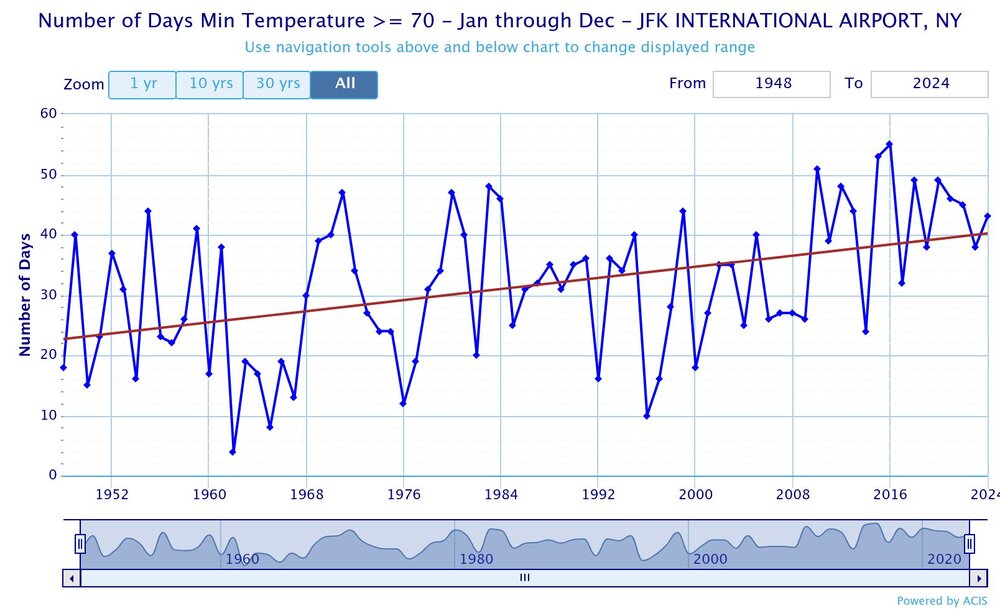
Mean summertime high temperatures have risen by 2-3F since 1990. If that trend continues, average summer highs should reach the upper 80s around NYC by 2050, by which time, there should be a marked increase in the number of 90F days [similar to the observed increase in 85F days over the past several decades].
-
12 minutes ago, LibertyBell said:
I thought Watts Up With That is a climate change skeptic site though?
Yes, it is, but I never figured out how this research was supposed to suggest less warming. Assuming the findings are robust, given the number of rooftop stations was much greater decades ago, wouldn't that suggest that U.S. temperature changes are actually greater than reported, not less?
-
25 minutes ago, LibertyBell said:
Have you noticed that the return period for 100 degree days has been getting longer at JFK too? Back in the 40s, 50s and 60s it used to happen every few years and now it's only once a decade or so.
It's even getting longer at NYC, during the 40s and 50s, I think they got 100 degree days every other year, which is even more frequent than what I experienced in the 80s and 90s before the sensor issues cropped up.
It's probably because our climate becoming more humid is making it more difficult to get higher temperatures in the summer (so a combo of a wetter atmosphere, a wetter ground and onshore flow.)
The summers between 1944 and 1955 and then 1966 were chock full of records that haven't been matched since.
1944 had a record heatwave of 8 straight days of 8+ days in August and a separate 7 day heatwave in July.
1948 had 3 days of 100+ at JFK (later matched in 2010)
1949 had 5 days of 99+ at Central Park
1953 had that record 12 day heatwave at Central Park and another heatwave of 9 day length and 4 days of 100+ split between those two heatwaves (including the highest temperature ever recorded in September, 102).
1955 had a record 16 days of 95+
1966 had 4 days of 100+ at Central Park, in both June and July. July 1966 had the highest temperature ever recorded at LGA (107) and JFK (104).
They just need to get rid of these automated weather stations, and go back to Cotton Region Shelters on rooftops, and I bet the number of 95 and 100F days would explode. Baltimore was one of the last places to get rid of its rooftop station, even after official observations moved to the airport, and it was having like a dozen days over 100F even when the official sites had zero! Keep in mind when they first moved to the airports, the instruments were generally sheltered on the roof - typically of the terminal building. It wasn't until later in the 1950s & 1960s, that they started moving to ground-based observations.


Global Average Temperature 2025
in Climate Change
Posted
Speaking of volcanos... this looks promising: