

TheClimateChanger
-
Posts
1,881 -
Joined
-
Last visited
Content Type
Profiles
Blogs
Forums
American Weather
Media Demo
Store
Gallery
Posts posted by TheClimateChanger
-
-
31 minutes ago, TheClimateChanger said:
This is kind of nonsense I'm talking about... January 22, 1906 headline of the NY Times "Winter Heat Wave Sends Crowd to Coney Island" - the high was 60F in New York City that day. But apparently crowds were flocking to the beach to beat the heat. The story continues on Page 2 talking about caterpillars dropping from trees and butterflies flying around in Rutland, Vermont.

Here's the story from Pittsburgh [then Pittsburg] from the NY Times:

Oh no! It was 74F on top of the hot roof of the Farmers National Bank Building - that's a 344' skyscraper that was tore down in 1997 BTW. But urban heat island effect didn't exist in 1906! Lol.
Anyways, the absurdity of this is hilarious. A "heat prostration" in January - why didn't the guy take off his winter coat? And why were steel and glass mills shutting down? How the heck did they operate in the summer?
Oh, and some things never change - that blizzard the Weather Bureau forecast, yeah that didn't happen. It apparently was a blizzard in the middle of the country with temperatures as low as -16F in Missouri though.
If the media covered the recent heat in Michigan the same way. Crowds converged on Grand Haven beach to escape the searing sun. Butterflies spotted in Gaylord. Two heat prostrations in Detroit. Auto industry closed up shop and evacuated its plants. A thermometer in the sun somewhere registered 85 degrees. But bundle up because a blizzard is hitting tomorrow.
-
On 1/30/2024 at 10:07 AM, TheClimateChanger said:
February has been bonus spring in 3 of the last 7 years (2017, 40.6; 2018, 38.8; and 2023, 39.7). Might as well make it 4 of 8. For reference, the March mean from 1961-1990 was 39.4F.
Make that 4 out of 8. Looks like we'll come in at 39.5F, 0.1F above the 1961-1990 mean for the month of March.
-
On 2/21/2024 at 3:14 PM, michsnowfreak said:
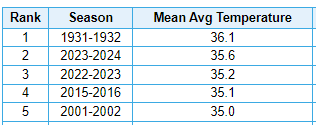
Whats even funnier...is you can read newspaper articles from other historically warm winters (1881-82, 1889-90, 1918-19, 1931-32, 1982-83, etc) and they discuss the abnormal warmth, lack of snow, and "open" winter as they called them....and manage to actually discuss the oddities of the weather WITHOUT throwing CC into every (or any) sentence. Also, they do not plaster it as a front page spread contrary to what youve heard. I know as I have a subscription to view any daily newspaper since 1837. Oh, and btw, Detroits 3 warmest winters are 1881-82, 1931-32, & 1889-90. Stay tuned for TCC's expert analysis of why those records are wrong and shouldnt count
This is kind of nonsense I'm talking about... January 22, 1906 headline of the NY Times "Winter Heat Wave Sends Crowd to Coney Island" - the high was 60F in New York City that day. But apparently crowds were flocking to the beach to beat the heat. The story continues on Page 2 talking about caterpillars dropping from trees and butterflies flying around in Rutland, Vermont.
Here's the story from Pittsburgh [then Pittsburg] from the NY Times:
Oh no! It was 74F on top of the hot roof of the Farmers National Bank Building - that's a 344' skyscraper that was tore down in 1997 BTW. But urban heat island effect didn't exist in 1906! Lol.
Anyways, the absurdity of this is hilarious. A "heat prostration" in January - why didn't the guy take off his winter coat? And why were steel and glass mills shutting down? How the heck did they operate in the summer?
Oh, and some things never change - that blizzard the Weather Bureau forecast, yeah that didn't happen. It apparently was a blizzard in the middle of the country with temperatures as low as -16F in Missouri though.
-
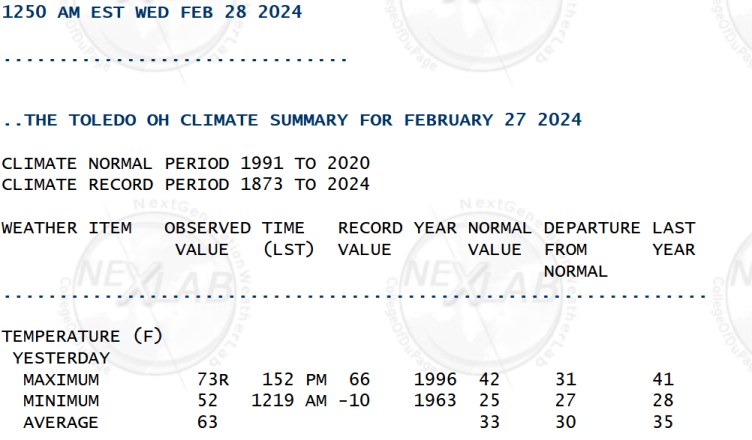
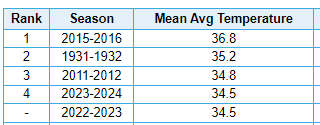
Through yesterday, this was the fourth warmest February by mean temperature in the threaded record, exceeding last year by 0.1F. By high temperature - which I feel somewhat ameliorates the impact from the downtown site - it was tied for fourth warmest with 2017. Last year was second warmest by that metric (which also means this year would have been third prior to last year).
-
1 minute ago, TheClimateChanger said:
EF-2 confirmed in Monroe County, Ohio. That was the first recorded tornado in Monroe County since June 22, 1990, and only the 3rd of record since 1950. It was also the strongest of record, exceeding an F-1 in 1969.
-
EF-2 confirmed in Monroe County, Ohio. That was the first recorded tornado in Monroe County since June 22, 1990, and only the 3rd of record since 1950. It was also the strongest of record, exceeding an F-1 in 1969.
-
19 hours ago, Chinook said:
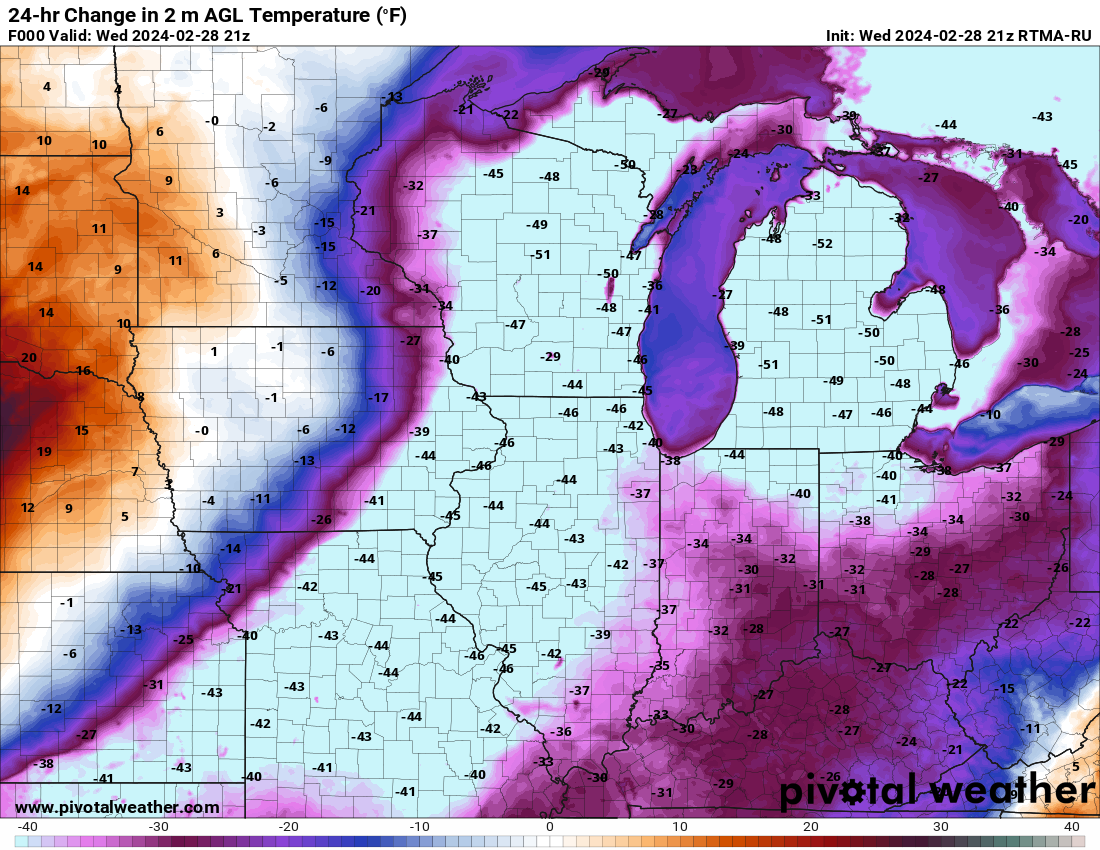
wow, didn't realize it got to 70 degrees north of Lansing.
current 24 hour temp change. As for yesterday, I posted one of these that had a 60 degree temperature drop in Nebraska. For all I can remember, a value of 60 degrees downwards is close to the max I've seen in Wyoming and such areas.

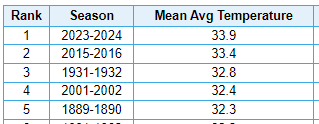
It made it up to 73F as far north as Traverse City, Michigan, which exceeded the prior monthly record by 7F. Prior to this year, it had only reached 60 or better in February in 4 years (1984, 1999, 2000, and 2017) since 1896, and only exceeded 60 in two of those years (2000 & 2017). Absurd, especially considering the identical 73F reading at Toledo was also a monthly record, and the Michigan statewide record was 72F from 1999.
-
 1
1
-
-
6 minutes ago, TheClimateChanger said:
First recorded tornado in Monroe County since June 22, 1990. Appears to be only the third recorded since 1950, and the strongest on record. Prior was an F-1 in 1969. I suspect some of this is due to the remoteness of the area (only like 10,000 people), but still quite rare.
-
-
1 hour ago, LibertyBell said:
what was the smallest Don?
one thing I want to understand is how is this winter is supposedly colder than last winter when we had two extreme single digit arctic shots last winter and this winter is setting all sorts of high min records?
see this is why I dont trust average temperatures, this winter has been tangibly warmer than last winter, regardless of what the so-called "averages" say.
Weird. Looks like that's limited to immediate coastal locations. Most of the northeast, and fact much of the country east of the Mississippi (at least at similar latitudes), was warmer this winter.
Even as close inland as places like Scranton, Williamsport, and Albany:
Albany, NY
Williamsport, PA
Scranton, PA
Nearby Poughkeepsie, New York is tied with last winter:
-
 1
1
-
-
On 3/29/2023 at 9:18 PM, michsnowfreak said:
The march high temp warmed a lot more than the min temp at Detroit.
A more fair comparison would be the first 30 years of climate data and the most recent 30 years. Not a small 13 year sample of avg high temps that includes the record march heat of 2012.
The avg March temp for Detroit's first 30 years of data (1874-1903) and the most recent 30 years (1993-2022) show a difference of 4.5° (33.0 to 37.5).
March is by far the month that has warmed the most since records began, and spring by far the season that has warmed the most. Locally, it is not even a contest. Spring/Summer have warmed much more than Winter/Autumn. In fact, over the past 100 years, there has been NO warming in January or October at Detroit, but March continues to see the most.
I think if you transported someone from 1880 to 2023 the technology may overshadow the part that march is a few degrees warmer
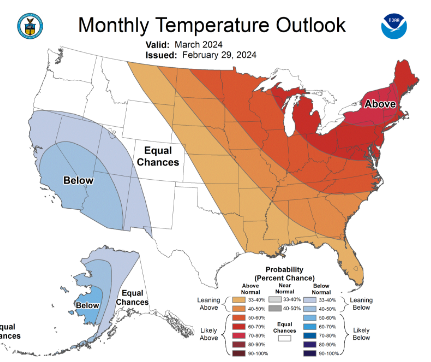
Also, while you received positive feedback, I strongly disagree. The 13-year period is now 14 years, and soon to be 15. There was minimal change with 2023 added into the mix, and 2024 is shaping up to be another warm March in the area of concern (see below).
And if you are saying, I should include the first 30 years for all climate sites - no, this is specifically comparing 19th century data to the modern era. Why would I include data gathered from years other than those in the 19th century? Moreover, the locations that have a full 30 years of data from the 19th century [or close to it] actually show MORE warming in general than sites with an abridged history! Why? Well, because it was warming then too! So, it's not like I'm cherry-picking the data to make a point.
Here's an additional location with plenty of 19th century data:
Lansing/East Lansing, Michigan
1864-1900: 39.9F
2010-2023: 45.4F (+5.5F)
-
 2
2
-
-
As we head into March 2024, figured I'd update this analysis through 2023. Most places cooled slightly, especially MSP; however, southern and eastern locations generally warmed slightly or stayed the same.
Milwaukee, Wisconsin
1871-1900: 37.1F
2010-2023: 44.1F (+7.0F)
Detroit, Michigan
1874-1900: 39.7F
2010-2023: 47.3F (+7.6F)
Chicago, Illinois
1873-1900: 40.9F
2010-2023: 47.7F (+6.8F)
Cleveland, Ohio
1872-1900: 40.9F
2010-2023: 48.1F (+7.2F)
Minneapolis, Minnesota
1873-1900: 36.7F
2010-2023: 42.8F (+6.1F)
Buffalo, New York
1874-1900: 37.3F
2010-2023: 43.3F (+6.0F)
Rochester, New York
1872-1900: 37.6F
2010-2023: 44.4F (+6.8F)
Erie, Pennsylvania
1874-1900: 40.3F
2010-2023: 45.0F (+4.7F)
Pittsburgh, Pennsylvania
1875-1900: 47.6F
2010-2023: 50.7F (+3.1F)
Keep in mind at Pittsburgh, this is comparing downtown records (elevation: 780-800 feet) to airport records (elevation: 1200 feet), and about 15 miles northwest, which hides a lot of the warming trend.
Washington, D.C.
1872-1900: 50.2F
2010-2023: 57.6F (+7.4F)
New York, New York
1869-1900: 43.4F
2010-2023: 51.1F (+7.7F)
Boston, Massachusetts
1872-1900: 42.0F
2010-2023: 46.9F (+4.9F)
Philadelphia, Pennsylvania
1874-1900: 47.2F
2010-2023: 53.8F (+6.6F)
Atlanta, Georgia
1879-1900: 61.1F
2010-2023: 66.7F (+5.6F)
Memphis, Tennessee
1879-1900: 60.6F
2010-2023: 64.7F (+4.1F)
Raleigh/Durham, North Carolina
1887-1900: 59.1F
2010-2023: 63.7F (+4.6F)
Charlotte, North Carolina
1879-1900: 59.9F
2010-2023: 65.1F (+5.2F)
-
On 3/29/2023 at 9:18 PM, michsnowfreak said:
The march high temp warmed a lot more than the min temp at Detroit.
A more fair comparison would be the first 30 years of climate data and the most recent 30 years. Not a small 13 year sample of avg high temps that includes the record march heat of 2012.
The avg March temp for Detroit's first 30 years of data (1874-1903) and the most recent 30 years (1993-2022) show a difference of 4.5° (33.0 to 37.5).
March is by far the month that has warmed the most since records began, and spring by far the season that has warmed the most. Locally, it is not even a contest. Spring/Summer have warmed much more than Winter/Autumn. In fact, over the past 100 years, there has been NO warming in January or October at Detroit, but March continues to see the most.
I think if you transported someone from 1880 to 2023 the technology may overshadow the part that march is a few degrees warmer
I wonder how much the addition of 2023 & 2024 will affect this analysis. Soon to have a full 15 years of data! That's half of a standard climatological period.
-
On 2/25/2024 at 2:08 PM, michsnowfreak said:
I had never really heard of ACE until recently. Is it something that we can put on par with things like NAO, PDO, etc? And how high does this year's ACE rank? I may have missed it earlier in the thread.
What's ironic looking at the top 10 highest ACE years and following winters, the worst one here was 1995-96, and that was a product of being in a cold, dry screwzone. It was a cold winter, just a nightmare of missed snow chances. Most of the others were good winters, and nearly all had an abnormally snowy month (a common characteristic of ninas locally as well). But the best takeaway is that none of them were close to the widespread atrocity this winter was.
Weird. That was a top 5-10 snowy winter for many locations in the Great Lakes [Pittsburgh, Cleveland, Buffalo, Erie]. Heck, Charleston, WV had 106.0" of snow that winter! That's nearly a foot more than Detroit's top snowy winter (2013-2014) and about 27" more than second place. This is why I remember Detroit as a snowhole. Growing up, there was frequently less snow in NW Ohio & SE Michigan than most places in ALL directions.
-
1
-
-
-
6 hours ago, LibertyBell said:
yep, grass fires and brush fires I just didn't know fires like that can get so BIG and so extensive. There has to be a strong wind component too
I think dry grasses and brush are among the fastest burning fuels. That's one of the tricks the deniers do by saying wildfires were worse in the 1800s. Most of the Plains were still pristine grasslands, and there was no fire prevention effort. So dry grassfires could swallow vast acreage quickly in the typically windy Plains. It's literally impossible to have fires on that scale today, since it's all agricultural land. But these fires wouldn't have produced anywhere near the quantities of smoke from the recent conflagrations in western and northern North America.
-
1
-
-
3 minutes ago, TheClimateChanger said:
A couple of other locations in the northern highlands of the Commonwealth, with shorter PORs:
DuBois - Jefferson County Airport [elev. 1800'] (records date to 1962)
Note: No data for 1997-98 at DUJ, which admittedly would probably be in Top 10 otherwise.
Bradford Regional Airport [elev: 2100'] (records date to 1957)

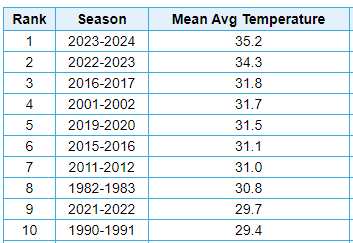
I'll be honest. Prior to 2022-2023, I wouldn't have even thought a winter mean this high to be possible at these elevations in northern Pennsylvania.
-
6 hours ago, Bubbler86 said:
Here are the numbers for our other major recording spot, Williamsport. Locked in as the #2 warmest winter in record keeping history at .8 above last year with one day to go. Also of interest, the second graphic is an Altoona station that has records back to the 40's with this winter being the warmest ever or tied for it depending on any movement today.


A couple of other locations in the northern highlands of the Commonwealth, with shorter PORs:
DuBois - Jefferson County Airport [elev. 1800'] (records date to 1962)
Note: No data for 1997-98 at DUJ, which admittedly would probably be in Top 10 otherwise.
Bradford Regional Airport [elev: 2100'] (records date to 1957)
-
1
-
-
Astounding. Even ChesCo can't manipulate the data enough to hide this recent wintertime warming.
-
1
-
-
4 minutes ago, TheClimateChanger said:
Personally, and I'm probably going to get flamed for this, but I think the data adjustments are insufficient and it's actually warmed considerably more than claimed by NOAA.
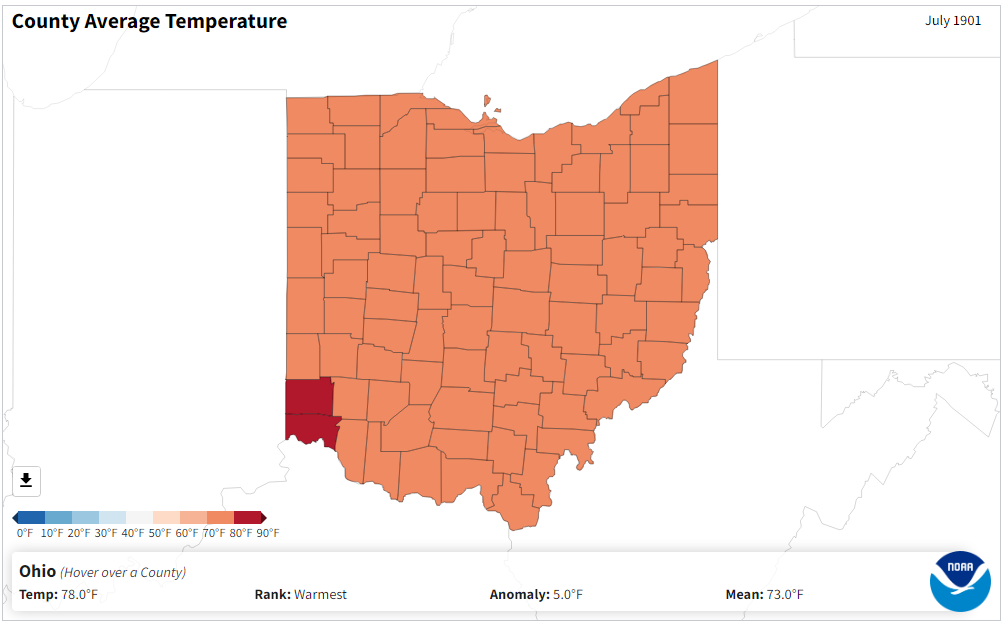
Just look at this map from NOAA for July 1901 - allegedly the warmest July on record in the State of Ohio (lol).

If you went on to the NCEI website and played around with this map, you would see it's almost identical to this hand-drawn map from the July 1901 monthly weather review. A few areas are shown as warmer on the hand-drawn map (southwest Ohio), but some areas are a bit cooler (west-central Ohio, parts of northern and eastern Ohio).
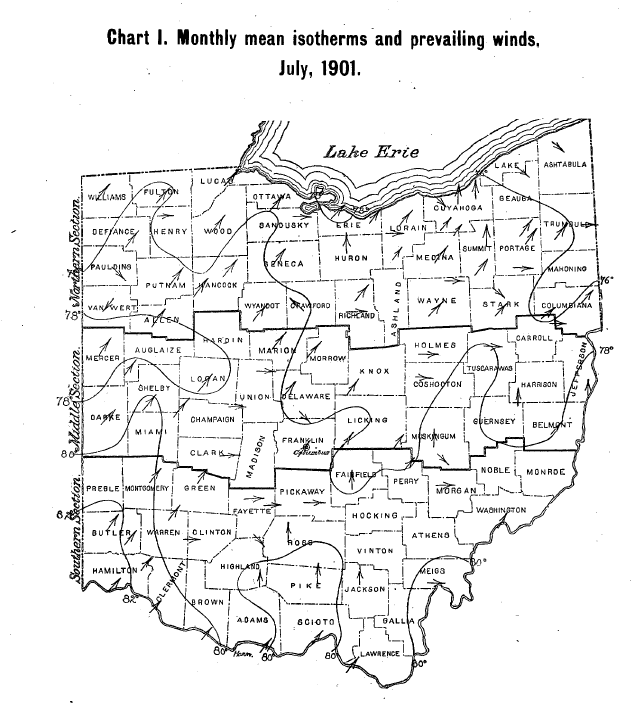
Also where are the so-called adjustments? The month was reported as 78.1F in the monthly weather review. The official number today is 78.0F.
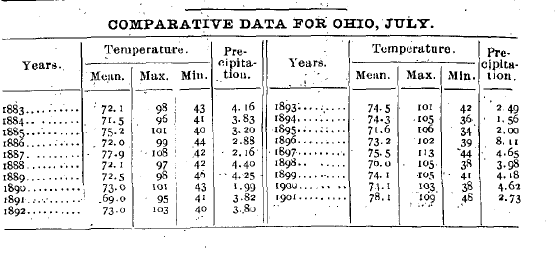
But let's evaluate some of these temperatures. Cuyahoga County is said to have been 77.2F, per NCEI. Yet the downtown city station [on a rooftop exposure!] had a mean of 76.2F. Why in the world is the county average a degree higher than what common sense would dictate is the warmest spot in the county? Same thing with Summit County. Akron is 76.7F that month, yet NCEI has Summit County at 76.8F for a county-wide average. Complete nonsense.
Despite being tied for 8th warmest in the Akron-Canton area threaded record and tied for 11th warmest in the Cleveland threaded record - these being high-quality, first-order sites [including Weather Bureau data] - NCEI has 1901 as warmest on record in Cuyahoga, Summit and Stark Counties, in Ohio. Again, this is complete nonsense, and there is ZERO chance that 1901 is actually the warmest July in Ohio.
-
1
-
-
Personally, and I'm probably going to get flamed for this, but I think the data adjustments are insufficient and it's actually warmed considerably more than claimed by NOAA.
Just look at this map from NOAA for July 1901 - allegedly the warmest July on record in the State of Ohio (lol).
If you went on to the NCEI website and played around with this map, you would see it's almost identical to this hand-drawn map from the July 1901 monthly weather review. A few areas are shown as warmer on the hand-drawn map (southwest Ohio), but some areas are a bit cooler (west-central Ohio, parts of northern and eastern Ohio).
But where are the so-called adjustments? The month was reported as 78.1F in the monthly weather review. The official number today is 78.0F. There is essentially no adjustment for equipment bias (MMTS), no adjustment for substandard exposure, no adjustment for anything - the original calculated value is pretty much identical to what was reported. The adjustments are really only later on from the 20s/30s to 50s/60s for TOBS. Most of what is referred to as "adjustments" is just proper areal averaging of the mean temperature, including elevational effects.
The Weather Bureau offices almost exclusively collected temperature from rooftop exposures, now known to produce much warmer averages relative to a station sited over grass or sod. Yet, these locations are regularly beating 1901 using recent temperatures collected from an automated, fan-aspirated temperature sensor properly sited over grass or sod. Somehow 1901 is still hottest on record?
-
1
-
-
-
5 minutes ago, TheClimateChanger said:
It has been as cold as 31F in East Lansing during July. On July 15, 1863, the high was 69F and low 31F. No maximum & minimum temperature records for southeast lower Michigan at that time, but likely was in the 30s.
More recently, and closer to southeast lower Michigan, the low was 40F on July 1, 1988 at Toledo. I would imagine some of the colder spots were in the upper 30s.
38F at Milan on 7/3/1988 & 39F at Hillsdale on 7/1/1988. State low that year was a chilly 28F at Kenton (western U.P.) on the 1st.
-
1
-
-
20 hours ago, michsnowfreak said:
Today will likely set a new monthly maximum, as the record is 70 in 2017/1999.
Fun fact- the only month to not hit 70 is January. The warmest temperature is 67° on Jan 25, 1950, however many areas registered over 70 that day, including 72 at Ann Arbor. I suspect present day DTW would have as well. On the flip side, the only month not to have a temperature in the 30s is july, all time low being 42 on July 6, 1972. So theoretically, it is possible, though extremely unlikely, for someone in Southeast Michigan to be as cold as the 30s or as warm as the 70s any month of the year.
It has been as cold as 31F in East Lansing during July. On July 15, 1863, the high was 69F and low 31F. No maximum & minimum temperature records for southeast lower Michigan at that time, but likely was in the 30s.
More recently, and closer to southeast lower Michigan, the low was 40F on July 1, 1988 at Toledo. I would imagine some of the colder spots were in the upper 30s.
-
2
-

February 2024 General Discussion
in Lakes/Ohio Valley
Posted
Looks like Detroit will finish with a mean of 37.1F, good for third warmest February on record. In addition to the monthly maximum record of 73F on the 27th, the low of 49F on the 9th tied for warmest minimum of record in the month of February [previously set on February 20, 2018].