

TheClimateChanger
-
Posts
1,881 -
Joined
-
Last visited
Content Type
Profiles
Blogs
Forums
American Weather
Media Demo
Store
Gallery
Posts posted by TheClimateChanger
-
-
-
-
1 hour ago, TimB said:
God damnit, we’re going to get screwed out of our warmest first week of March ever because of these damn low clouds keeping us from getting into the upper 50s.
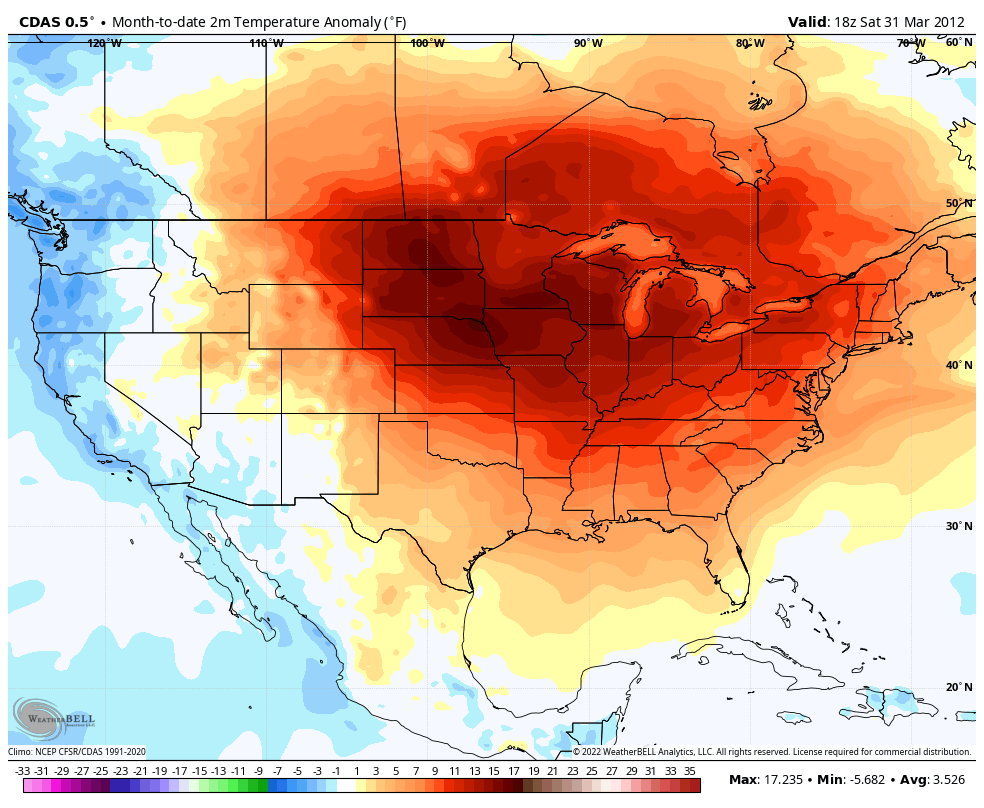
Don't worry. I am sure there will be plenty more record warmth to come. Even I've grown tired of the constant record warmth and taken a bit of a break despite that fact that various records continue to be approached or broken all over the place.
-
9 hours ago, Cobalt said:
It looks like this is referring to daily temperature records for one location, which feels way less statistically significant than a 31 day temperature average. That stripe of 1998 on the East coast might've been hit on a particularly warm day, but the month on a whole is no comparison to a March like 2012. I feel like that is worth mentioning in your post.

I'm assuming
Just a bunch of nonsense. It was actually allegedly 96F in Portsmouth, Ohio, in March 1907. Apparently Chris tossed that value. Shown below are March 22-24, 1907. Look at this nonsense. Green was 3 degrees warmer than Portsmouth, and 5-15F warmer than every other site on the 22nd. Portsmouth was 8-19F warmer than the rest of southern Ohio on the 23rd, and 7-24F warmer on the 24th. Funny how we don't see this extreme random site variation with modern equipment - almost like those values aren't very reliable, and should be tossed! Which makes it all the crazier when we do beat statewide record maxima, as in the case of Michigan in February. Not just an isolated station or two, but fully half or more of the state! So the tl;dr, this is probably the worst possible metric to gauge climate change. As you pointed out, monthly means are a much better way to evaluate that since these questionable extremes are filtered out through averaging.
-
 1
1
-
-
2 hours ago, NEG NAO said:
IMO any airport is not an ideal environment for measuring snowfall or temperature - as for temperature why does Newark always come in much warmer especially in the summer with some of its readings ?
Damn, Forky just predicted a record number of EWR is running too high this summer the other day. And it’s already started. Best prediction yet.
-
3 hours ago, PhiEaglesfan712 said:
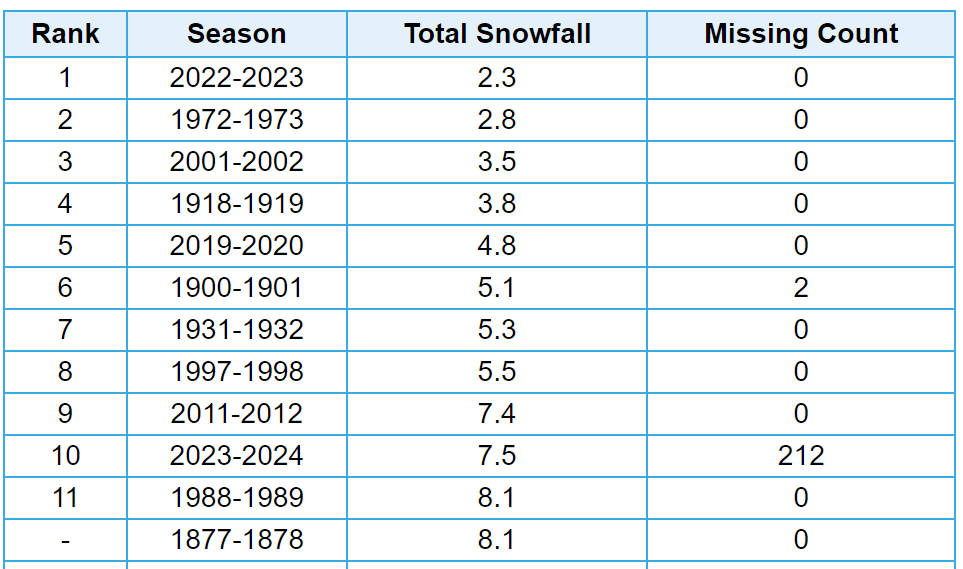
The last season in the Top 10 snowiest seasons is incorrect. It should be 2010-2011, which finished with 44.0 inches.
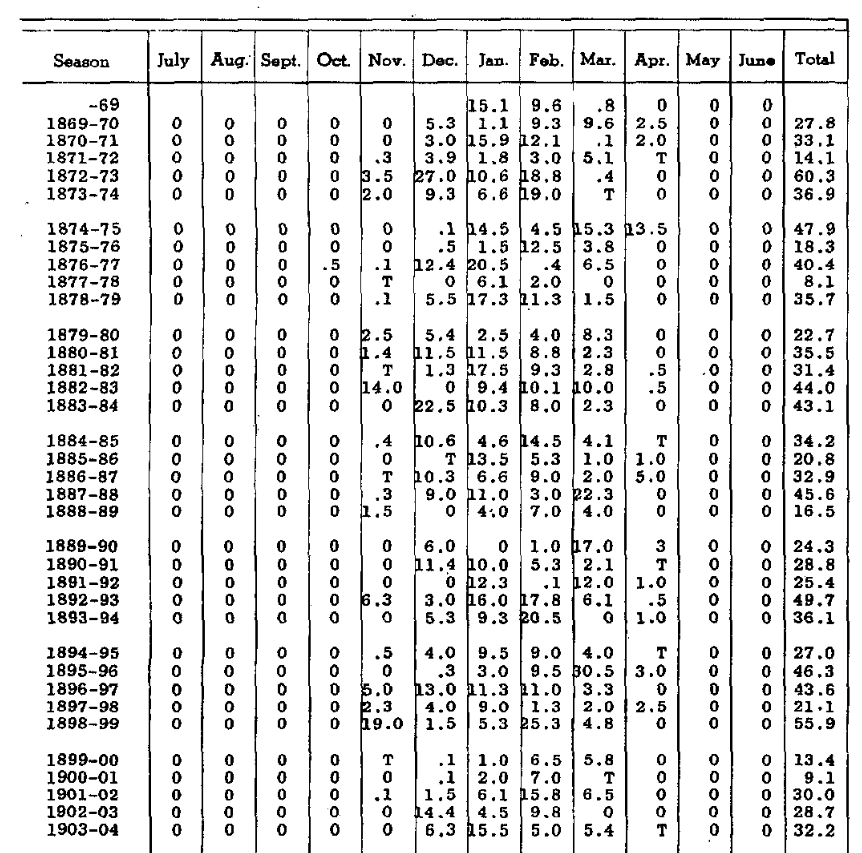
Agreed. Also, 1949-1950 was officially observed as 1.9", even though it's now given as 2.0". There was a trace of snow reported on March 2nd, but it's been changed after the fact to 0.1". Obviously, today, that would be a measurable snow on an official measuring board [0.01" of precipitation with temperatures at or below 31F all day], but at the time it was reported as a trace. I'm sure there are plenty of days like this in the official records, suggesting an undercount in earlier years.
-
-
-
-
Looks like we are going to struggle to get many 90s again. My weather station was from 1.5-2F cooler than the airport, but now since the sun came out and spring has arrived, it's 2-4F warmer during the afternoon. Still cooler at night though.
-
11 minutes ago, TheClimateChanger said:
Also, I find it rather presumptuous that you think I was trying to ameliorate a growing UHI effect. I was just trying to eliminate as much urban heat island contamination, regardless of when it occurred. Most of this is comparing data collected from rooftop and/or north-facing window enclosures in the city center to modern data collected from suburban airport sites with equipment properly installed at an appropriate height over grass or sod. The low temperatures in the early data are more impacted by this, and therefore show less warming at most of the sites.
We can see one exception to this is the data for East Lansing, where minima have increased by an astounding 8.1F in the month of March when comparing the first 34 years of data to the most recent 14 years. This is likely due to the fact that the temperature shelter was properly housed over grass or sod, and East Lansing was still very rural [especially in 1863, when the data starts].
To highlight how profound this impact is, if we look at the first 34 years of data collected at the Michigan State Agricultural College [now Michigan State University], the mean minima in the month of March was 18.7F.
The mean low temperature of the most recent 14 Marches observed at Capital City Airport is 26.8F. Further, the mean monthly minima for the month of January and February over the past 15 years is 18.2F and 18.3F, respectively. Or only slightly less than the 19th century March average.
-
2
-
-
On 3/29/2023 at 9:18 PM, michsnowfreak said:
The march high temp warmed a lot more than the min temp at Detroit.
A more fair comparison would be the first 30 years of climate data and the most recent 30 years. Not a small 13 year sample of avg high temps that includes the record march heat of 2012.
The avg March temp for Detroit's first 30 years of data (1874-1903) and the most recent 30 years (1993-2022) show a difference of 4.5° (33.0 to 37.5).
March is by far the month that has warmed the most since records began, and spring by far the season that has warmed the most. Locally, it is not even a contest. Spring/Summer have warmed much more than Winter/Autumn. In fact, over the past 100 years, there has been NO warming in January or October at Detroit, but March continues to see the most.
I think if you transported someone from 1880 to 2023 the technology may overshadow the part that march is a few degrees warmer

Also, I find it rather presumptuous that you think I was trying to ameliorate a growing UHI effect. I was just trying to eliminate as much urban heat island contamination, regardless of when it occurred. Most of this is comparing data collected from rooftop and/or north-facing window enclosures in the city center to modern data collected from suburban airport sites with equipment properly installed at an appropriate height over grass or sod. The low temperatures in the early data are more impacted by this, and therefore show less warming at most of the sites.
We can see one exception to this is the data for East Lansing, where minima have increased by an astounding 8.1F in the month of March when comparing the first 34 years of data to the most recent 14 years. This is likely due to the fact that the temperature shelter was properly housed over grass or sod, and East Lansing was still very rural [especially in 1863, when the data starts].
-
13 hours ago, Stormchaserchuck1 said:
Not only that, but the warmth seems to be accelerating! Since the satellite era in 1948, the N. Pacific Ocean High pressure for Feb-March (-PNA) is going to be after this March, a whole +25% over any 500mb anomaly on record (for a 2-month period, spanning 7 years).
But perhaps a side point is, that is a pattern. It's not random, general warming happening, it's something causing -PNA's to be more frequent in Feb-March.
I would put money on next Feb-March also featuring this -PNA, SE ridge pattern.
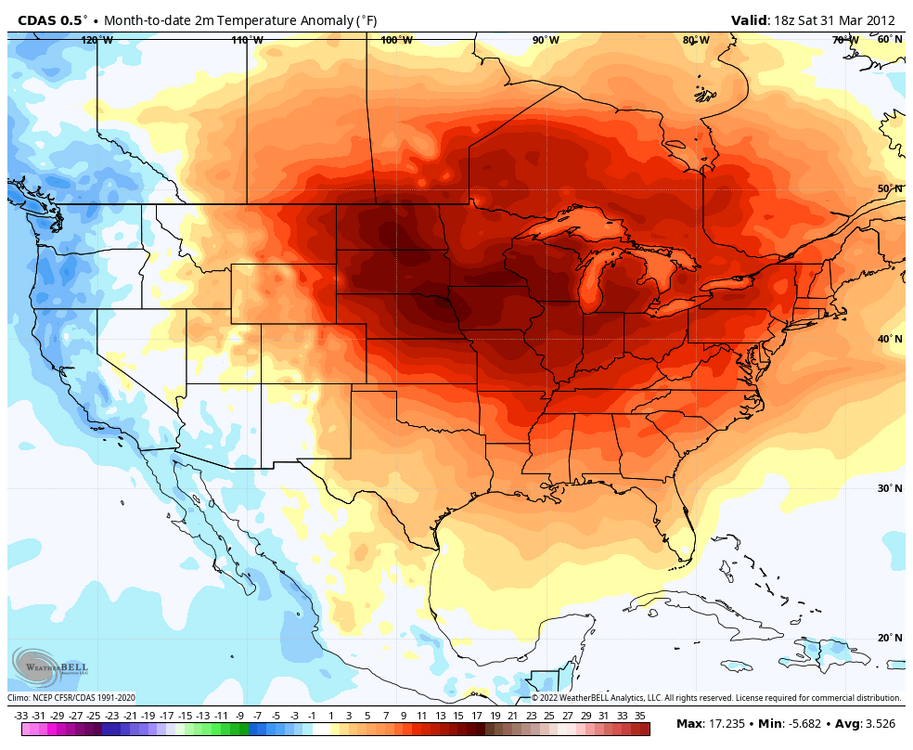
One interesting thing is the mean high temperature in April during the 19th century was closer to recent March high temperatures than the 19th century March figures at many sites. That's the case at Milwaukee, Chicago, Cleveland, Washington, New York, Philadelphia, Atlanta and Charlotte. Detroit is a push. I think that's consistent with about a 2-3 week seasonal shift forward, which I think is also supported by phenological data.
March in the 19th century had a climate we associate with the period of mid February through early March. March today is more akin to the period from mid March through early April from the 19th century.
-
8 hours ago, michsnowfreak said:
I have had extensive knowledge of Detroits entire climate record for decades, a local climate history encyclopedia if you will. Most long time posters here know this. It's interesting that all of a sudden, someone who does not live anywhere near here is an expert on our climate history
. It goes without saying that things are different now than they were 150 years ago in many aspects at any climate station.
The picking and choosing of what old data we like & don't like is ridiculous. Detroits roads were DIRT in the 19th century and the transportation was HORSES. Yes, i can see how taking temps in the exact spot now in a concrete jungle with cars everywhere is apples to apples
. Present day DTW, while absolutely properly calibrated, placed, sheltered & monitored, is still near tons of concrete, especially since new runways were built several years ago. Meanwhile, Detroit City airport hasn't been a 1st order station since 1966. All automated, the record is sprinkled with missing data, questionable temperatures, no snowfall reports, and questionable rainfall amounts- it is no more accurate or used for official purposes than any other coop site.
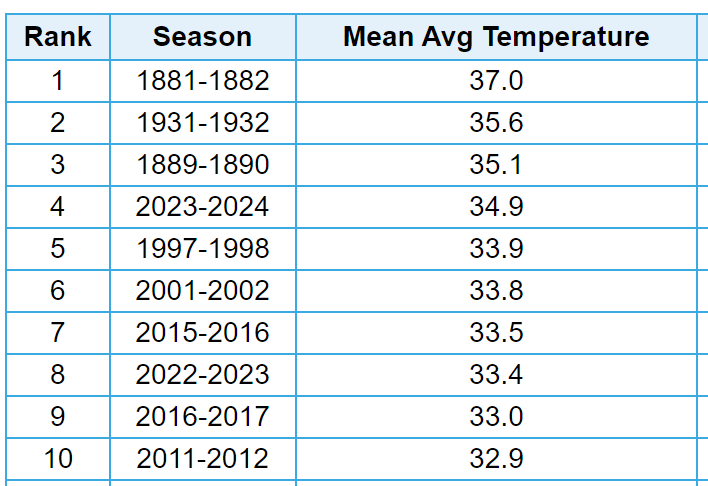
Lastly I am not surprised that the top three are being undermined by him, I fully expected it. But any and all available records for the area are similar. 1881-82, 1931-32, 1889-90 were very warm winters, and none of them had anywhere close to the stretch of wintry weather we saw for a few weeks this January. That is the difference.
Toledo also placed at 4th warmest winter, edging out 1881-82 by 0.1° but behind 1889-90, 1931-32, & 1879-80. Chicago placed 5th, behind 1877-78, 1931-32, 1879-80, 1881-82.
Both of those were at lakeside observatories on a rooftop. C'mon man, you would have loved this. These are the glory days for Detroit.
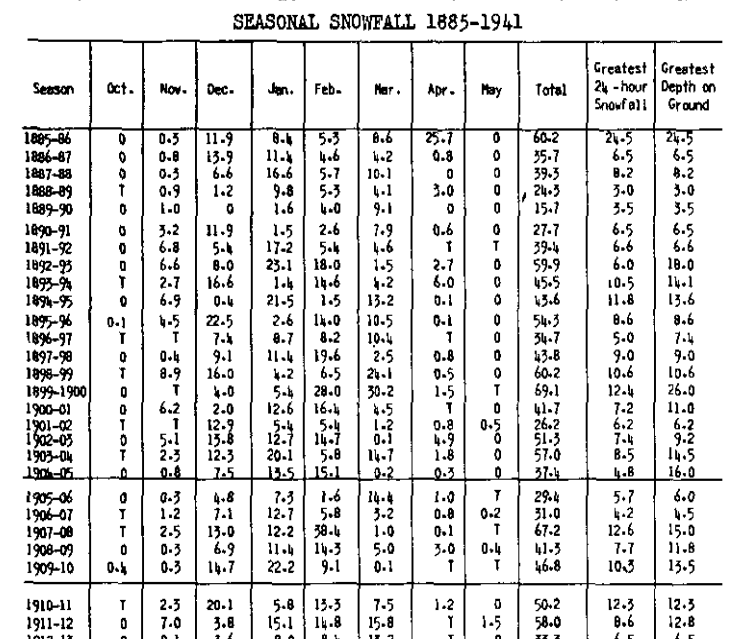
In the modern threaded record, there are only 15 years that had a peak snow depth of 12" or more at Detroit [out of 77 years]. The maximum is 24" from the winter of 1998-1999.
From 1885-1886 to 1911-12 (rounding to the nearest inch), the following peak depths were noted:
(1) 26" in 1899-1900
(2) 25" in 1885-1886 [in April, no less!]
(3) 18" in 1892-1893
(4) 16" in 1904-1905
(5) 15" in 1907-1908
(6) 15" in 1903-1904
(7) 14" in 1893-1894
(8) 14" in 1894-1895
(9) 14" in 1909-1910
(10) 13" in 1911-1912
(11) 12" in 1910-1911
(12) 12" in 1908-1909
(13) 11" in 1900-1901
(14) 11" in 1898-1899
That's 12 years with 12"+ more peak depth, and 14 with 11" or more, in just 27 winters, compared to 15 & 18 in 77 winters with daily snow depth data - including two years with peak depths higher than any observed in the most recent 77 winters. Look at the 24 hour snowfalls - at least 8 double digit snowfalls [possible additional ones, since I didn't check], including 4 years with 12"+ [and a fifth at 11.8"] with one having observed more than 24" in a 24 hour period.
This is clearly a higher frequency of big storms and deep snow depth than recent decades.
-
On 3/2/2024 at 9:58 AM, OrdIowPitMsp said:
Forecast high of 65 today. The record is 54. Smashing temperature records by 10+ degrees is becoming old news this cold season.
Earliest 70 on record at MSP is March 5th 2000. Good chance we break that record tomorrow.
Looks like another new record. Was 71 at the top of last hour at MSP.
-
Will be interesting to see whether New York City observes any more snowfall this winter. Currently, ninth least for the season dating back to the winter of 1868-1869. Only partial records available for the first winter, but there was still far more snowfall observed in the available months.
xMacis has this as 10th least; however, there was actually 9.1" observed in the winter of 1900-1901. xMacis is missing 4 inches from that winter.
-
 1
1
-
-
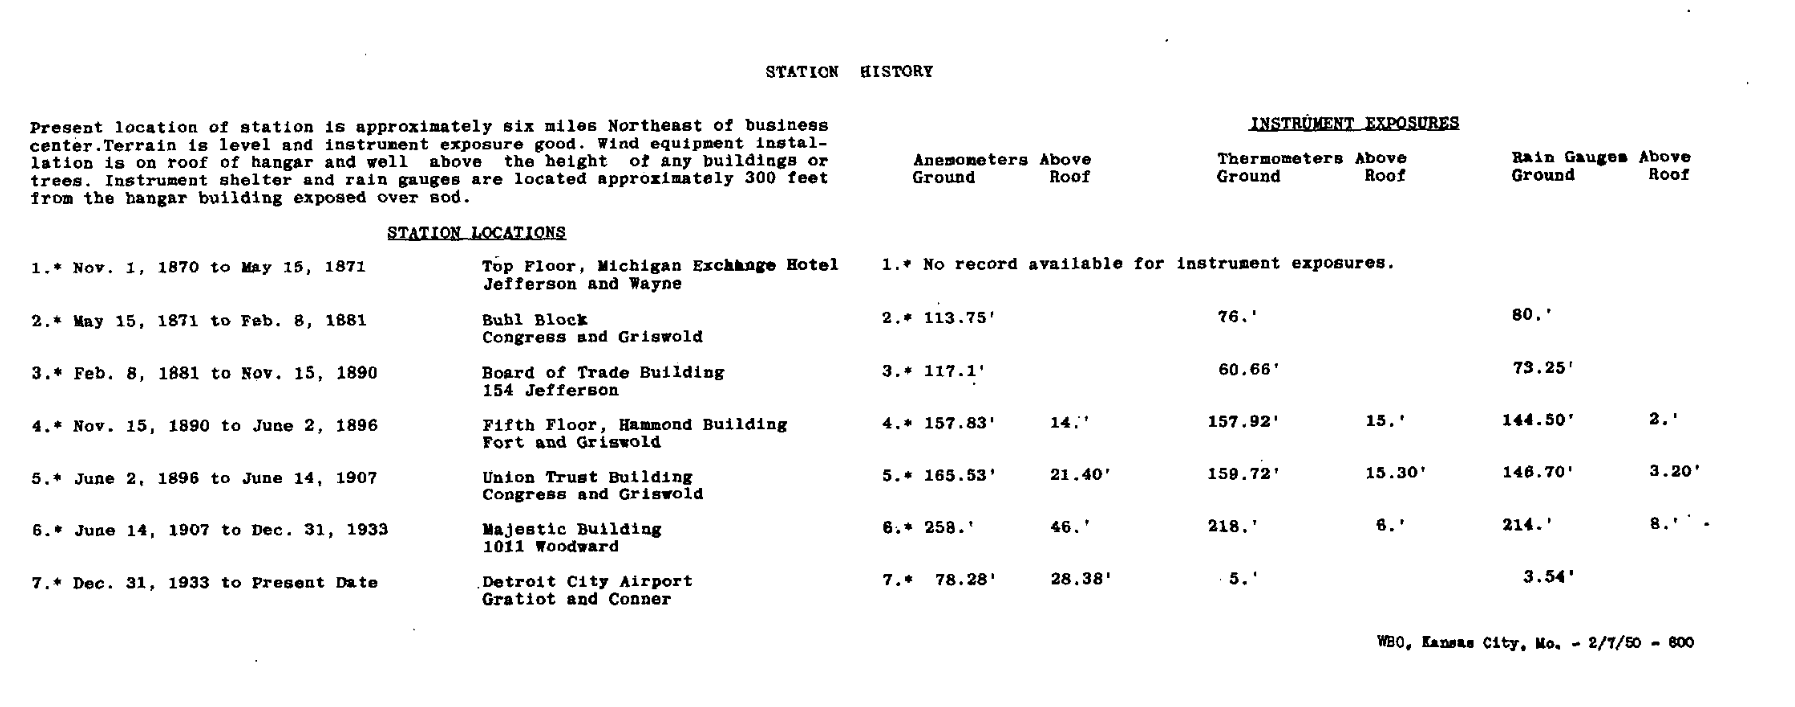
The point is we are comparing temperatures collected over grass or sod from modern aspirated temperature sensors to mercury thermometers housed in shelters in a window enclosure or on rooftops. Obviously, it would be substantially warmer if the official observation was still taken downtown on a rooftop. And then we have people in this thread lying about there being LESS UHI in 1930. The population of Detroit was 1.6 million in 1930, and the official observation site was on the rooftop of the Majestic Building downtown at 1011 Woodward.
All I'm doing is providing actual data... it was indeed the warmest on record at DET back to 1933-1934 and at DTW back to 1958-1959, as well as the fourth warmest in the threaded record back to 1874 [1870-1871, if you include the tri-daily means pre-1874], while also providing useful information about the historic location and exposure of the official station in the threaded record, and countering disinformation.
Station history from 1949 annual publication:

Useful information on impacts of rooftop exposure versus sod/grass: How not to measure temperature, part 48. NOAA cites errors with Baltimore's Rooftop USHCN Station – Watts Up With That?
-
13 minutes ago, Stebo said:
The instrumentation at DTW is none of this, I don't know what your motive here is but you might want to stop it. The instruments on the field have been in the same spot for almost 40 years and my office where we would take back up readings if needed isn't some north facing sub-standard office. We are in a ramp control tower with 360 degree view of the entire airfield.
I’m talking about the city office records, which were indeed a north-facing window exposure for the first several years, and rooftop exposure thereafter.
-
Warmest February on record in UAH at +0.93C. Also ties October 2023 for highest anomaly of any month.
-
-
Difficult to unseat those historic downtown city office readings with a sub-standard north-facing window or rooftop exposure for the instrument shelter, and the enhanced UHI and proximity to the river. But fourth place is still quite impressive. Warmest since 1931-1932 officially.
-
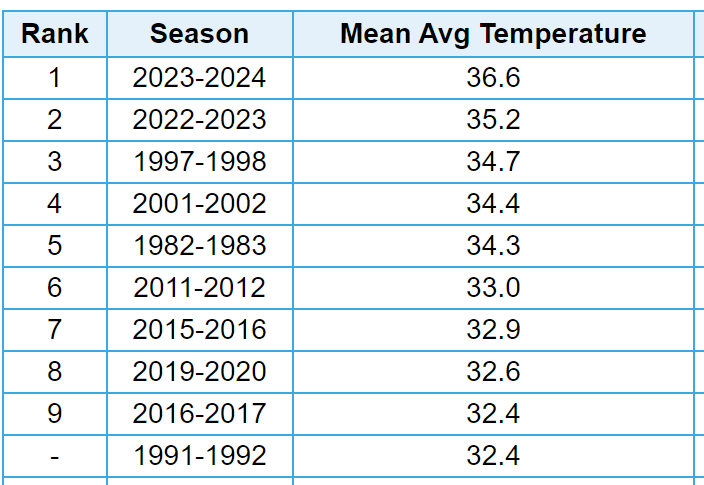
With meteorological winter in the books, here is how things shaped up in southeast Michigan.
It was the fourth warmest in the threaded record (dating to 1874-1875). It was the warmest on record at Detroit City Airport (dating to 1933-1934) and the warmest on record at Detroit Metropolitan Wayne Airport (dating to 1958-1959). Interestingly, the 36.6F mean temperature at DET [which was the official observation site from 1934-1966] would have placed second warmest in the threaded record. Last winter's value of 35.2F would have placed third [or fourth if you also included this winter].
The station thread is as follows:
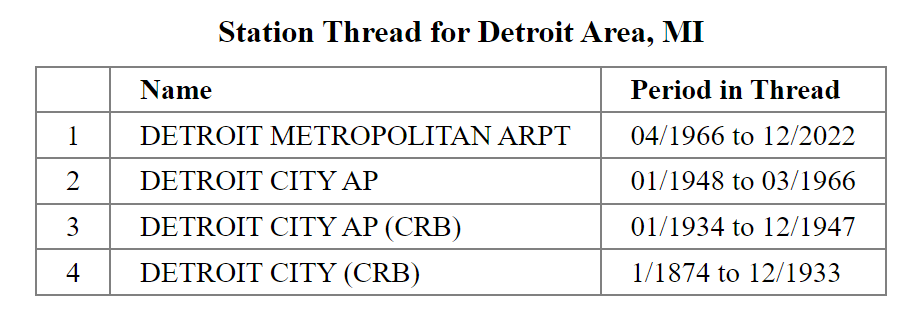
Threaded record
City Airport
Detroit Metropolitan Wayne International Airport
-
7 hours ago, cyclone77 said:
Mid to upper 60s today, and another run at 80 tomorrow. It's as dry as a desert so the sky's the limit wrt temp potential.
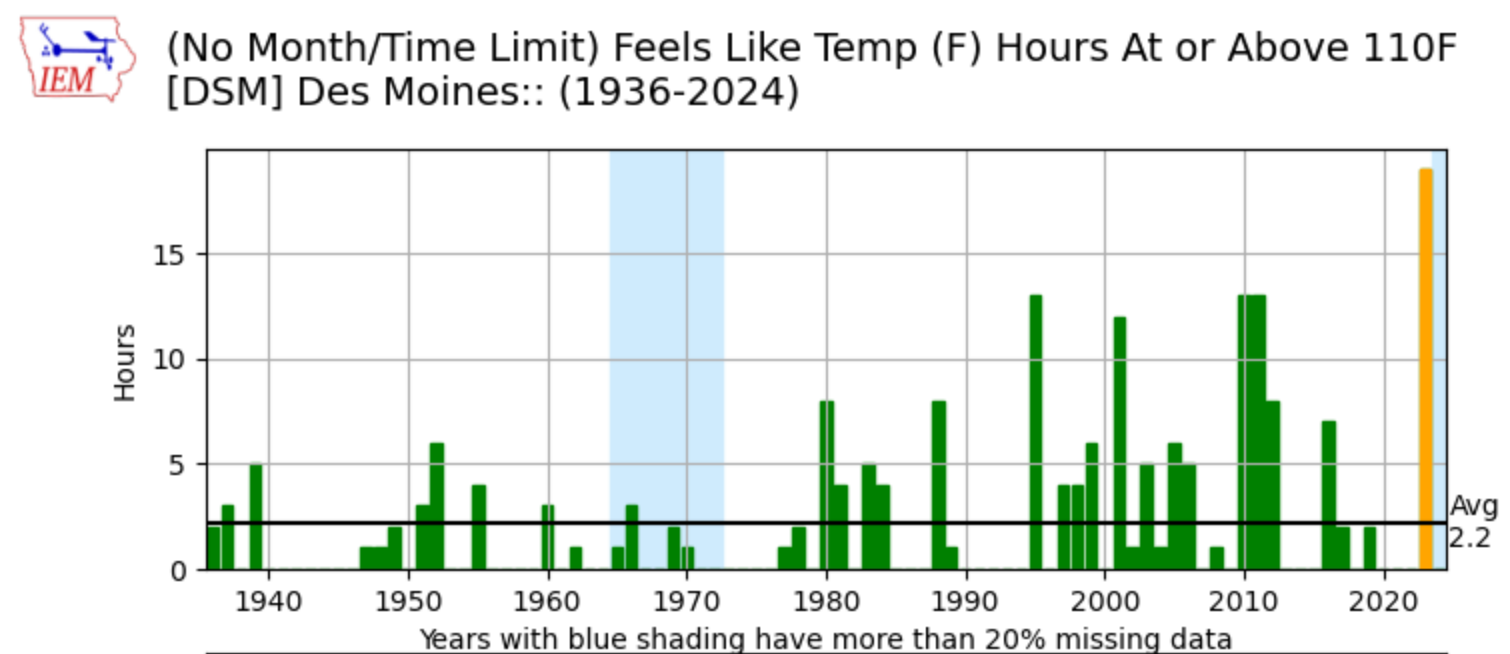
Have to wonder if we will see a repeat of these apparent temperatures this coming summer in the Midwest.
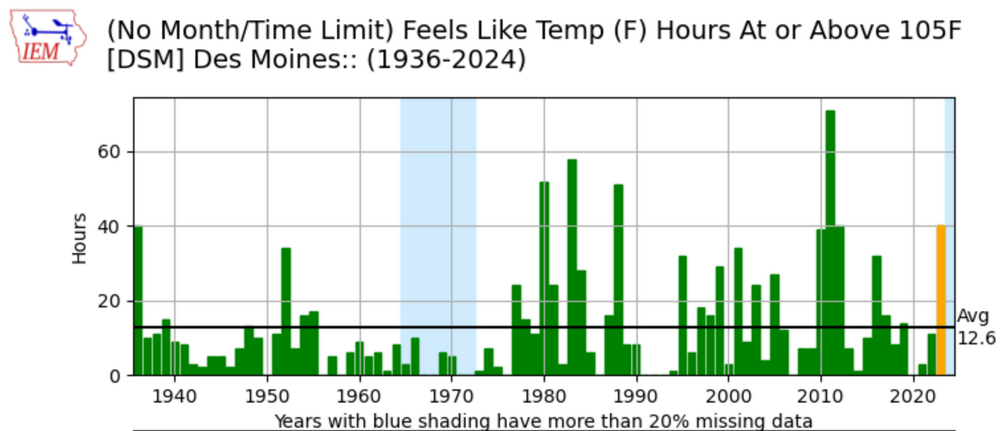
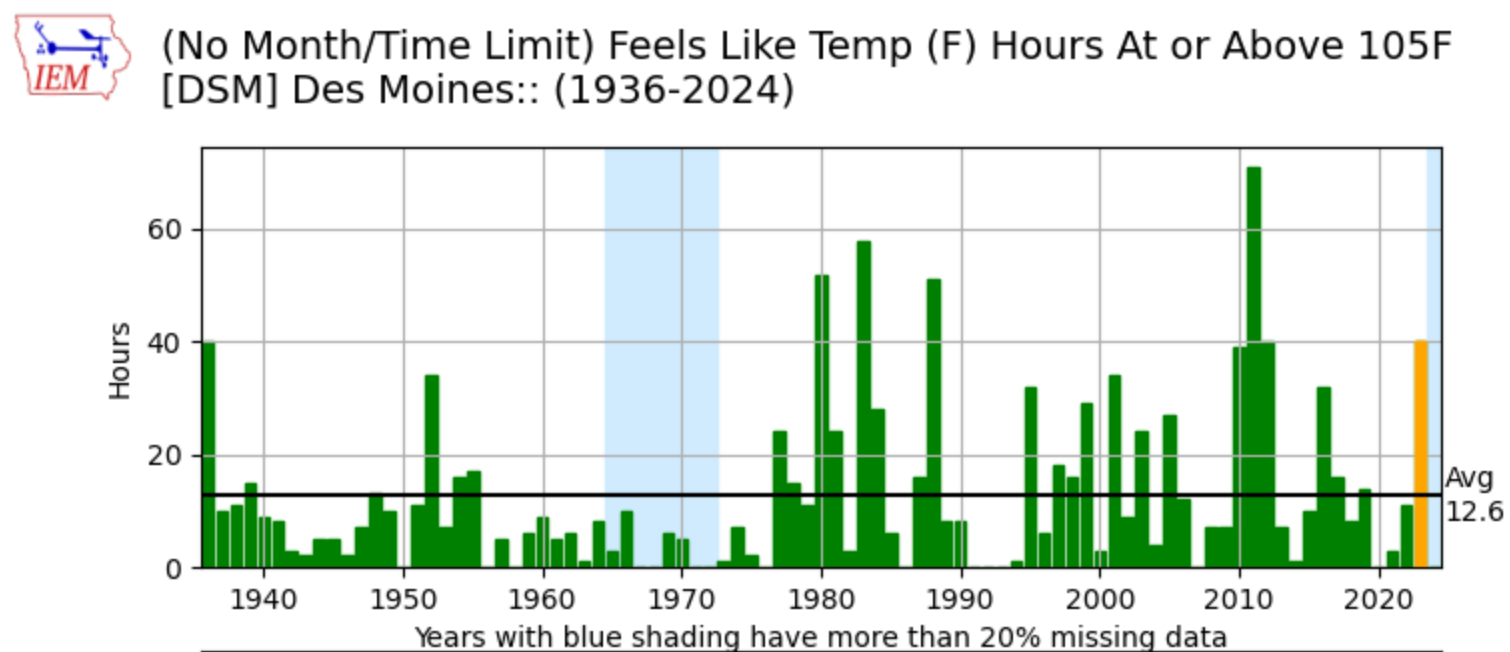
19 hours of 110+ heat indices last summer in Des Moines, beating the previous record of 13 hours from 1995, 2010, and 2011. The hottest summer on record in Des Moines (1936) had just two hours.

Not quite as impressive with 105F+ heat index hours, but still tied with 1936 & 2012. And behind only 1980, 1983, 1988 and 2011.
-
8 hours ago, CoraopolisWx said:
Where's the page on the NWS site that has the years of each reporting location.
It used to be with various records, but I can't find it now. Thanks
Yeah, I was trying to find it. I did locate this page: https://www.weather.gov/pbz/stationhistory
But I thought there was a different one.


Pittsburgh/Western PA Spring 2024
in Upstate New York/Pennsylvania
Posted
A little stat padding spring snow that will melt in between each snowy interval.