

TheClimateChanger
-
Posts
3,581 -
Joined
-
Last visited
Content Type
Profiles
Blogs
Forums
American Weather
Media Demo
Store
Gallery
Posts posted by TheClimateChanger
-
-
2 hours ago, bluewave said:
All those 1934 records were the result of the farmers essentially turning the Great Plains into a giant paved over parking lot by removing the top soil. If we had maintained the same practices and not expanded the irrigation to record levels since then, those figures would get surpassed at least once every decade. The record monthly low of 70° for May at International Falls the other day is more impressive than any of those 1934 records. Simply for the fact that INL is one of the most rural areas in the U.S. and it’s on the Canadian Border. Anytime you see a record like that in what is considered the icebox of the U.S. you have to take notice. While the new all-time May max was only exceeded by 1°, that 70° minimum is 4° warmer than any other on May minimum on record for INL. It’s also the earliest 70° minimum by over a month.
Top 5 warmest May minimum temperatures at International FallsTime Series Summary for INTERNATIONAL FALLS INTL AP, MN - Month of May
Click column heading to sort ascending, click again to sort descending.1 2025 70 19 2 1992 66 0 - 1988 66 0 3 1991 64 0 - 1919 64 0 4 2018 63 0 - 2014 63 0 - 1986 63 0 5 2021 62 0 - 2007 62 0 - 1980 62 0 - 1955 62 0 - 1918 62 3 First/Last Summary for INTERNATIONAL FALLS INTL AP, MN
Each section contains date and year of occurrence, value on that date.
Click column heading to sort ascending, click again to sort descending.2025 05-12 (2025) 70 - - - 1995 06-17 (1995) 70 06-17 (1995) 70 0 2020 06-17 (2020) 70 06-17 (2020) 70 0 2001 06-25 (2001) 71 08-05 (2001) 77 40 2002 06-29 (2002) 70 09-08 (2002) 73 70 2 hours ago, bluewave said:All those 1934 records were the result of the farmers essentially turning the Great Plains into a giant paved over parking lot by removing the top soil. If we had maintained the same practices and not expanded the irrigation to record levels since then, those figures would get surpassed at least once every decade. The record monthly low of 70° for May at International Falls the other day is more impressive than any of those 1934 records. Simply for the fact that INL is one of the most rural areas in the U.S. and it’s on the Canadian Border. Anytime you see a record like that in what is considered the icebox of the U.S. you have to take notice. While the new all-time May max was only exceeded by 1°, that 70° minimum is 4° warmer than any other on May minimum on record for INL. It’s also the earliest 70° minimum by over a month.
Top 5 warmest May minimum temperatures at International FallsTime Series Summary for INTERNATIONAL FALLS INTL AP, MN - Month of May
Click column heading to sort ascending, click again to sort descending.1 2025 70 19 2 1992 66 0 - 1988 66 0 3 1991 64 0 - 1919 64 0 4 2018 63 0 - 2014 63 0 - 1986 63 0 5 2021 62 0 - 2007 62 0 - 1980 62 0 - 1955 62 0 - 1918 62 3 First/Last Summary for INTERNATIONAL FALLS INTL AP, MN
Each section contains date and year of occurrence, value on that date.
Click column heading to sort ascending, click again to sort descending.2025 05-12 (2025) 70 - - - 1995 06-17 (1995) 70 06-17 (1995) 70 0 2020 06-17 (2020) 70 06-17 (2020) 70 0 2001 06-25 (2001) 71 08-05 (2001) 77 40 2002 06-29 (2002) 70 09-08 (2002) 73 70 Those maps are always just a bunch of nonsense anyways. Martz only lists the first occurrence of a record high so it biases it toward earlier years. With that said, even using his data, 10 of 50 states have set monthly record highs since 2000. That's 20 percent of all states. Keep in mind, the data this is drawn from actually extends beyond 1895, with scattered data all the way back to 1870 [and limited data before then]. Limiting to 1895, that's 20 percent in 19.3 percent of the total years. Extending back to 1870, that becomes a fairly hefty overweighting of recent record highs. Again, especially considering that Martz only shows the first occurrence, so there are probably more recent ties not reflected on the map.
Data quality on some of these records are also highly questionable. He includes even highly questioned observations. I saw one record shown in March for the State of Missouri that was 10+ degrees warmer than any other observation from the same month. When I went back to the original document, the Weather Bureau had actually drawn a question mark by a few of the observed highs. And even some of the recognized highs are questionable by today's standards. For instance, the 112F at Martinsburg, West Virginia in July 1936. It was 105F in Kearneysville, and 103F in Hagerstown on the same day. Is that level of discrepancy plausible for a daytime high temperature? @FPizzand @ChescoWxwould be having a conniption fit. People are constantly complaining about ASOS readings a couple of degrees too high on here.
-
-
Just now, TheClimateChanger said:
Here's the difference for each site. The rankings have 1978 as 0.4F warmer in this District. Idk.
Coatesville 1 SW: 0.7F cooler in 1978
Devault 1 W: 0.6F warmer in 1978
Drexel University: 2.2F cooler in 1978
Ephrata: 2.5F cooler in 1978
George School: 2.3F cooler in 1978
Graterford 1 E: 2.3F cooler in 1978
Holtwood: 1.8F cooler in 1978
Landisville 2 NW: 2.0F cooler in 1978
Lebanon 2 W: 2.2F cooler in 1978
Marcus Hook: 2.2F cooler in 1978
Morgantown: 1.0F cooler in 1978
Philadelphia (City): 3.8F cooler in 1978
Philadelphia (AP): 1.0F cooler in 1978
Phoenixville 1 E: 0.8F cooler in 1978
Reading 3 N: 1.6F cooler in 1978
West Chester 1 W: 1.1F cooler in 1978
This is such a big anomaly, I wonder if it's just some sort of data entry error.

-
2 minutes ago, TheClimateChanger said:
I will say the adjustments are not perfect. There was one thing that had me scratching my head. I was confused that I thought I had made a mistake and was looking at the wrong data!
1976 is shown as the fifth coldest July on record for Pennsylvania's Division 3, with a reported mean of 71.2F on Climate at a Glance. This appears to be entirely an artifact of whatever adjustments they are making.
The raw data reflects a cooler than normal July, but only by a little bit. The reported mean is 74.6F.

By comparison, 1978 was much colder with a reported mean of 72.7F, yet Climate at a Glance has it at 71.6F or 0.4F warmer than 1976!

Looking at the station composition, they add Blue Marsh Lake, Octoraro Lake, and get rid of Philadelphia 2304 Mkt [inner city] and West Grove 1 SE. So the 1978 set is more rural and not directly comparable, but what's odd is if you compare every site that it's common to both datasets 1978 is still significantly cooler across the board. Yet Climate at a Glance shows it as warmer. I highly doubt 1976 was actually the 5th coldest July on record for this climate division. I'm not really sure what's going on here, and whether it affects other districts. 1976 was the only year that had anywhere near that deviation from the mean. Wonder if it's just some sort of data error?
Here's the difference for each site. The rankings have 1978 as 0.4F warmer in this District. Idk.
Coatesville 1 SW: 0.7F cooler in 1978
Devault 1 W: 0.6F warmer in 1978
Drexel University: 2.2F cooler in 1978
Ephrata: 2.5F cooler in 1978
George School: 2.3F cooler in 1978
Graterford 1 E: 2.3F cooler in 1978
Holtwood: 1.8F cooler in 1978
Landisville 2 NW: 2.0F cooler in 1978
Lebanon 2 W: 2.2F cooler in 1978
Marcus Hook: 2.2F cooler in 1978
Morgantown: 1.0F cooler in 1978
Philadelphia (City): 3.8F cooler in 1978
Philadelphia (AP): 1.0F cooler in 1978
Phoenixville 1 E: 0.8F cooler in 1978
Reading 3 N: 1.6F cooler in 1978
West Chester 1 W: 1.1F cooler in 1978
-
I will say the adjustments are not perfect. There was one thing that had me scratching my head. I was confused that I thought I had made a mistake and was looking at the wrong data!
1976 is shown as the fifth coldest July on record for Pennsylvania's Division 3, with a reported mean of 71.2F on Climate at a Glance. This appears to be entirely an artifact of whatever adjustments they are making.
The raw data reflects a cooler than normal July, but only by a little bit. The reported mean is 74.6F.
By comparison, 1978 was much colder with a reported mean of 72.7F, yet Climate at a Glance has it at 71.6F or 0.4F warmer than 1976!
Looking at the station composition, they add Blue Marsh Lake, Octoraro Lake, and get rid of Philadelphia 2304 Mkt [inner city] and West Grove 1 SE. So the 1978 set is more rural and not directly comparable, but what's odd is if you compare every site that it's common to both datasets 1978 is still significantly cooler across the board. Yet Climate at a Glance shows it as warmer. I highly doubt 1976 was actually the 5th coldest July on record for this climate division. I'm not really sure what's going on here, and whether it affects other districts. 1976 was the only year that had anywhere near that deviation from the mean. Wonder if it's just some sort of data error?
-
9 minutes ago, TheClimateChanger said:
Is there any evidence these are actually stations used by NCEI? That seems like a lot for one county. Why would they add 16 stations in the past two decades?
Anyways, I went through the raw published figures for the month of July for Pennsylvania's Division 3 [Southeastern Piedmont] back to 1957, and the raw numbers were warming at 3.3F/century. Climate at a Glance shows 5.8F/century. This isn't evidence of any error or nefarious intent, however; the "raw" trend that I calculated is just the change in the simple arithmetic mean. I did not make any adjustments/homogenization for changes in site location, elevation and urban character. The early years were "Philadelphia heavy" so they would be inflated relative to the recent means, with up to 4 of the stations being in the city. For comparison, PHL shows a warming trend of 7.8F/century over the same time frame. Given the changing composition of the stations, I suspect the reported trend is closer to the actual trend, although I can't rule out it being slightly overstated.
-
16 hours ago, chubbs said:
Most of those stations are giving you zero climate information because they don't have long records. Only Phoenixville has data before 2007.
Is there any evidence these are actually stations used by NCEI? That seems like a lot for one county. Why would they add 16 stations in the past two decades?
-
18 minutes ago, ChescoWx said:
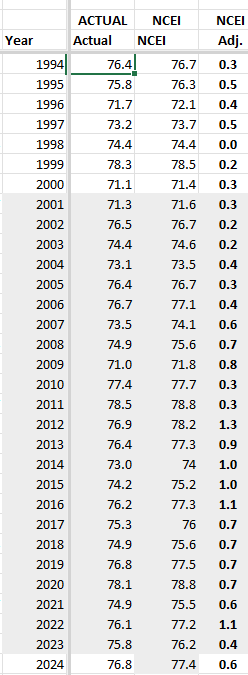
Every single July year since 1994 here in Chester County has been warmed with the NCEI alterations
What are the stations in each year?
-
Just now, TheClimateChanger said:
Well, at least for Pennsylvania's Division 9, I don't see that trend. Since 1957, 54 years show a cooling adjustment, 10 warming, and 2 years are exactly the same as published. To be honest, the warming of the 1980s appears to be an artifact of the pairwise homogenization - perhaps some sort of preferential treatment is given to first order stations. It looks like PIT had a warm bias, so the numbers were adjusted upwards a bit to fall more in line with PIT. The adjustment probably should be in the opposite direction, as the mean value is probably inflated from the apparent warm bias. Which is likely partially due to the HO-83, although the warm bias seems to predate its installation. Some of the recent Julys (2020 & 2021) have among the largest "chilling" adjustments.

I didn't look at Pennsylvania's Division 3 [Southeastern Piedmont] but I did notice the most recent Julys were showing lower on NCEI's Climate at a Glance than the published figures.
-
1 hour ago, ChescoWx said:
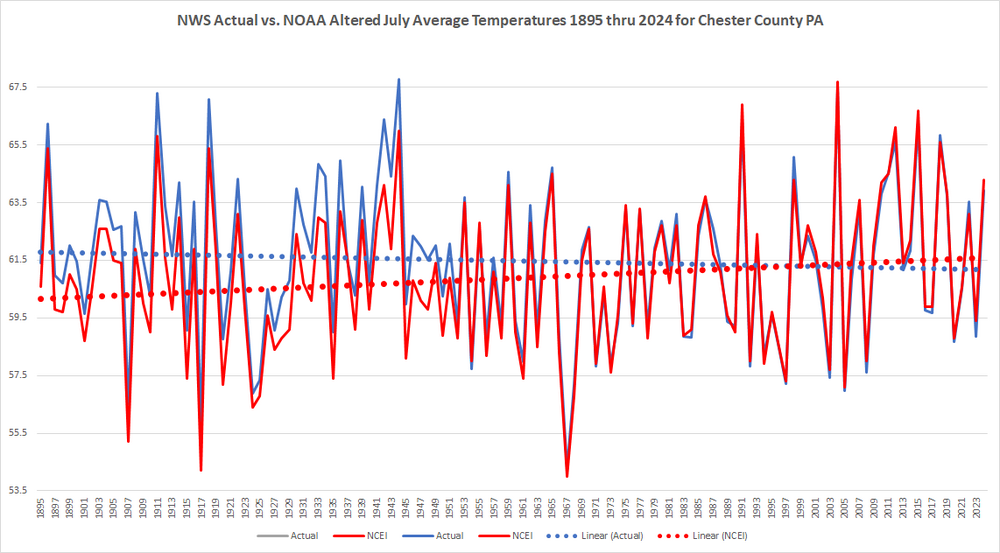
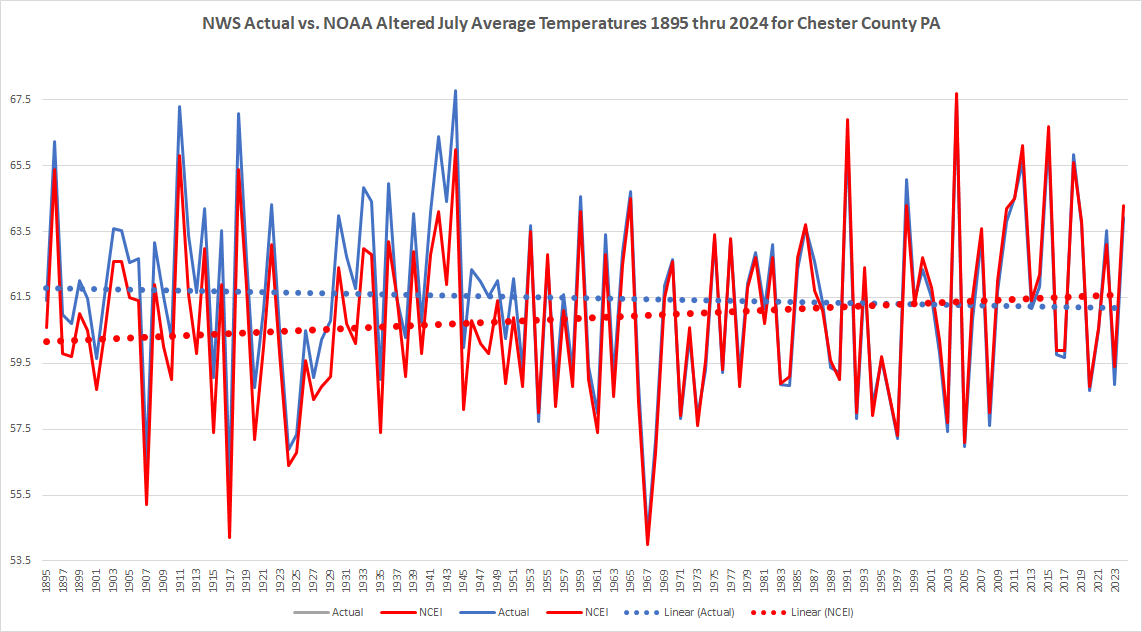
ClimateChanger not looking hard enough! Let's take a peek at July since you bring that month up!! Welp = even more egregious altered data in July. NCEI chilled a whopping 74 of the 76 years between 1895 and 1970....and of course have now turned around and warmed 46 of the last 54 years from 1971 thru 2024. And my oh my what a difference these little alterations make to the climate story of Chester County PA!! Red is the altered....look at that warming - but where the heck did it go without those wee little adjustments??? We are actually cooling in July!!!
Well, at least for Pennsylvania's Division 9, I don't see that trend. Since 1957, 54 years show a cooling adjustment, 10 warming, and 2 years are exactly the same as published. To be honest, the warming of the 1980s appears to be an artifact of a pairwise homogenization adjustment - perhaps some sort of preferential treatment is given to first order stations. It looks like PIT had a warm bias, so the numbers were adjusted upwards a bit to fall more in line with PIT. The adjustment probably should be in the opposite direction, as the mean value is probably inflated from the apparent warm bias. Which is likely partially due to the HO-83, although the warm bias seems to predate its installation. Some of the recent Julys (2020 & 2021) have among the largest "chilling" adjustments.
-
 1
1
-
-
1 hour ago, ChescoWx said:
Below shows the clear impact of the introduced altered NCEI adjustments to the below May actual average temperatures for Chester County PA. To put a fine point on the below analysis. Incredibly NCEI chose to chill 73 of the first 76 years or 96% of all May months in the years from 1895 through 1970! They have now over the last 54 years 1971 through 2024 chosen to warm the data in 40 of those 54 years or 74% of these years. This is a textbook example of how altering the data helps give the desired answer to assist the many Cyclical Climate Deniers. That blue actual average temperature line is actually cooling while the red altered data is clearly warming.....

I pulled all of the published numbers for Division 9 since 1957 for the month of July, which is when they began publishing in the current divisional format, and there is basically no difference in trend from the published numbers and the values reported on NCEI's Climate at a Glance. I don't see the big warming of recent data that you claim in these values, or in the Chester County May temperature figures you gave above. The earlier years are subject to some adjustment, most notably for Time of Observation bias, but I don't see a big nefarious warming of recent years?
Climate at a Glance - Pennsylvania's Division 9

Original Published Values in Climatological Data - Pennsylvania's Division 9

Pittsburgh International Airport

-
1
-
-
9 minutes ago, OrdIowPitMsp said:
Impressive considering we got down to 58 at MSP. The heat island capital of the Midwest.
Looks like they mostly resolved the UHI at MSP. It's been running middle of the pack at least for daytime temperatures compared to the region. Used to be 2-3F warmer than most sites.

-
1
-
-
It looks like @ChescoWx's claim is only true when you include data from personal weather stations and recently opened mesonet sites in the mix, but if you compare the actual divisional means from the reported observation sites, I'm having a hard time finding these big warming adjustments that are often claimed?
-
 1
1
-
-
5 minutes ago, TheClimateChanger said:
I have no idea what's going on with the Southwestern Plateau data. I was looking at different years and it's typically chilled, but it used to be less of a chilling. Recent years have been heavily chilled. And it makes zero sense. There are more stations now, with more high elevation sites. There is no longer a city office, which ironically is the source of historic "official" records, but it was a HUGE warm outlier - typically 2-4F warmer than lower elevation sites. And there were fewer stations being averaged then, so it would warm bias the mean. The reasonable conclusion is past temperatures ought to be chilled more than current temperatures, but recent years show the exact opposite. It looks like whatever adjustments are being made are obscuring the warming trend, and then liars are making the exact opposite claim.
Compare this to 1988. The reported value is chilled only 0.3F, versus 1.3F for 2020. And we can see the impact of faulty thermometers (HO-83) with PIT showing a huge warm bias in that era, with temperatures matched only a couple of lock & dam sites [at the lowest elevations of the region].


-
3 minutes ago, TheClimateChanger said:
One thing that's come to my attention. There's this meme that NOAA is jacking up the recent raw temperatures promoted by individuals like @ChescoWx. This appears to be a total fabrication. In fact, when I examine the raw data and compare it to the reported values, there is a significant chilling effect being introduced to observed temperatures.
For instance, here is the observed data for the Southwest Plateau division of Pennsylvania in July 2020, showing a mean of 76.3F. This would easily break the record for the month of July.

But if you look at Climate at a Glance, it's been chilled all the way down to 75.0F!

I have no idea what's going on with the Southwestern Plateau data. I was looking at different years and it's typically chilled, but it used to be less of a chilling. Recent years have been heavily chilled. And it makes zero sense. There are more stations now, with more high elevation sites. There is no longer a city office, which ironically is the source of historic "official" records, but it was a HUGE warm outlier - typically 2-4F warmer than lower elevation sites. And there were fewer stations being averaged then, so it would warm bias the mean. The reasonable conclusion is past temperatures ought to be chilled more than current temperatures, but recent years show the exact opposite. It looks like whatever adjustments are being made are obscuring the warming trend, and then liars are making the exact opposite claim.
-
Same story in @ChescoWx's neck of the woods.

Not as bad, but the observed mean of 79.3F gets artifically chilled to 78.8F.

-
One thing that's come to my attention. There's this meme that NOAA is jacking up the recent raw temperatures promoted by individuals like @ChescoWx. This appears to be a total fabrication. In fact, when I examine the raw data and compare it to the reported values, there is a significant chilling effect being introduced to observed temperatures.
For instance, here is the observed data for the Southwest Plateau division of Pennsylvania in July 2020, showing a mean of 76.3F. This would easily break the record for the month of July.
But if you look at Climate at a Glance, it's been chilled all the way down to 75.0F!
-
59 minutes ago, Brian D said:
"Camphouse Fire" it's called, as it's just on the N side of Camphouse Rd. It was 200 acres last night, maybe a bit more this morning. Very, very dry conditions. Rel Hum was like desert air yesterday around 10% or so. Temps skyrocketed because of that on stiff SW winds.
Here in town, temps steadily climbed into the mid 70's until around 10pm or so, as the S winds started shifting SW, lessening the Lake's influence. Another hot one today.
Your neck of the woods was highlighted in the National Climate Assessment as facing one of the highest increases in relative fire danger. Those marginal boreal forests are especially at risk with species like aspen and balsam fir, which are well adapted for a cooler, wetter climate. The Trump administration wants to increase logging on public lands, including a number of the forests up there. Probably not a bad thing to provide fire breaks and facilitate the transfer of new species from forests further south.
-
1
-
-
11 hours ago, TheClimateChanger said:
Stalled out after the 12:53 pm CDT observation, which is really before local solar noon during daylight saving time. Thought they would climb to at least 101 or 102, after rising 39F already by that point of the day. There were monthly record highs at several locations, including International Falls, which reached 96F, beating out the record of 95F from May 21, 1964. Minot, ND reached 99, matching the value reached on May 22, 1980 at the airport. While not a ThreadEx location, it does look like the NWS does an unofficial thread supplying records prior to 1948 from the Experimental Station where there were a couple of higher values (100 on May 23, 1928 & 105 on May 31, 1934).
Could see some monthly record high minimums tomorrow at several locations as forecast lows for tonight are close to the highest observed in the month of May, including International Falls where the forecast low of 66F would tie the monthly record high.
Low of 70F at INL this morning, which will easily surpass the monthly record high minimum of 66F set on 5/21/1992 & 5/31/1988. In fact, it's only one degree shy of the June monthly high minimum of 71F set on 6/25/2001. With that said, it is possible that it may fall below 70F by 1 am CDT / midnight CST, but it should stay above 66F. The forecast low tonight is 64F at INL.
-
22 minutes ago, TheClimateChanger said:
Stalled out after the 12:53 pm CDT observation, which is really before local solar noon during daylight saving time. Thought they would climb to at least 101 or 102, after rising 39F already by that point of the day. There were monthly record highs at several locations, including International Falls, which reached 96F, beating out the record of 95F from May 21, 1964. Minot, ND reached 99, matching the value reached on May 22, 1980 at the airport. While not a ThreadEx location, it does look like the NWS does an unofficial thread supplying records prior to 1948 from the Experimental Station where there were a couple of higher values (100 on May 23, 1928 & 105 on May 31, 1934).
Could see some monthly record high minimums tomorrow at several locations as forecast lows for tonight are close to the highest observed in the month of May, including International Falls where the forecast low of 66F would tie the monthly record high.
Even excluding today's 99F, the mean high temperature at Grand Forks was running as 8th warmest on record for the first 10 days of the month. This is an interesting set of analog years. Not sure it means much, but 1934, 1936 & 1988. Even 1980 & 1977 had some big heat. The two most recent years on the list don't follow, however - especially 2023.

-
1 hour ago, Chinook said:
Grand Forks was high 99, low 60. That breaks a high temperature record of 95, set back in 1906. Surprisingly, Grand Forks was 86 degrees on May 11th, 2023 and 85 degrees on May 11th 2024. These are nearly the maximum values since 1907.
Stalled out after the 12:53 pm CDT observation, which is really before local solar noon during daylight saving time. Thought they would climb to at least 101 or 102, after rising 39F already by that point of the day. There were monthly record highs at several locations, including International Falls, which reached 96F, beating out the record of 95F from May 21, 1964. Minot, ND reached 99, matching the value reached on May 22, 1980 at the airport. While not a ThreadEx location, it does look like the NWS does an unofficial thread supplying records prior to 1948 from the Experimental Station where there were a couple of higher values (100 on May 23, 1928 & 105 on May 31, 1934).
Could see some monthly record high minimums tomorrow at several locations as forecast lows for tonight are close to the highest observed in the month of May, including International Falls where the forecast low of 66F would tie the monthly record high.
-
Impressive heat in the upper Midwest. Up to 99F as of 1 pm at Grand Forks, North Dakota. Should have no problem clearing 100+, which would be the second earliest on record. The earliest 100+ reading occurred on April 21, 1980. There have only been 3 days in the month of May at or above 100F in recorded history at that location: 101F on 5/21/1964; 105 on 5/30/1934; and 100 on 5/30/1939. The monthly record high of 105F is probably safe, but I could see the high ending up between 102F and 104F with 2-3 hours of heating possible, so it could make a run for it.
At Grand Forks, there have been a total of 62 days at or above 100F recorded since 1893. If it gets above 102F, that would be pretty rarified air for any time of the year. There have only been 20 days above 102F, of which 8 occurred during the summer of 1936, which was particularly harsh in that region.
-
-
A touch of frost on my roof earlier, but that was it. Low of 36 on my weather station. Otherwise, looks like a beautiful weekend for a change. Trey from KDKA did note a little wildfire smoke might make things a touch hazier tomorrow morning, but doesn’t look like it should be too thick by the time it reaches our latitude.


Occasional Thoughts on Climate Change
in Climate Change
Posted
He also never posts the record lows which would invariably show a much greater bias towards early year than record highs, especially using his convention of ignoring subsequent ties.