

TheClimateChanger
-
Posts
1,817 -
Joined
-
Last visited
Content Type
Profiles
Blogs
Forums
American Weather
Media Demo
Store
Gallery
Posts posted by TheClimateChanger
-
-
Mean temperature of 73.5F today (high of 83F, low of 64F). You’d think it would be a record, but it fell one short of the 74.5F observed on this date in 1990.
-
2 hours ago, Itstrainingtime said:
MU - 80
LNS - 78
THV - 78
MDT - 71!!!
You know we’ll still have people complaining it’s too warm even when it’s one of the coldest spots in the entire metro area.

-
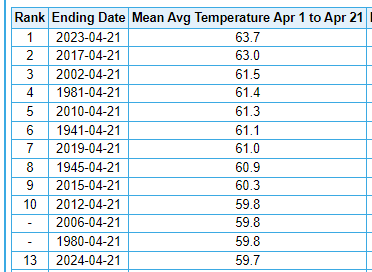
If the forecast for the rest of the month is correct, we will finish with a mean temperature for the month of about 56.2F, which would be good for 7th warmest of record. Since 1955, only 2017 (57.3F) saw a warmer April. Also still a good chance at the #1 wettest April on record.
-
10 minutes ago, michsnowfreak said:
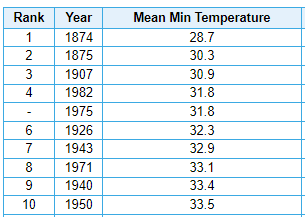
What does showing the coldest Aprils on record (1874 over 10F colder than avg) have to do with noting the unusual nature of this mornings cold? The record low was missed by 2F and again, as pointed out, the dewpoints were unusually low. Im well aware of the planting guidelines (they say Mothers Day, not Memorial Day) but theres little you can do with trees established in the ground.
This marks the 5th consecutive year that the last freeze was later than avg
2024 (Apr 25)
2023 (Apr 26)
2022 (Apr 29)
2021 (May 1)
2022 (May 13) *only May 10, 1966 saw a colder temp so late in the season than the 27F on May 9, 2020).
Actually has a lot to do with it. I was pointing out that there have been entire Aprils where the mean minimum temperature was near or below freezing in Detroit. April 1874, of course, was particularly noteworthy, as it was case where the average low for the entire month was only a fraction of a degree warmer than the minimum this morning. An occasional freezing morning is to be expected more often than not.
-
1 hour ago, michsnowfreak said:
I covered my apple trees. Not an easy feat lol. If it happens next spring I may just run the sprinkler.
DTW got down to 28F, missing the record low (26- 1892) by 2F. White Lake got to 23F. What was unusual about this is that most late spring frosts/freezes have dews near the temp, but we saw temps in the 28-29F range while dews were 20-22F. Very unusual, albeit brief, for late April.
Nothing too unusual for southeast lower Michigan. In 1874, the average low for the entire month at Detroit was 28.7F. And there have been 5 years in which the average low for the month of April was below freezing. That's why they say hold off on planting until Memorial Day.
-
 2
2
-
-
33 minutes ago, bluewave said:
The main challenge for the area is that the last freeze date is similar to 1951-1980 but first 70s and 80s of spring are arriving much earlier. So this has lead to the damaging spring freezes across the northeast especially in the interior. The historic damaging freeze last May to our north matched the pattern of early season warmth causing blooms which were followed by a damaging hard freeze. We can understand that as the climate continues to warm spring will arrive earlier with the quicker blooms. But the last freeze date has not changed as much and needs some further investigation. My guess is that the much stronger spring blocking from the EPO to NAO regions recently is allowing the last freeze date to remain more constant relative to earlier eras.
I will use Newark as an example of this pattern that shows up to varying degrees across the region.
Newark
2010-2023
Last 32°…. 04-04…last 30s…04-21
First 70°…..03-07…first 80°….03-31
1951-1980
Last 32°…..04-04…..last 30s…04-22
First 70°.….03-26….first 80°…..04-22
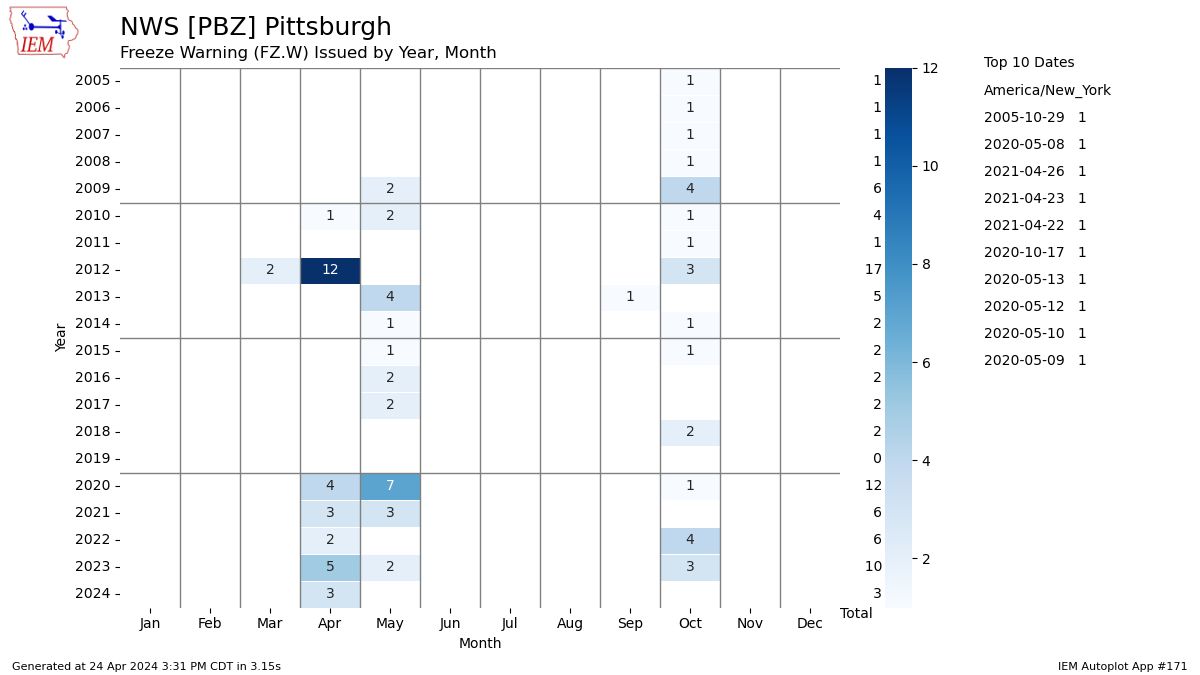
I think the increase in frosts/freeze is just one of perception. If you look at NWS Pittsburgh, for an example, you can see freeze warnings used to be very rare in the spring prior to 2012. And it wasn't because it was warmer at that time. To the contrary, it was because they were not issued until May 1 in the south and May 15 in the mountains and north, because that's when the growing season used to begin. Now the growing season begins in April (or even March, as in 2012) and voila! --- Suddenly there's numerous freeze warnings each and every spring.
It is true that 2020 had a lot of freeze warnings in May, but a good chunk of those were relegated to the mountains and north country and would not have been issued pre-2012.
If you look at the actual data, you will see in the 19th century and early 20th century, it was common for low temperatures for the ENTIRE month of April to average below freezing in many of these areas, which means the majority of nights dropped below freezing in those months. Now in the same areas, there's a big hullabaloo with the rogue night dropping to 30F in mid to late April.
-
 1
1
-
-
18 minutes ago, bluewave said:
The main challenge for the area is that the last freeze date is similar to 1951-1980 but first 70s and 80s of spring are arriving much earlier. So this has lead to the damaging spring freezes across the northeast especially in the interior. The historic damaging freeze last May to our north matched the pattern of early season warmth causing blooms which were followed by a damaging hard freeze. We can understand that as the climate continues to warm spring will arrive earlier with the quicker blooms. But the last freeze date has not changed as much and needs some further investigation. My guess is that the much stronger spring blocking from the EPO to NAO regions recently is allowing the last freeze date to remain more constant relative to earlier eras.
I will use Newark as an example of this pattern that shows up to varying degrees across the region.
Newark
2010-2023
Last 32°…. 04-04…last 30s…04-21
First 70°…..03-07…first 80°….03-31
1951-1980
Last 32°…..04-04…..last 30s…04-22
First 70°.….03-26….first 80°…..04-22
Lows have warmed dramatically at New York. No doubt freezes used to be much more common in the past.
In the past, it was much colder. As low as 12 degrees in April 1923.
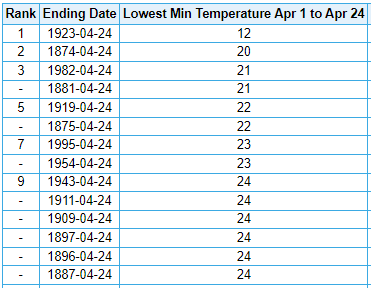
Many years had average minima less than the coldest minimum temperature readings in recent years.
-
6 minutes ago, LibertyBell said:
This is why the whole illusion of average is just an illusion.
Another example is the extreme increase in rainfall and earlier last freezes since 2000.
I grew up in the 80s and 90s and I distinctly remember our last freeze was around April 10th and we used to average around 40 inches of rain a year. But now our last "average" freeze is considered to be March 30th and our "average" rainfall is now 50 inches of rain a year? How is this even allowed to happen? We really should end climate norms with 2000 and anything that occurred since then should be compared to what happened before.
We are living in the climate statistics equivalent of baseball's steroid era. Like 40 home runs used to be a pretty big deal, then you suddenly enter an era where someone like Brady Anderson goes from averaging 20-25 homers to knocking 50 out of the park. And three different players are routinely hitting 60-70 a season.
-
1
-
-
30 minutes ago, LibertyBell said:
blame 30 year normals for that
they should use the entire climate history of a region to make those calculations
I would probably compare only to years before 2000 and toss all the recent years. So many months now don't even crack the top 10 warmest, that would have been like 4th or 5th warmest on record just 20 years ago. That means the same months that would have been highlighted on the NWS website as being incredibly warm just a couple decades ago now don't even get a second glance and, in fact, people think those months are relatively mild because they compare it to the fact that, for instance, 5 of the most recent 12 years have been warmer. And it's those recent 12 years that people remember and base their expectations on.
This happens all the time now. So many months look like no big deals, when they would have been considered very warm just a couple decades ago.
-
2
-
-
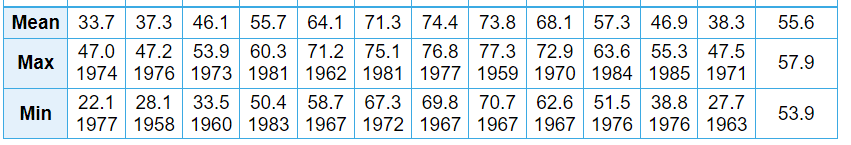
So, to me, this data would suggest that a place like Cleveland or Toledo has a climate like that of mid- to late 20th century northern and central Kentucky, over the past 10 years. Suburban Pittsburgh looks on par with suburban Washington, D.C. or Charleston, WV, while the city itself is more on par with southwest Virginia or far northeast Tennesee [lower elevation locales, not looking at mountain climates].
In light of the ongoing trend (even an apparent acceleration), I would anticipate Cleveland/Toledo will look like southern Kentucky by 2040, and suburban Pittsburgh will look like northeast Tennessee, while the city itself has a climate more on par with 20th century middle North Carolina.
-
Pittsburgh (May 2015 - April 2024)
KPIT:
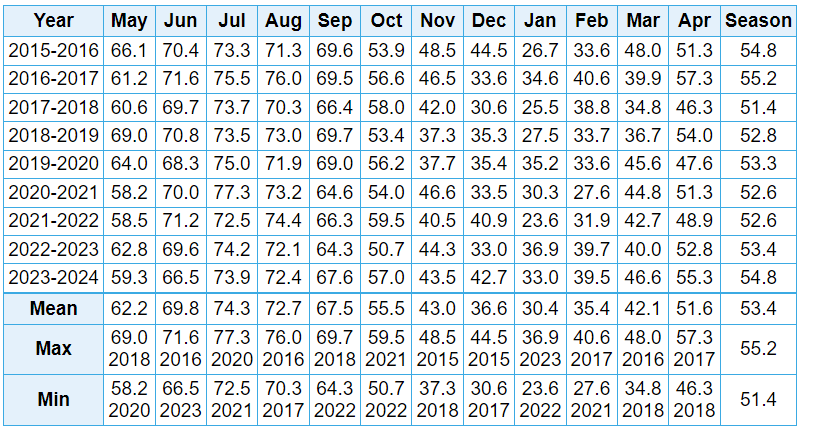
KAGC:
What's interesting is the city station used to run 2.6F warmer than KPIT and about 2.0F warmer than AGC owing to the much lower elevation and heat island effect, which, in either case, would imply the downtown city temperature over this interval is now around 56.0F.
Sterling, VA (suburban Washington metro) [1962-1985]
Roanoke, VA (1956-1985)
Tri-Cities, TN (1956-1985)
-
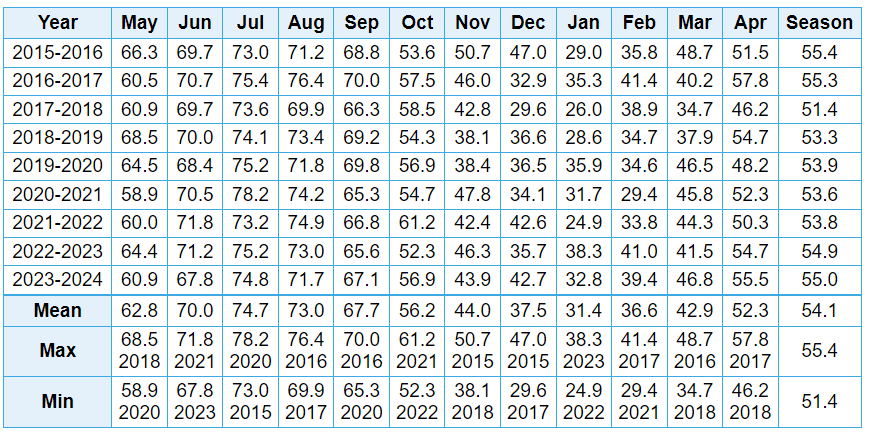
Cleveland (May 2015 - April 2024)
KCLE:
KBKL [Burke Lakefront Airport]:
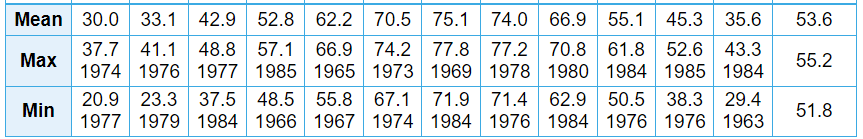
Covington, KY (1956-1985)
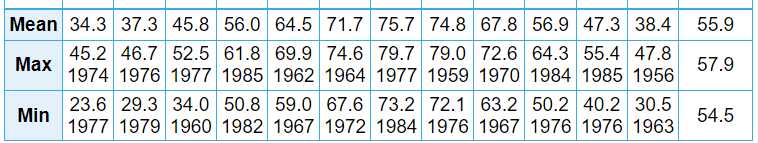
Lexington, KY (1956-1985)
-
This might be an unusual post, but does it seem like there is a perception problem when it comes to climate? Like people just accept the change, and then suddenly use that as the benchmark for what's a normal climate for a region.
Like I feel that people think of Cleveland as this cold and snowy place, but the actual data would show over the last 10 years that the mean monthly and annual temperatures are on par with late 20th century northern/central Kentucky. Or Pittsburgh, where the mean annual and monthly temperature closely matches that of suburban Washington, D.C. metro or southern West Virginia, but inside the city, probably more on par with the lower elevations of eastern Tennessee or northwest Virginia.
-
 1
1
-
-
10 hours ago, Gobucks15 said:
One of the more volatile April’s I can remember here in Toledo. It’s been steadily in the 50s since Saturday, we’re going to have a hard freeze tomorrow night, and be around 80° all weekend with lows in the 60’s. Just bonkers
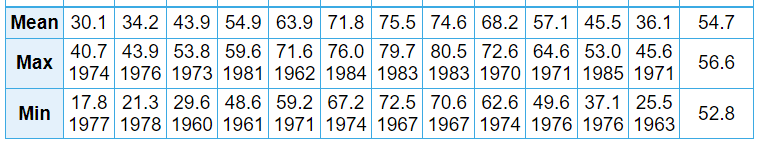
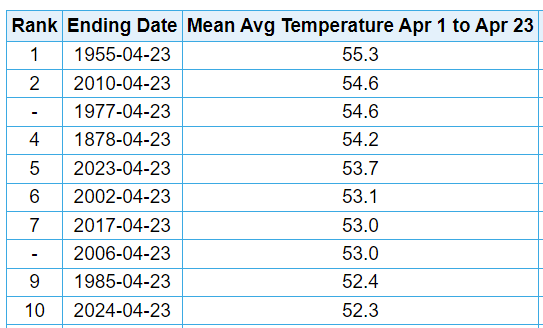
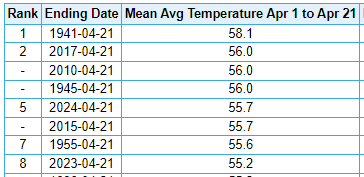
10th warmest mean temperature over the first 23 days. Prior to 2006, only 4 years were warmer (1955, 1977, 1878, and 1985), and the last one by only a tenth of a degree.
-
43 minutes ago, LibertyBell said:
It's close enough-- I have very little patience for primitive people who think pollution isn't a huge problem.
https://www.theguardian.com/us-news/2020/feb/12/reserve-louisiana-cancer-epa-monitoring
Residents of Cancer Town urge tougher measures to monitor toxins
This article is more than 4 years oldThe town at the center of a Guardian series, where the cancer risk is 50 times the national average, is critical of a planned monitoring system
Reserve, Louisiana — In a Louisiana town of 10,000 people, the Environmental Protection Agency (EPA) said there is some of the most toxic air in America. More than 100 petrochemical plants and refineries dot the corridor between New Orleans and Baton Rouge, often referred to as "cancer alley."
The town of Reserve is right in the middle of it, and the cancer risk there is almost 50 times the national average, according to the EPA.
Robert Taylor has lived there most of his 78 years. Even his family cemetery is surrounded by a refinery. He said his mom, sister, uncle and nephew all died of cancer.
"As I stand here, it's overwhelming to me. All of my folks are here. I will eventually wind up here," he said.
For decades, people in Reserve have had health problems ranging from dizziness and severe headaches to liver and lung cancer. Many believe a plant, hundreds of yards from some of their homes, is the source.The Denka Performance Elastomer plant, owned by DuPont until 2015, makes chloroprene, a chemical the EPA calls a "likely human carcinogen." Denka is the only plant in the country producing it.
I know all about pollution. You're figure is exaggerated. You implied there is an 86x increase in cancer risk over a large area ["Cancer Alley" covers 85 miles of riverfront]. The highest risk you've actually shown is this one which finds a 50x risk - not even in one town, but in a sparsely populated area within a mile of the DuPont plant. And 86x is not close to 50x, it's nearly double. None of the EPA studies find anywhere near that high of an incidence. Air pollution from chemical plants is horrible enough, there's no reason to exaggerate. I don't understand why you're mad at me. All I did was a request a citation for the figure you quote.
-
1 hour ago, LibertyBell said:
It's actually much more complicated than that.
Most of the pollution of fossil fuels and their health impacts are borne by minority communities.
But people are finally waking up to this and activists scored major victories that have banned new petrochemical facilities being created in Cancer Alley in Louisiana where cancer rates are 86x higher because of pollution from fossil fuels. The civil rights movement and the environmental movement have united to fight the same enemies-- even this Earth Day is labeled Plastics vs The Planet, as the fossil fuel cartels have shifted to plastics as their main source of revenue since renewables are replacing them for energy.
The question then becomes where do you want these toxic petrochemical factories to be built? In your town? Luckily you won't have to make that hard decision because there's a global plastics treaty being organized right now to finally eliminate plastics once and for all and shut down this toxic revenue stream of the corrupt fossil fuel cartels.
Let's not pretend there was no air pollution before the Industrial Revolution. All the wood burning for heat, foundries, tanneries, etc. would have certainly lead to extensive smog in the cities. Not to mention, there was no garbage collection or sewage, so human waste was just strewn throughout the cities.
Also, I'm going to need a source on this 86x cancer risk. That doesn't sound credible to me, and I can't find any source that claims anywhere near that figure.
-
1
-
-
On 4/16/2024 at 7:23 AM, Weather Will said:
WB 0Z EPS shows drier but still averaging on the cool side for the last half of April.

Interesting. So on March 31, it's wet and cool. On April 16, still cool but drier. Meanwhile, it's been a very warm April. This forum is hilarious.
5th warmest [of 64 years] at IAD.
13th warmest [of 153 years] at DCA.
While only beaten out by 12 years since records began in 1871, the DCA ranking is misleading as heck as well. Prior to 2006, there are only four warmer Aprils to date (1941, 1945, 1980, and 1981). And one of those four (1980) is a negligible 0.1F warmer. This would have been considered an exceptionally warm April in the 1990s or early 2000s when I started observing the weather. That's only 20-ish years ago.
In one generation, what would have been considered a near record warm start to April is now considered "cool." How did we let this become normalized?
-
1
-
-
On 4/1/2024 at 4:58 PM, WEATHER53 said:
Our cold month is here
-5 upcoming
April Fools?
-
1
-
-
14 hours ago, Gobucks15 said:
It’s really what benefits us the in the Central Great Lakes. Part of why the wine is so good around Lake Erie, really moderates these hard freezes on the IslandsPartially true. But the main reason historically for the fruit growing belt is actually the opposite. The proximity to the Great Lakes keeps it colder in the early/mid spring depressing vegetation development until after the threat of frost and freeze was largely over. And then of course if there were late season frosts and freeze, providing enough moderation to minimize the threat.
-
 1
1
-
-
4 hours ago, mahantango#1 said:
Its seems to me it's every spring. Bot last year it was devastating 10 miles as the crow flies from me. This is from May last year. But the strawberries are blooming now in April this year. This is not good!
May,31, 2023 ·It is with great sadness that we announce there will be no strawberries for 2023. The frost and freeze conditions on numerous mornings in May have ruined the blossoms and small fruit.If frost in April kills off the crop, it might be time to give up and move on to something else. Maybe it's just no longer a suitable climate for growing strawberries.
-
Brutal. Fell all the way from 2nd to 5th place on the MTD warmest list, with yesterday's cooldown. I fear we're going to fall pretty dramatically over the next few days.

Look at all these recent years in the top 8 though! And people will still make up nonsense about how spring is always cool.

-
12 hours ago, LibertyBell said:
Why is it our local broadcasters almost uniformly underforecast the temperatures, Don? I even heard them say "no 70s for the next 7 days" and they busted badly on the first day of that forecast!
Have to tack on 3-5 degrees on sunny to partly sunny days in early spring to account for lack of vegetation IMO.
-
2
-
-
46 minutes ago, TimB said:
Not sure I’m buying the temperature observations at PIT this morning. Jumped from 59 to 67 between the 7 and 8 am hourly observations. Everywhere else seemed to stay steady.
Looks like the nearby personal weather stations had a similar jump at that time. Possible heat burst from collapsing showers? This one Imperial went up above 65F and since cratered below 59F.

-


April 2024 General Discussion
in Lakes/Ohio Valley
Posted
Absolute scorcher out there today.
At Cleveland, the low of 68F and the mean of 74.5F both set daily record highs. The low was just two degrees shy of the monthly high minimum reading of 70F, set on April 25, 2009.
At Detroit, the low of 63F was one shy of the daily record high set way back in 1899. The mean of 71.5F also fell just shy of the record of 72.0F, also set in 1899.
At Mansfield, Ohio, the low of 65F was just two shy of the daily record high of 67F set in 1974, which is also the monthly record high. The mean temperature of 73F was just 0.5F below the daily record high of 73.5F, set in 1974, and just 2.5F below the all-time monthly record high of 75.5F set on April 24, 1925.
At Youngstown, Ohio, the low of 66F set a new daily record high and tied the monthly record high minimum reading, set on April 17, 2002 & April 25, 2009. The mean temperature of 73.5F was just 0.5F shy of the daily record set in 1990, and just 2.5F below the all-time record high mean of 76F set on April 25, 2009.
Tl;dr: About as hot as it gets in late April, and some of these locations will likely be even warmer tomorrow!