

TheClimateChanger
-
Posts
4,380 -
Joined
-
Last visited
Content Type
Profiles
Blogs
Forums
American Weather
Media Demo
Store
Gallery
Everything posted by TheClimateChanger
-
Occasional Thoughts on Climate Change
TheClimateChanger replied to donsutherland1's topic in Climate Change
Here is the average of all available data in Ohio for July 1895: The reported value for that month is 71.1F, just 0.1F different than a simple average of the data. This is not the case for states with more significant elevation changes. Generally, the early data is devoid or limited of high elevation stations, so the simple average is often much higher than the gridded average. But most of the data for the Midwest matches pretty close to the reported data - like I said there are some adjustments made to later decades, but these are reasonable (change in TOBs and instruments). Ideally, we would have just maintained the 5 pm / 6 pm observations and CRS readings, and then there would be no need for any adjustments. But unfortunately, we don't live in the universe where those changes weren't made. I think it is reasonable to consider whether maybe to reinstate them at certain or all sites? -
Occasional Thoughts on Climate Change
TheClimateChanger replied to donsutherland1's topic in Climate Change
Meh, most of what's called adjustments is actually just areal averaging/gridding of the data. With states like Ohio or Illinois, where there aren't huge variations in elevation, and the stations have been pretty well separated throughout history, there's little discrepancy in the pre-1920 data versus what NCEI reports. There's a small decrease to account for observation time, and adjustment for instrument bias, from about the 1920s gradually decreasing in the 1960s to 1970s. Recent decades are generally slightly less. Why - I'm not sure, I guess a small negative UHI adjustment. Obviously, looking at individual sites, there can be significantly larger inhomogeneities - especially with some of them that have been shuttered and/or threaded with a bunch of disparate locations, elevations and site exposures. -
Occasional Thoughts on Climate Change
TheClimateChanger replied to donsutherland1's topic in Climate Change
There was no Cincinnati WSO until nearly 2000 - much of that appears to be made up "ghosted" data as you have referred to it in the past. For the period where there actually is data [i.e., up until the 1960s & 1970s], the adjusted & homogenized final product appears to decrease the trend. Moreover, this is a rooftop urban station. In recent years, temperatures at the airport - several hundred feet higher in elevation, with an aspirated temperature sensor, sited over grass - have exceeded even those lofty early years. Here's what the site looked like in 1947 (see illustration below). I would 100% favor bringing back these stations today and actually reporting the observed temperatures. Guarantee they would be far warmer than whatever is shown on there. -
Occasional Thoughts on Climate Change
TheClimateChanger replied to donsutherland1's topic in Climate Change
It looks like they did adjust the trend down. Rather than chill recent years, early years appear to be adjusted upwards, no? Pretty substantially in the 1960s and 70s, in fact. What am I missing here? The unadjusted data pretty clearly shows a steeper warming trend than the adjusted data. -
Occasional Thoughts on Climate Change
TheClimateChanger replied to donsutherland1's topic in Climate Change
Lol. There was no "Greater Pittsburgh Air Force Base" with data back to 1880. What a clown. This appears to be a mix & match of different stations threaded together. In fact, it looks to be the official station thread. Funny it cuts off in 2020. Even the airport [400+ feet higher in elevation] beat any year in history by 1F just last year. -
Occasional Thoughts on Climate Change
TheClimateChanger replied to donsutherland1's topic in Climate Change
As an aside, I find it hilariously hypocritical that @ChescoWx's signature complains about the use of the word "denier." He bandies that term around more than anyone here... calling people natural climate change deniers and cyclical climate change deniers. -
Looks like there's a cooler Avondale site in the mix as well. It's also misleading to call Spring City site unusually warm. It looks to be the coolest NOAA site since 2000, at least in the month of July based on my analysis. Despite its closeness to Phoenixville, it is substantially cooler than Phoenixville. Indeed, it is even cooler than Avondale, which was cooler by 1+ degree during the overlap with the old Coatesville and West Chester sites. Like I said, it looks like the current station mix is the coldest since 2000, so you would think recent years would be adjusted upwards from the calculated average observed July mean, but it is actually a little lower than the mean of Avondale, Phoenixville, and Spring City [at least based on what you presented as NCEI's figure for the 2020s]. Remember when you add a huge slew of new stations that aren't included in the NOAA analysis, that's essentially the same as saying those locations were equal to the county mean for all prior years in which those sites did not exist. If those stations are instead below the mean of the existing NOAA sites, then that is not a valid form of averaging.
-
Occasional Thoughts on Climate Change
TheClimateChanger replied to donsutherland1's topic in Climate Change
Interesting. @donsutherland1, do you find any evidence of a cyclical warming in the Phoenix data? Were the 1930s even hotter there, as seems to be insinuated here? -
Occasional Thoughts on Climate Change
TheClimateChanger replied to donsutherland1's topic in Climate Change
Don, I would also question the replicability of Shewchuk's graph, especially in recent years. I see no evidence of recent years being adjusted upwards, so that weird pause since 1998 makes zero sense. There have been plenty of recent years that have far exceeded 1998 (2012, 2023, 2024, etc.). It is worth pointing out that the redundant, higher quality CRN network was established in 2005 and shows slightly more warming than nClimDiv during the period of overlap. There is no evidence to suggest that recent data is being adjusted upwards. Looking at the rest of the graph, the magnitude of adjustments for TOBs and instrument changes looks to be of a reasonable magnitude. I know sometimes these graphics are manipulated by not factoring in gridding / proper areal averaging, which isn't an adjustment within the meaning of that term. Another common misrepresentation is to show only maximum temperature data. The MMTS bias adjustment is to lower older daytime maxima; however, the bias adjustment raises older minima. The net affect of these offsetting adjustments is negligable to Tavg trend. Here, it looks like Shewchuk uses Tavg, so I will say it doesn't appear to be as misleading as some of the stuff I have seen Heller and Martz publish. He does cutoff the analysis at 1925, because prior to that date [back to 1895], adjustments are minimal and I think it would ruin the presentation he wants to give that the warming results only from adjustments. Also, as I said previously, the recent data definitely looks off. Doesn't seem to jive with actual observations. Without that weird sudden dropoff post-1998 in the so-called "raw" data, the trends since 1960 would be quite similar in both the so-called "raw" and "altered" data. -
Taking a look at the actual data, I was largely able to replicate NOAA's rankings/values from the raw data back to at least 2000. I limited this to 25 years, because it would be a big undertaking to expand significantly beyond that and you run into more data discontinuities as you head back in time. In the "Occasional Thoughts on CC" thread, user @ChescoWx claims an actual summertime mean of 72.8F for the 2000s, 73.2F for the 2010s, and 73.5F for the 2020s, which it is claimed that NOAA alters to 73.1F, 73.9F, and 74.1F. Limiting the analysis to actual NOAA stations, I calculate a summertime mean of 73.1F, 73.9F, and 74.4F for the three decades, the first two exactly matching the reported and the current decade actually slightly warmer than reported. It appears those values are calculated only by adding in stations that aren't included in the NOAA analysis - mesonets, secondary airports (AWOS sites?), perhaps personal weather stations. I'm not sure what's going on. In my analysis, I have data for Phoenixville 1E for 2000-2024, West Chester 2 NW for 2000-2016, Coatesville 2 W for 2000-2007, Avondale 2 N for 2006-2024, and Spring City 2 WSW for 2023-2024. Looking at this basket of stations, Phoenixville 1 E looks to be the warmest, followed by West Chester 2 NW, then Coatesville 2 W, then Avondale 2 N, and Spring City 2 WSW. So it looks like the station mix has gotten cooler with time with the Coatesville and West Chester sites gradually swapped out for the cooler Avondale and Spring City sites, so I would expect homogenization to increase the recent temperatures and/or decrease the older temperatures, but the opposite is true, with the older temperatures equal to the true mean and recent temperatures slightly chilled from the true mean. If anything, it looks like the NOAA trend for Chester County is slightly low for the most recent 25 summers?
-
2025-2026 ENSO
TheClimateChanger replied to 40/70 Benchmark's topic in Weather Forecasting and Discussion
Yeah, some areas will definitely stand to benefit from these changes. Others might not fare as well, with sea level rises and such. -
Occasional Thoughts on Climate Change
TheClimateChanger replied to donsutherland1's topic in Climate Change
July is warming by as much as 5 or 6 degrees per century, which is substantially less. However, the latitudinal variance is considerably less, so that's possibly an even bigger shift in terms of latitude. Will everyone east of the Mississippi have a South Carolina low country climate by 2100? Will the Southeast turn into a blazing inferno of deadly wet bulb events? -
Occasional Thoughts on Climate Change
TheClimateChanger replied to donsutherland1's topic in Climate Change
Man, I've been tracking global warming for decades and some things still just stop me in my tracks. January is warming at 11F/century in parts of the eastern US over the past 5 1/2 decades. This is a steady long-term trend that is older than me! Just unbelievable. I mean simply extrapolating this trend, suggests that Januarys by the early 22nd century will be warmer than recent Marches. This is just extrapolation of the long-term trend. With acceleration, will we see this increase to 15 or 20F per century? -
2025-2026 ENSO
TheClimateChanger replied to 40/70 Benchmark's topic in Weather Forecasting and Discussion
If the current long-term trend were to continue, we would be seeing mean January temperatures of about 39.5F in northeast Ohio and about 44F in coastal New York. Those are warmer than March averages today. Again, that is only extrapolating the ongoing trend. The reality is that the trend is actually accelerating as @bluewavepointed out. Not out of the question, we see warming as high 15-20F per century in the coming decades. Just unbelievable. -
2025-2026 ENSO
TheClimateChanger replied to 40/70 Benchmark's topic in Weather Forecasting and Discussion
Just a sobering trend. Over the last six decades, January is warming up to 10 or 11F per century in many areas. Northeast Ohio - 11F/century Coastal New York, including NYC Metro - 10F/century! -
Occasional Thoughts on Climate Change
TheClimateChanger replied to donsutherland1's topic in Climate Change
Yes, 2021's record heat was driven by extreme anomalies out west, although it was fairly warm across most of the country. Much of the interior northwest was more than 6F above the 1991-2020 average. -
Occasional Thoughts on Climate Change
TheClimateChanger replied to donsutherland1's topic in Climate Change
Will be interesting to see where June 2025 places. Looks like we won't beat 2021 but good chance to finish in the top 5. It should be noted that 2021 is the warmest by a long shot, as you can see on the temperature plot below. Last year finished in second place. Below is an article from the Washington Post on the heat in June, with a map showing temperature anomalies. Per the article, above is +1 to +3, and well above +3 or better. If this is line with NCEI's final numbers, the CONUS temperature would certainly place in the Top 10 warmest. Like I said 2021 looks hotter on my glance at the data, but probably not too far from last year's final tally. I compared the map below to 2022 [11th hottest June] and this map is clearly warmer than that month. In 2022, the only widespread area of +3F or greater anomalies was in Texas and scattered locations along the Gulf Coast and in the Southwest. This year saw widespread 3F or greater anomalies throughout the interior west, the Upper Ohio Valley, parts of the Great Lakes and Mid-Atlantic. June was hotter than usual, and humid. See where your area ranks. - The Washington Post Here's what 2022 [11th place] looks like on NCEI divisional maps, with the same anomaly convention [+1, +3, -1, -3]: -
While we haven't seen much smoke in a few weeks, with a return to more of a northwesterly flow pattern, some smoke and haze aloft is evident on visible satellite imagery this morning across southern parts of Canada, the Upper Peninsula of Michigan and northern lower Michigan. Shouldn't be a huge deal but the HRRR-Smoke does show some elevated levels of near surface smoke for northeast North Dakota and far northern Minnesota later today.
-
This was also the case at MGW, based on data since 1949 [no data 1955-1972]. Obviously, some bad/missing data for 1979 as well. Top 3: 2025, 64.468F 1981: 64.238F 2018: 63.248F
-
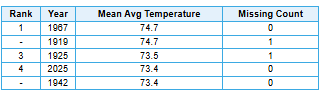
Additionally, the average hourly dewpoint was highest on record for the month of June (since 1945). While the heading indicates Pittsburgh International (PIT), the years prior to 1953 are from hourly observations taken at present-day Allegheny County Airport, as Pittsburgh International Airport did not exist until 1952 [when it was known as the Greater Pittsburgh Airport]. The average hourly dewpoint for the month of June is 57.7F, so last month was nearly 6F higher than the long-term mean. Top 3, per the .csv file: 2025, 63.548F 1949, 63.546F 2005, 63.166F
-
July 2025 Discussion-OBS - seasonable summer variability
TheClimateChanger replied to wdrag's topic in New York City Metro
Is there any way someone could get a large mirror, maybe using a drone, to reflect sunlight onto the Central Park ASOS? -
It's also the half-way point for 2025. Through the first 6 months, PIT is running 3.8F cooler than last year's record-breaking pace. Still well above the long-term mean, checking in at 33th place in the threaded record (9th at the airport, tied with 1953 - the first full year of records at PIT). Similar story at Morgantown. The mean temperature of 50.5F ties for 22nd warmest and is 3.4F cooler than last year's record-pace. This list includes only years with less than 30 missing days. Wheeling is currently tied for 11th warmest with 2016, despite a 3.3F dropoff from last year. This ranking is obviously aided by the lengthy gap in the records, as years like 1990, 1991 and 1998 would certainly be in the mix otherwise (perhaps some from the late 80s as well). Also, no temperature records prior to 1900.
-
Overall, it was a wet June regionwide, most notably at Morgantown (see below). The 8.65" of rainfall there was good for 4th place overall, with records dating all the way back to 1872 [albeit with some gaps]! 1939 must have been insanely wet. Most other climate sites generally finished between about 12th and 25th place in the ranking of wettest Junes. I suspect some areas outside of the official observations, especially in far southwest Pennsylvania and portions of West Virginia, saw 10" or more of rainfall this month.
-
Revisiting June, finished at 73.1F at PIT, which, as noted, was the warmest since observations have been taken at the airport, and tied for 11th warmest overall. Elsewhere across the region, it tied for 4th warmest in the Morgantown area threaded record. It should be noted there is no data for 1943, which appears to have been a very warm month. 1934, which holds the top spot in both the Pittsburgh and Wheeling station threads, is tied for 15th place with 1949 & 2014 (72.6F) in the Morgantown threaded record. Dubois, with a shorter POR, finished tied for 4th warmest with 1976. A little skeptical of the ranking for 1976, seeing as that is said to have been the coldest summer on record at PIT, but that's what the official data shows. The record of 69.2F was set just last year. Wheeling finished tied with last year for 7th warmest June. There's a pretty big gap in the records here between 1953 and 1998; however, there really only appear to be a few candidate Junes for inclusion on this list in that time frame (1967, 1994, perhaps 1991). Another 0.1F would have raised this year to 4th warmest, as there is currently a 3-way tie for 4th place (1952, 1949, 1921) at 72.9F. New Philadelphia, Ohio, another short POR site, finished as 2nd warmest behind 2016. Yes, those 2016 readings were coming in quite high there relative to most places.

-
That's why I was hesitant to point it out. Always a chance for an all-day cloud and rain event. Even a couple of hours of sun would have easily sent the temperature up to 80F with mid-morning readings in the mid 70s. But probably too little, too late today.


