ORH_wxman
-
Posts
93,098 -
Joined
-
Last visited
Content Type
Profiles
Blogs
Forums
American Weather
Media Demo
Store
Gallery
Everything posted by ORH_wxman
-
It's exactly 250% if we use 44" as the baseline (though the '91-'20 mean might be closer to 46")
-
That might be true....though I’m skeptical of the claim on the easterlies since they were pretty dormant until summer after our weak El Niño broke in the spring. Maybe there’s some mild enhancement? But I don’t think it is anything like a primary driver. As for the impact...muted or not muted, they are still going to be larger on a moderate or strong la Niña vs a weak one...so it’s worth pointing out the strengthening event. We aren’t currently in a deep -PDO either like the 2007-2012 years so that will probably have at least some impact as well. To what extent? Anyone else’s guess is probably better than mine. Its hard to quantify the sensible impacts. We’ve had La Ninas that acted like El Niño’s before....ala 1995-1996. Hell, that season even had some bouts of STJ. And then we’ve had El Niños that acted like La Niña too...see 1968-1969. Who knows if the deeper phase PDO had an effect or not...I’m sure it wasn’t the only reason but you wonder since each respective season had an “out of phase” PDO look. My biggest personal question is how far poleward does the Aleutian ridge get? La Niña almost always has an Aleutian ridge and how far poleward it gets can be a large factor.
-
A lot of it will depend on the AO/NAO I think....esp the further south you go. Recall that 2010-2011 was a strong La Nina that peaked at -1.7C trimonthly. That is probably the gold standard for winters down in your 'hood over the past 2+ decades....so it can be good if it gets help. A potent La Nina can have a very active PJ, so if you get a little bit of blocking, it can produce a ton of miller Bs and other fun systems that go south of SNE. Obviously we want to avoid an AK pig too...if we don't avoid that, then it's game over for all of us.
-
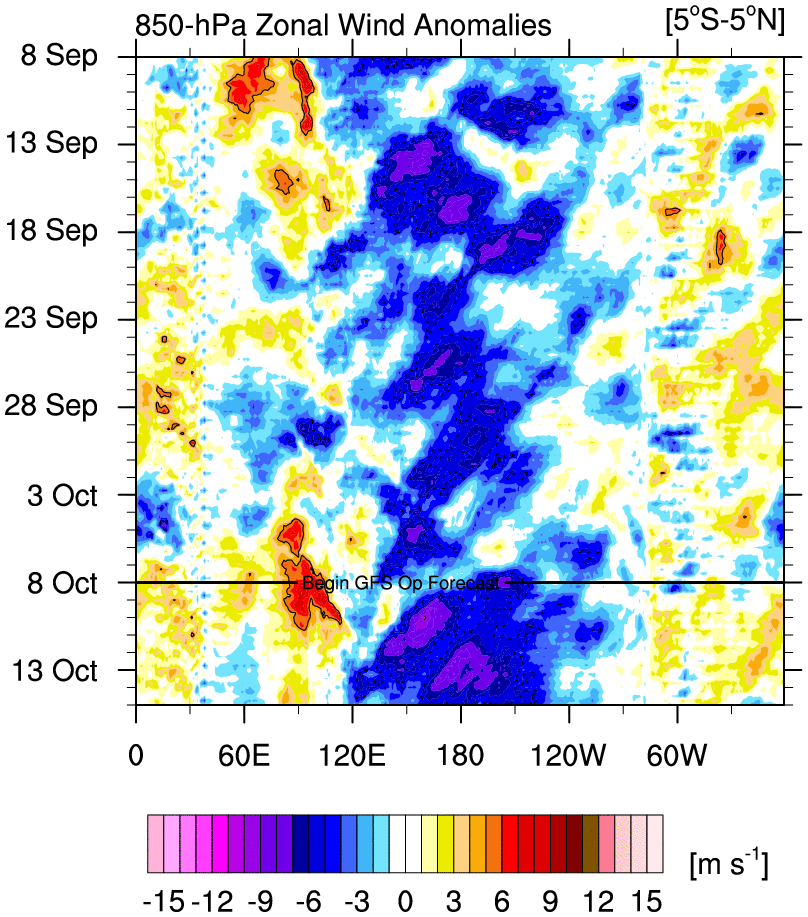
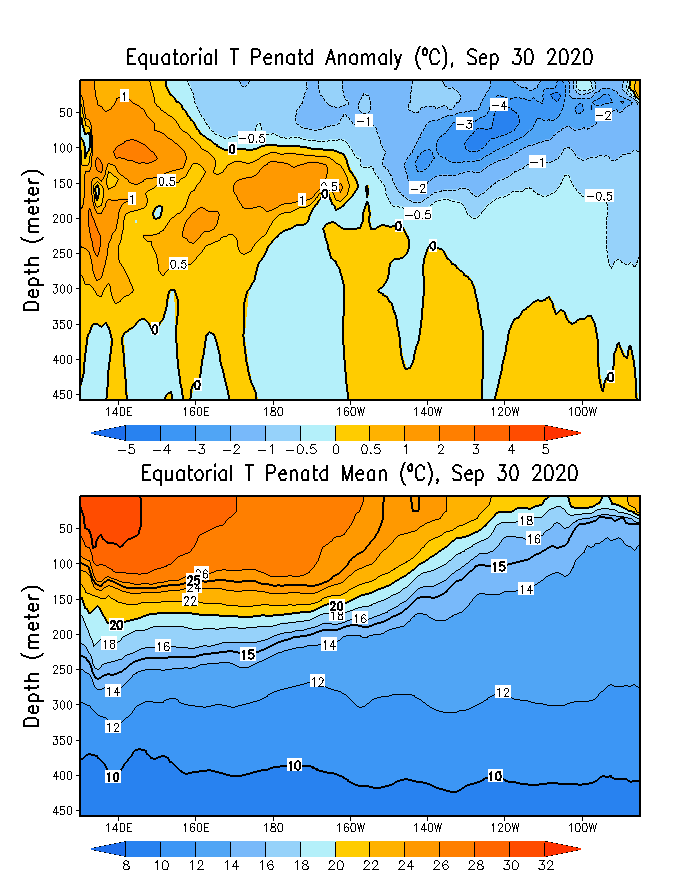
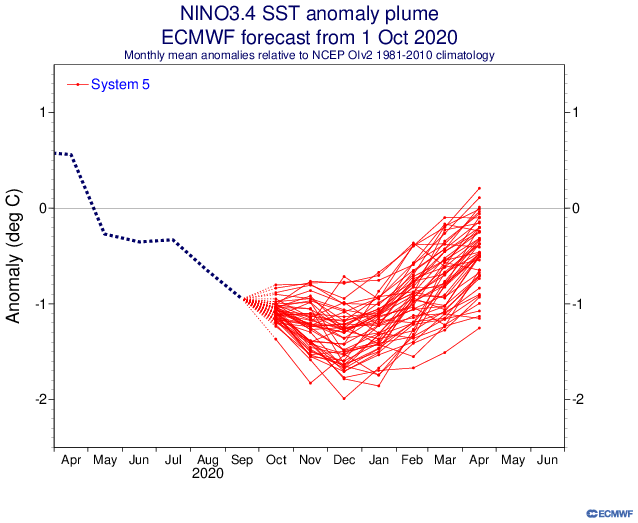
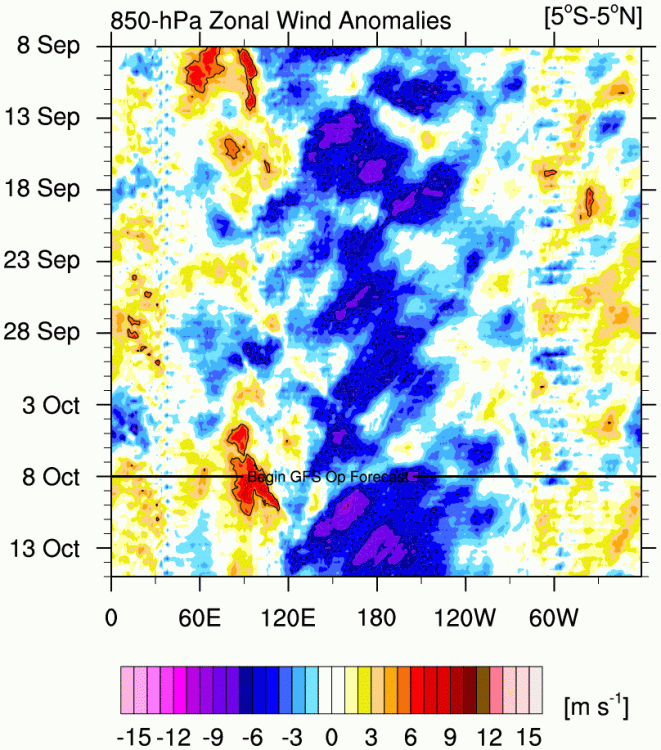
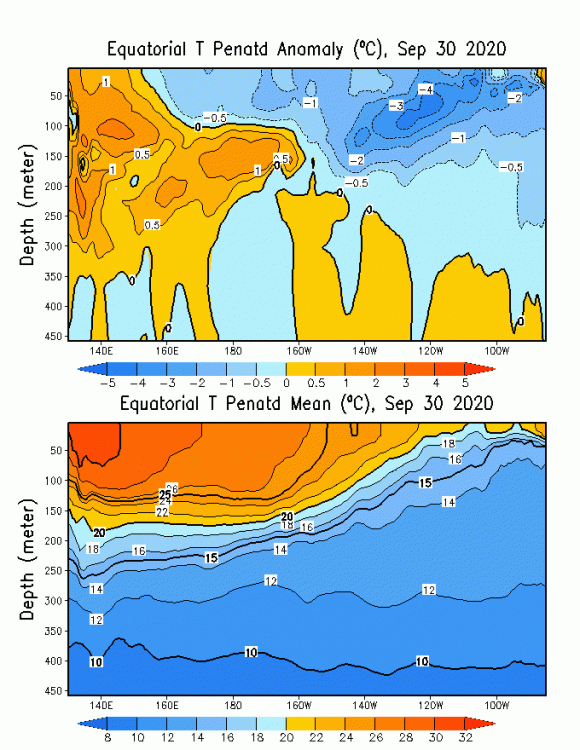
This La Nina is really starting to crank. ECMWF really increased the peak of the Nina....a lot of members in the -1.5C or stronger range now. Hardly any were there in the Sept forecast...and pretty much all of them save for a couple are -1C or stronger. Easterlies look like they will only pick up as well. Waiting for the CPC T-depth anomaly to update (should be any day now)....but even the 9/30 readings were impressive. This signals a moderate basin-wide La Nina.
-
Well '17-'18 was pretty damned good. (96" at ORH and 60" at BOS)...and actually 2016-2017 was above avg too, just less so than 2017-2018. I think BOS was 50ish and ORH 80ish. No doubt the last two winters have sucked though for SNE...as well as the one immediately following '14-'15.
-
Wednesday, October 7, 2020 Convective Potential
ORH_wxman replied to weatherwiz's topic in New England
Actually looks like PYM gusted to 52 knots too. -
Wednesday, October 7, 2020 Convective Potential
ORH_wxman replied to weatherwiz's topic in New England
I would say at least 9...PSF did too. The list ginxy posted said 53mph but I see a peak gust of 52 knots (60mph) -
Wednesday, October 7, 2020 Convective Potential
ORH_wxman replied to weatherwiz's topic in New England
Yeah it was. There was 50 knots back up by SYR -
Wednesday, October 7, 2020 Convective Potential
ORH_wxman replied to weatherwiz's topic in New England
-
Wednesday, October 7, 2020 Convective Potential
ORH_wxman replied to weatherwiz's topic in New England
YEah pretty much every ASOS between ALB and BOS reported >50 knots. ALB, PSF, BAF, CEF, ORH, BOS...and even that pit in OWD gusted to 50 knots. This was legit. -
Wednesday, October 7, 2020 Convective Potential
ORH_wxman replied to weatherwiz's topic in New England
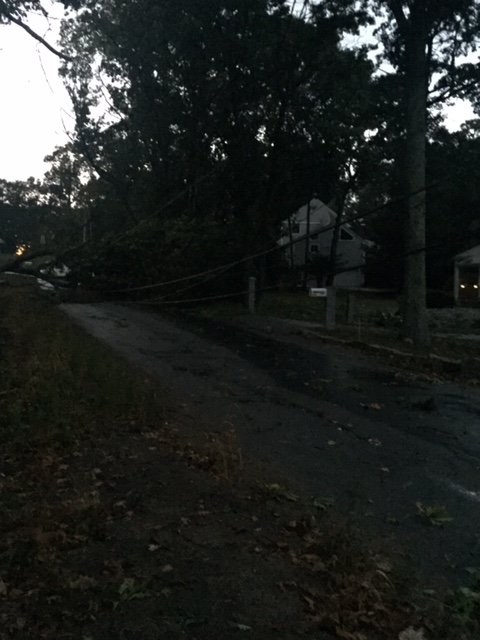
Wow. We just got absolutely smoked. Some huge branches down in neighbors. Def severe gusts. We lost power too. -
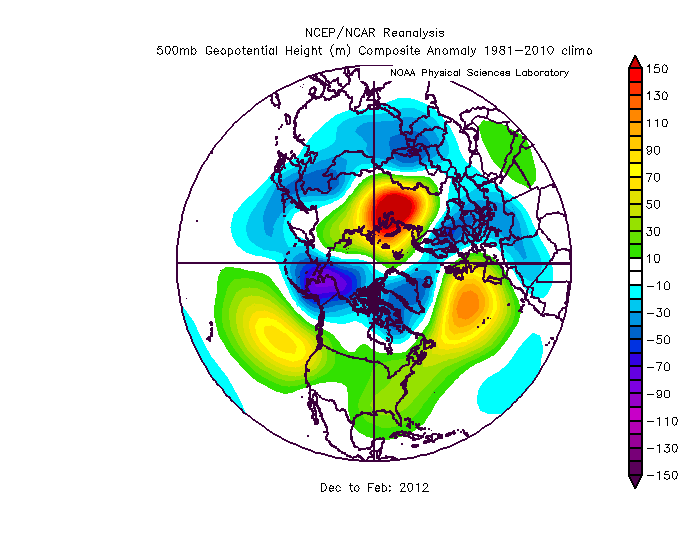
I think it was 2014-2015 when the Euro seasonal and EuroSIPS were showing this monster EPO ridge....huge positive height anomaly over AK and the Yukon Territory, basically the perfect cold-loading location for central Canada and the northern CONUS.....and it had 2m temps torched....maybe one small area of near normal or something. I remember Scott and I making fun of it. Moral of the story was the 2m temps don't always reflect the upper air forecast. We still haven't figured out why it struggles so much with that. We were joking there was a climate change parameter in there that just paints everything red.
-
FWIW, I think Canada (and prob northern tier of CONUS) is way too warm on that 2m map if the H5 anomaly verifies.
-
Yeah you hit the huge March hard too. LR is tough to nail obviously. If you can get it pretty accurate about 60% of the time, you'll be doing very well.
-
To be fair, it shows warm 2m temps over us....though I agree I woudn't be scared of that H5 look. But he's pretty far south in CT...that would def be a latitude look, so there's reason to like it less the further south you are. Esp with that low height anomaly on the southern tip of Greenland and into Davis straight like 2007-2008.
-
Yeah the obscene torch February and then the obscene March blocking episode are unlikely to repeat. It would be cool to see the single months but that site doesn't show them.
-
Actually looks pretty similar to 2017-2018
-
2018-2019 was the first winter since 2007-2008 that didn't have a double digit storm at ORH. They only got 9.6" in the 3/4/19 storm. Pretty impressive streak of 10 winters. Of course last year they had 17" in the early December storm. They escaped 2011-2012 too because of the October storm.
-
Yeah the early ‘50s were bad. Still doesn’t beat the 4 consecutive dead-ratters between ‘88-‘89 and ‘91-‘92....not only was it 4 consecutive below normal winters and not only did it include a top 5 least snowiest winter, it is also the only time on record ORH has gone 3 consecutive winters without a double digit snowfall....and it actually went 4 consecutive just to make sure it had the record secured. Lol
-
Yeah there is a lower variance over the interior which does give a smoother graph when plotting out seasonal snowfall. Still, even at ORH, going 20 years without back to back turds is pretty tough...below are instances of 2 or more consecutive below average snow seasons (I used <60” as the threshold...I consider something like 63” as “normal” for ORH since it’s within the middle 20 percentile): 2019-2020 2018-2019 1999-2000 1998-1999 1997-1998 1991-1992 1990-1991 1989-1990 1988-1989 1985-1986 1984-1985 1980-1981 1979-1980 1978-1979 1973-1974 1972-1973 1954-1955 1953-1954 1952-1953
-
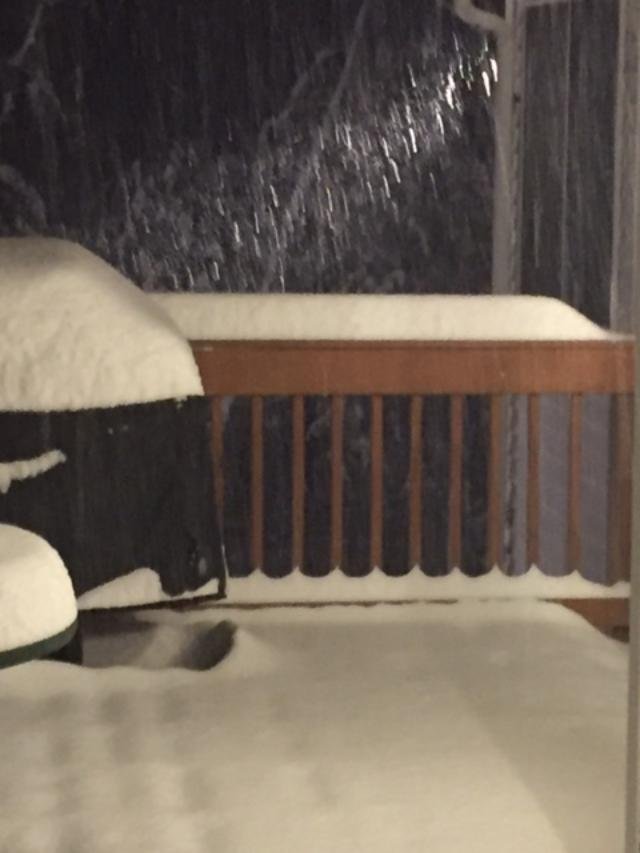
Yeah i was expecting I’d be done in round 1 with about 5” or so when we were a couple hours into it and then all hell broke loose and all of the sudden I have over 9” OTG and the dryslot is ripping in. I barely even ever had pingers. Maybe a couple at the very end and a little freezing drizzle overnight before I was back to flakes the next morning. The big rates are always fun. Especially when it busts a forecast in the positive direction. The radar loop is great because you can just see that WAA slamming into a brick wall over MA.
-
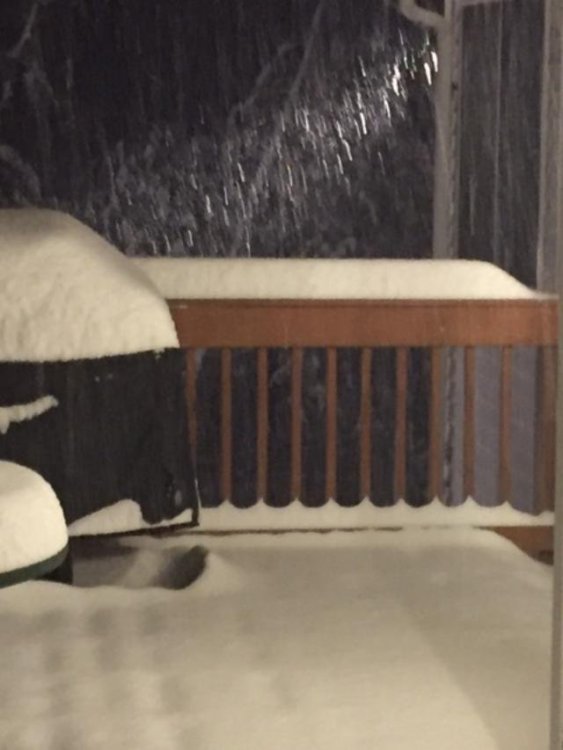
That front end thump basically maxed out over my head (you can see the first two radar loops above i posted, that was all snow here) I remember I kept updating it at the end when I was going at 4”/hr....I had like 2 or 3” and then all of the sudden near the end of that thump I had 9” two hours later, lol. Then i got like 1-2” the next day on intermittent easterly stuff and then the final 6” early on Dec 3rd. Here was a pic of the 4”/hr stuff...kind of hard to tell though because it was night time, but you can kind of tell it’s doing the “choking flakes” thing there. This is in the middle of it when we had about 5 or 6” while less than an hour earlier we had 2”.
-
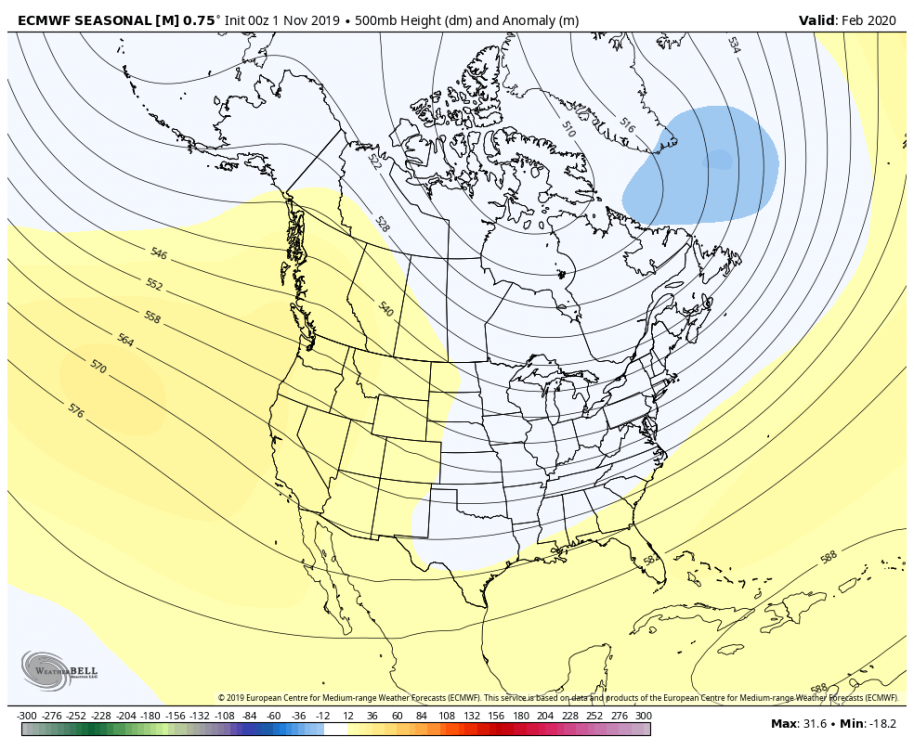
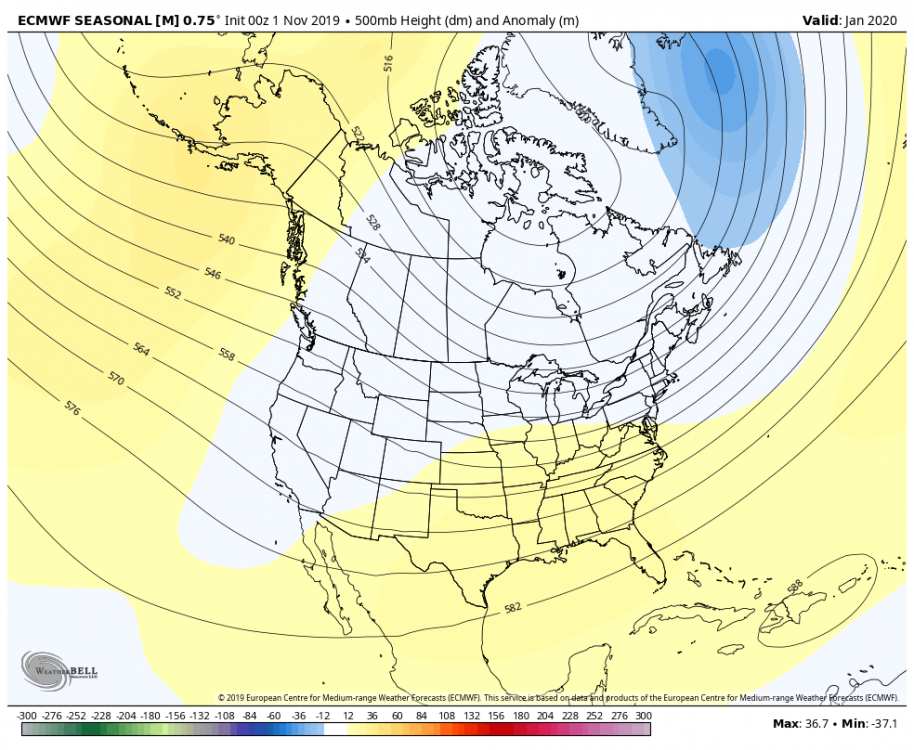
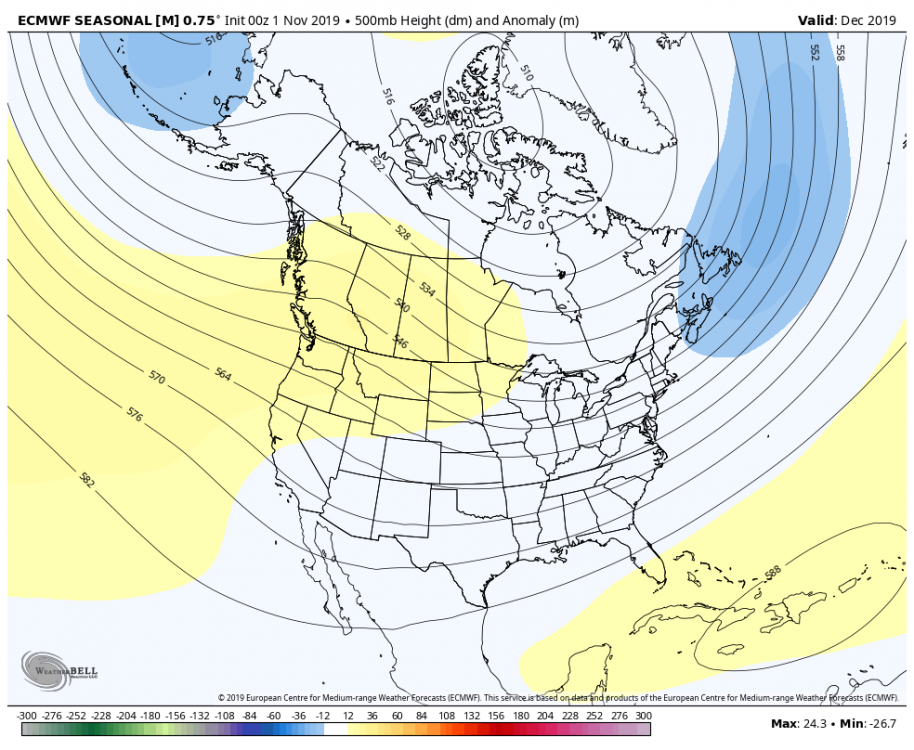
I don’t remember what October showed...maybe that is correct. Here was November, a shorter lead time keep in mind when the skill improves
-
It's actually amazing to think about that, at least for ORH, the past 2 seasons were the first consecutive below normal snowfall seasons since 1998-1999 and 1999-2000. I think a chunk of CT and RI/SE MA did have back to back subpar seasons in '06-'07 and '07-'08. Still, that is not a lot of bad stretches.