so_whats_happening
-
Posts
1,347 -
Joined
-
Last visited
Content Type
Profiles
Blogs
Forums
American Weather
Media Demo
Store
Gallery
Everything posted by so_whats_happening
-
2024-2025 La Nina
so_whats_happening replied to George001's topic in Weather Forecasting and Discussion
@snowman19 there seems to have been another decent volcanic eruption this one much further north. https://www.cnn.com/2024/08/17/world/earthquake-kamchatsky-tsunami-warning-russia-intl-latam?cid=ios_app -
2024-2025 La Nina
so_whats_happening replied to George001's topic in Weather Forecasting and Discussion
This is probably best left for the Meteorology 101, but it really depends on how detailed of a picture or number you want. This site does rather well in capturing the numbers, you even have the option to zoom into states to get a closer look. https://hprcc.unl.edu/maps.php?map=ACISClimateMaps Outside of that weather.gov is your other best option and click in a region (say NYC area) then climo for very localized totals but no actual map. -
2024-2025 La Nina
so_whats_happening replied to George001's topic in Weather Forecasting and Discussion
The nice stripe we had last year due to Franklin, fairly similar to what Ernesto produced actually managed to stick around for some time. If this had occurred in June or July I would have agreed in the reversal but as we get later into the summer and early fall these tend to have more profound impacts. This allowed for more troughing episodes to show up more in this region as we moved into fall and early winter. If we can continue to see multiple tropical systems forming in the general region we could start to see a small cold pool form. Again not proclaiming this will collapse the -PDO state but simply dents and dings will start to add up. Instead of having a monstrous + anomaly we could start to see it show just a more above normal look if it keeps up. Especially if we are going to see lift concentrated into the MC/ West Pacific like models are suggesting toward the end of the month. I think the area ENE of Japan will just continue to be pushed E over time.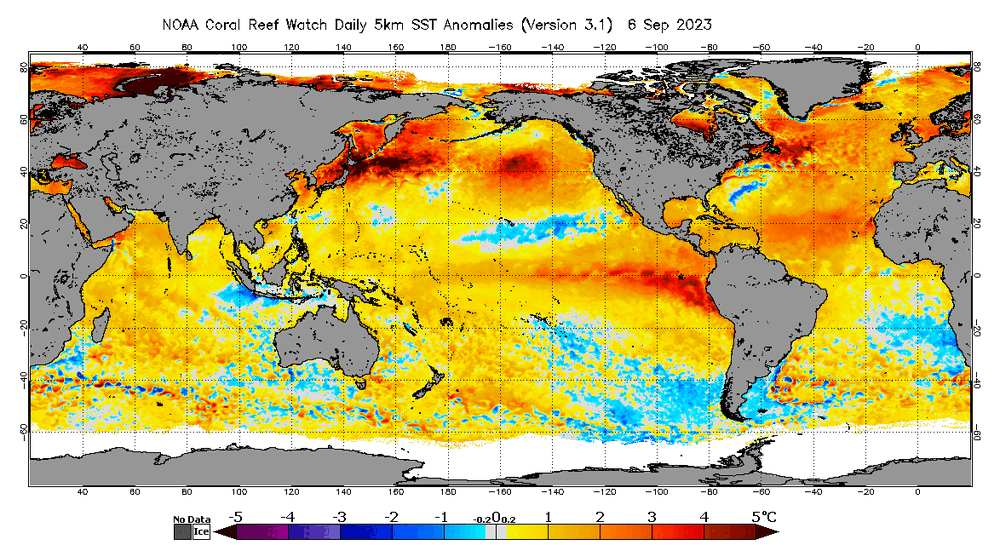
-
2024-2025 La Nina
so_whats_happening replied to George001's topic in Weather Forecasting and Discussion
Looks like Typhoon Ampil put a decent dent into the SST heat east of Japan and the smaller tropical systems over the last week or so here and there have cooled the area somewhat. It looks as though the SST warmth is now concentrated into two areas one hundreds of miles ENE of Japan and then another concentrated area around Sea of Japan, the Koreas, and the East China sea/ Yellow sea region. It will be interesting if this was just a quick cooldown before we cook the area again or if this may have finally started a change. Regardless the PDO will still probably hold in the -2 to -3 range for quite some time unless we continue to see more typhoon activity in the next few months. I would post animations but it seems the file is slightly corrupted halfway through, hope they can fix this in the future. Another interesting note is the cooling showing up around Sumatra. Again another little blip or something to keep an eye on..thumb.png.7b7e663a110e03bab471510dea191f12.png)

-
2024-2025 La Nina
so_whats_happening replied to George001's topic in Weather Forecasting and Discussion
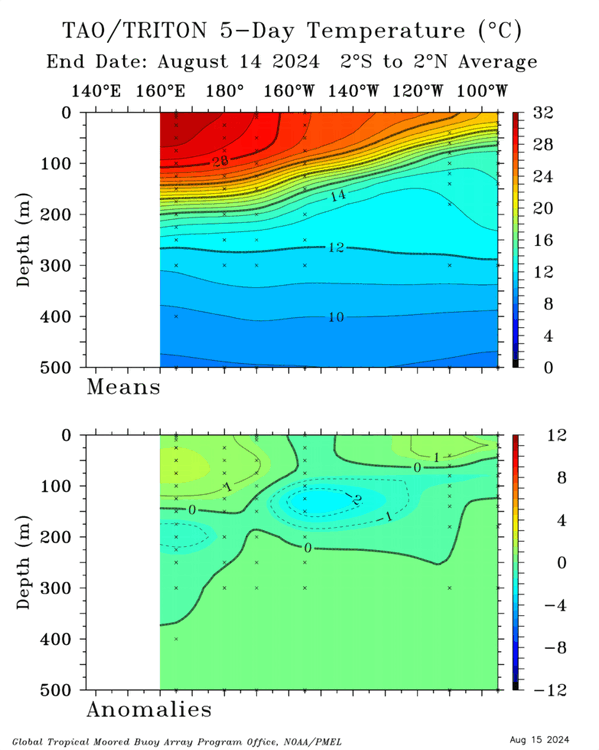
Wonder if it was just a one day blip but TAO has actually weakened the subsurface quite a bit. Here is a GIF of end of July through early August and a still frame of just the 14th. I actually find the difference between TAO and CPC to be quite interesting..thumb.gif.abfc9b3a6bc94a281664bdb3ac4d5907.gif)
.gif.113af37a15fcfdfeaf204737fc63b7a5.gif)
-
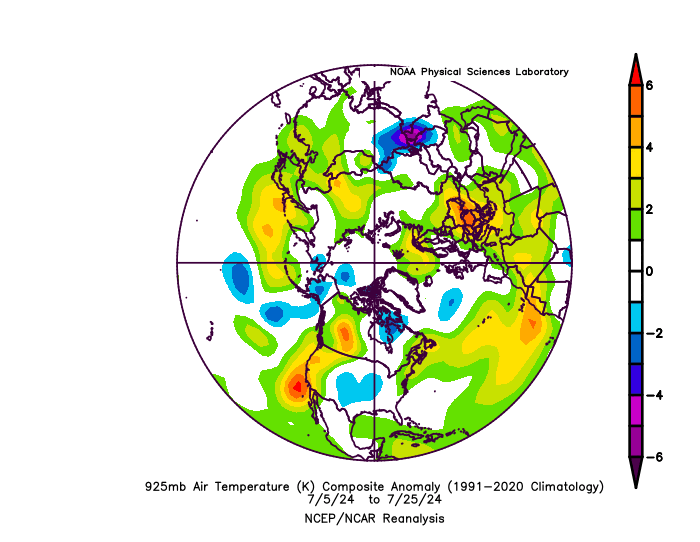
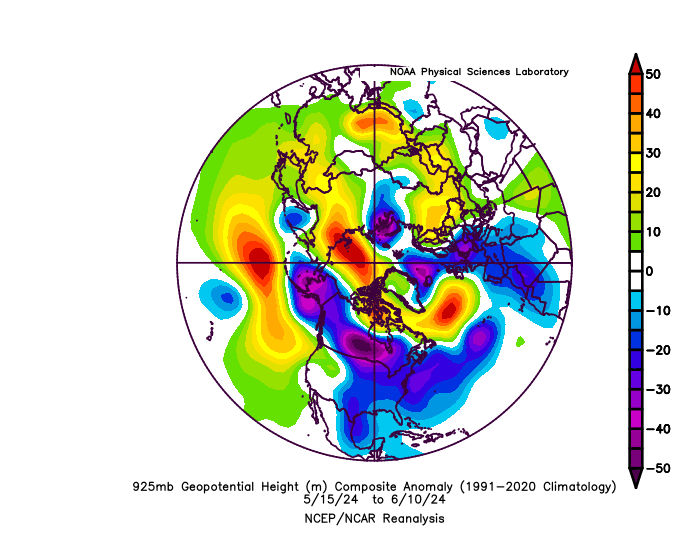
Arctic Sea Ice Extent, Area, and Volume
so_whats_happening replied to ORH_wxman's topic in Climate Change
It is really impressive to see that we saw such a large area loss with this type of pattern. It was a rather rough mid May to about mid June though.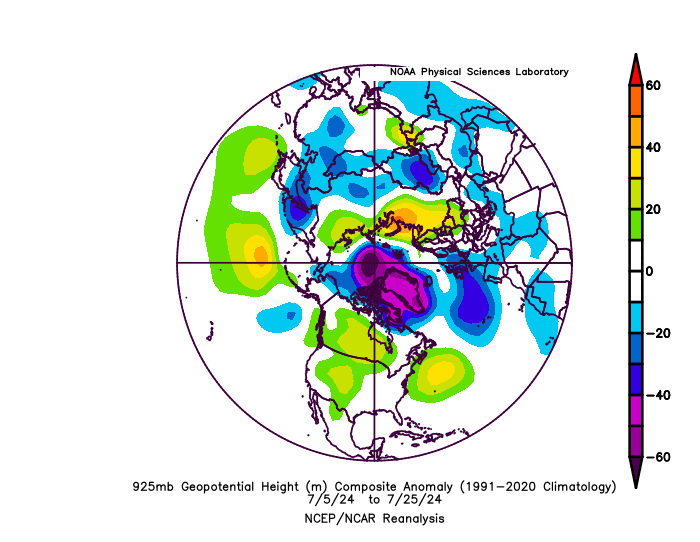
-
2024-2025 La Nina
so_whats_happening replied to George001's topic in Weather Forecasting and Discussion
https://psl.noaa.gov/enso/mei/ They finally have updated MEI data. The charts are not updated but the values are. @snowman19 -
2024-2025 La Nina
so_whats_happening replied to George001's topic in Weather Forecasting and Discussion
Hot linked so this will change from day to day. It does look like the Atlantic cool anomalies are taming a bit as the trade wind increase in this area finally goes away. Concentration of trades are finally happening around 120E to about 150W and may slowly move eastward to about 120W by mid to late month. Hoping this really knocks a dent in the warm pool east of New Guinea. Forcing right now looks to set up around 70-100E over the eastern Indian Ocean so fairly 1998 like in that manner. The models are trying to push a potentially decent MJO wave as we move into mid month so look for activity to ramp up in the tropical Atlantic before maybe close to the end of the month getting some activity into the western PAC. I do think the models are moving the MJO a bit too fast but we will see. If we can get cooling into the 150E to 150W equatorial region there will be no hurry for the MJO to want to go to 5/6/7. Have a busy weekend coming up so hopefully we see some good changes by the start of next week. -
Arctic Sea Ice Extent, Area, and Volume
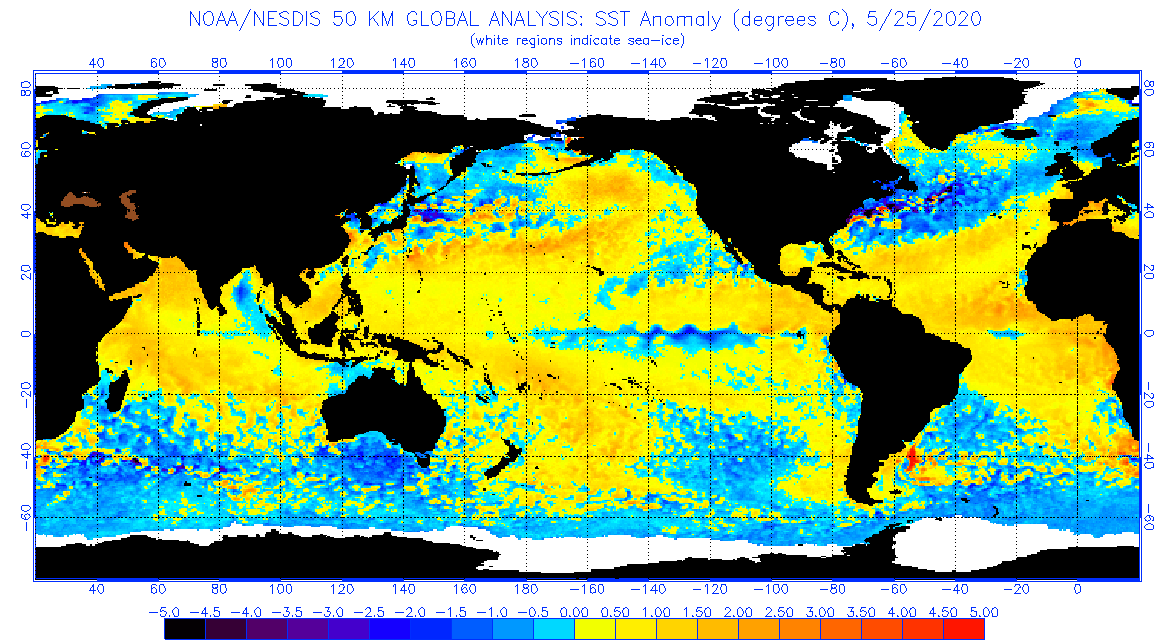
so_whats_happening replied to ORH_wxman's topic in Climate Change
Comparison of 2020 to 2024 at this time. It looks like the ESS is holding us up even with thickness as bad as it is.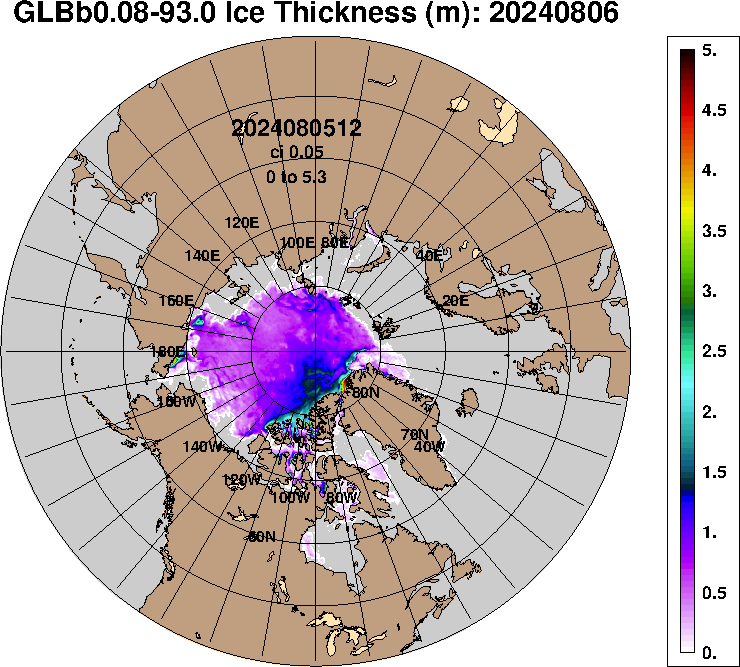
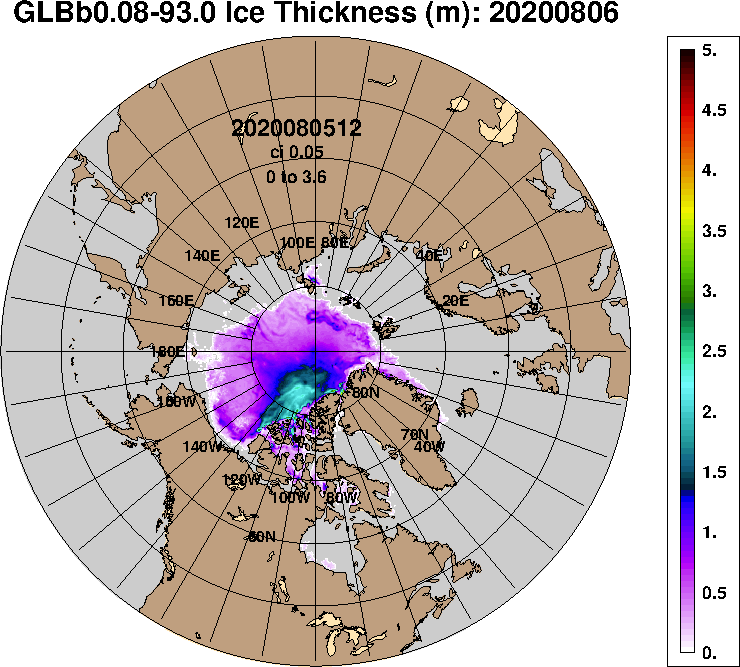
-
2024-2025 La Nina
so_whats_happening replied to George001's topic in Weather Forecasting and Discussion
Just a quick update missed the 31st (whoops) and just kept the 4 day regime from the 1st and 5th of August..thumb.gif.02c66d17fa69e90796907b713c14d84c.gif)
-
2024-2025 La Nina
so_whats_happening replied to George001's topic in Weather Forecasting and Discussion
Still need to be cautious though as the models have not handled these well but with MJO movement this could actually hold. Lets see what it looks like after this weekend
-
2024-2025 La Nina
so_whats_happening replied to George001's topic in Weather Forecasting and Discussion
Yea forgot to add in the solar aspect. It would be something to see very little in the way of cooling if any at all with this mini Nina (so far) event. In fact if we somehow manage to keep adding more to temps there is definitely something to worry about. -
2024-2025 La Nina
so_whats_happening replied to George001's topic in Weather Forecasting and Discussion
Im not so sure because we have had this strong -PDO/ marine heatwave for some years now all it did to temps was hold serve so temps were not cooling as much as they should have the heatwaves have not effectively added more heat to the system. I would agree though that the heatwaves probably help maintain temps though and don't allow nearly as much cooling as what should have occurred. This massive spike though was definitely the makings of something else. Just look back at 1998, we saw an almost .6C spike similar to this one but we weren't dealing with the marine heatwaves like we are now. -
2024-2025 La Nina
so_whats_happening replied to George001's topic in Weather Forecasting and Discussion
Ninos help release a ton of heat into the atmosphere, there is a reason for the spikes in every single Nino year. This most recent spike wreaks of the aftermath from Hunga Tonga water vapor affecting the lower atmosphere in combo with a Nino event. The problem is that if we do not actually decrease our overall GHG usage (we wouldn't magically reverse the effects either in a few years and then say yay it is fixed, going to take a very long time) we don't see nearly enough of a correction downward as those gases just hold the heat and we continue at these new levels from here on. Essentially if things hold we may have taken another step up. That would be a very large step if that has happened and not a good sign for the future of winters. -
2024-2025 La Nina
so_whats_happening replied to George001's topic in Weather Forecasting and Discussion
Looks like we may have a rather significant pullback of VP anomalies from the Maritime Continent coming up here.
-
DCA _ NYC _ BOS __ ORD _ ATL _ IAH __ DEN _ PHX _ SEA +1.7 +1.6 +1.9 +1.1 +1.6 +1.1 +1.8 +2 +3.2 Before I forget, may tweak slightly before the 1st. I'll add an edit time if I do. Edit: 02z
-
2024-2025 La Nina
so_whats_happening replied to George001's topic in Weather Forecasting and Discussion
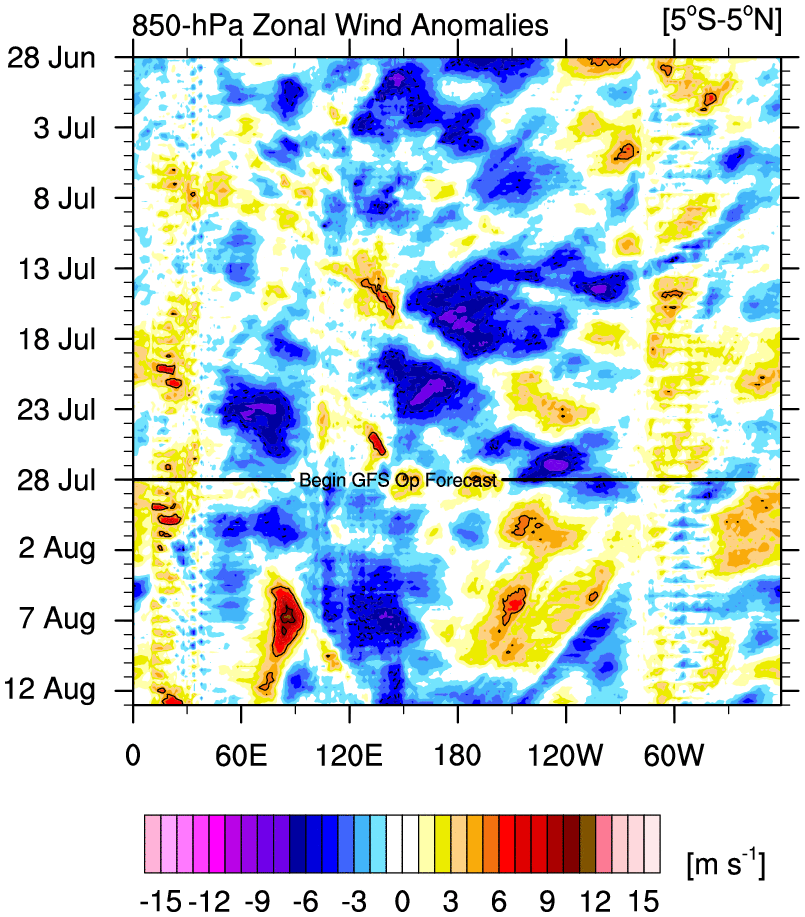
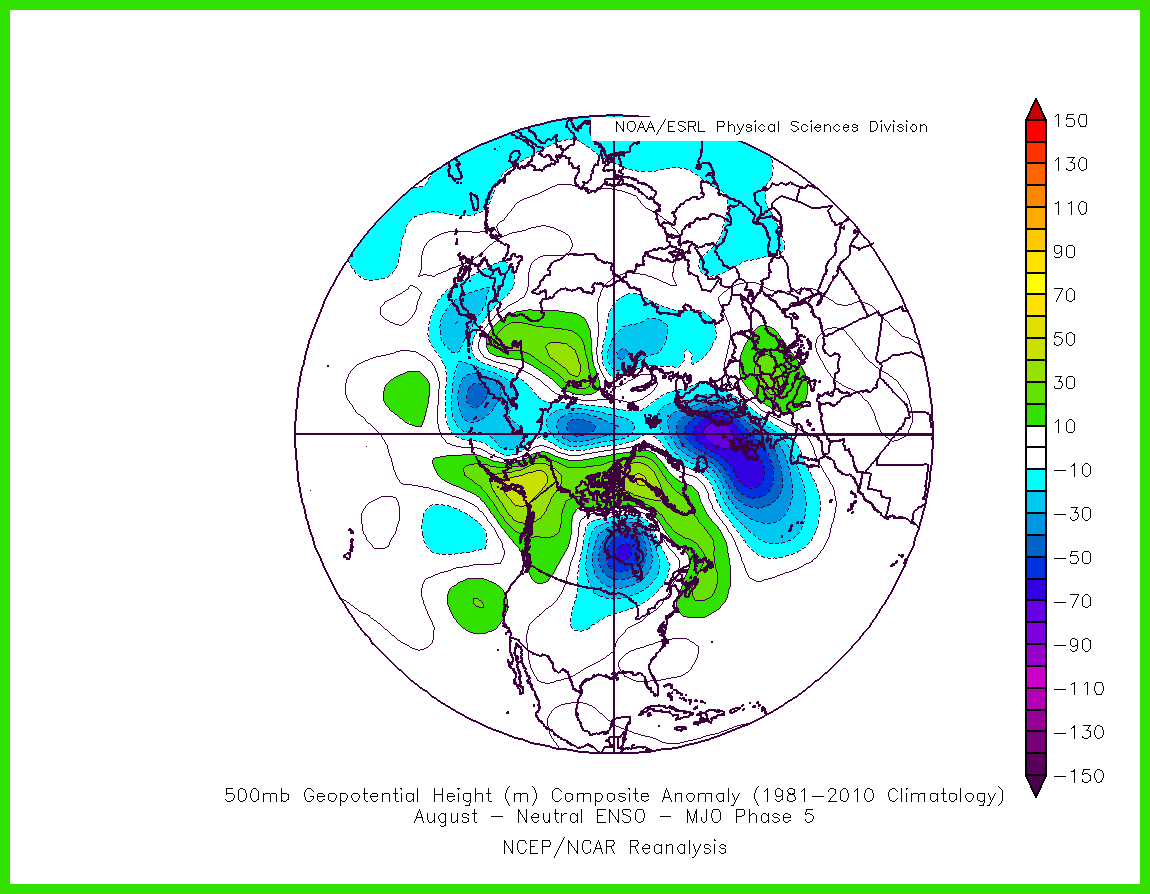
It looks like the models have finally decided we swing slightly (low amplitude on plots) through 7/8 before hitting 1. This is allowing the EPAC to finally get some tropical action. Bud was kind of a surprise little quick pop up and shows when the MJO just starts to enter the right areas it is going to produce. Carlotta looks reasonable still not sure yet about Daniel but it really depends on how quickly the MJO moves. Still looking like after this weekend the door opens up wide for the Atlantic. We may even see that sneaky wave become something as it gets to the islands by the weekend being close to the edge of uplift from the moving MJO wave. So after we have just experienced Phase 5 for the past almost 2 weeks it will take some time for the mid latitudes to feel the effects of 7/8/1 as we move into August. Here is 5 in La Nada state to end July and as we head into August. We should start to see weakness/ troughing in the East come mid next week. After this and depending on the state of ENSO during that time we may have to start using Nina settings for the remainder of August in 7/8/1. Which actually hold troughing into much of the east but slowly push it westward in time to about GL region. This will open the door for the east coast/SE to potentially see some tropical activity push in as we go to mid to late month of August. Hot the rest of this week into the weekend and then we should start to get closer to average toward middle of next week maybe finally increasing rainfall chances with it too. Looks like some fun times ahead.

-
2024-2025 La Nina
so_whats_happening replied to George001's topic in Weather Forecasting and Discussion
It could be many reasons. This version is 5N-5S, CPC maybe uses a different buoy source versus TAO, CPC may lag a bit to TAO display, etc. Unfortunately I do not have those answers other than TAO is sourced around 2N-2S versus CPC which is 5N-5S. Just showing all the updates available to us. -
2024-2025 La Nina
so_whats_happening replied to George001's topic in Weather Forecasting and Discussion
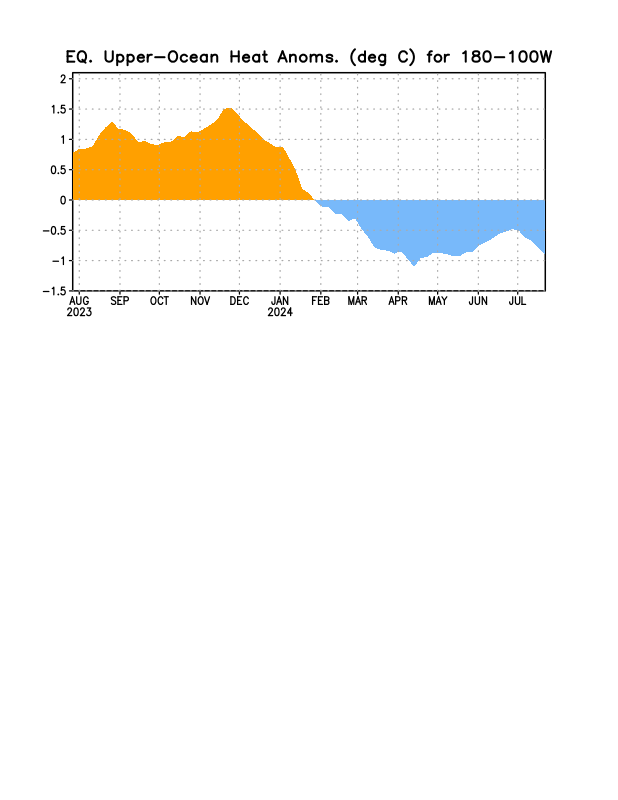
It is trying latest 100-180 subsurface reading shows we are closing in on levels we saw back in April.
.gif.f55edbe6cb173be14c2bbb577f6a329a.gif)
-
2024-2025 La Nina
so_whats_happening replied to George001's topic in Weather Forecasting and Discussion
Just a quick update June and July TAO data and Hovmollers. You can see that the Easterlies did try to have an impact on the pattern but have since been replaced with weaker trades. Maybe we are shifting the forcing like Bluewave had mentioned in earlier posts as possibility going forward..thumb.gif.9473a323232cb235a8d9a225345abf03.gif)

-
2024-2025 La Nina
so_whats_happening replied to George001's topic in Weather Forecasting and Discussion
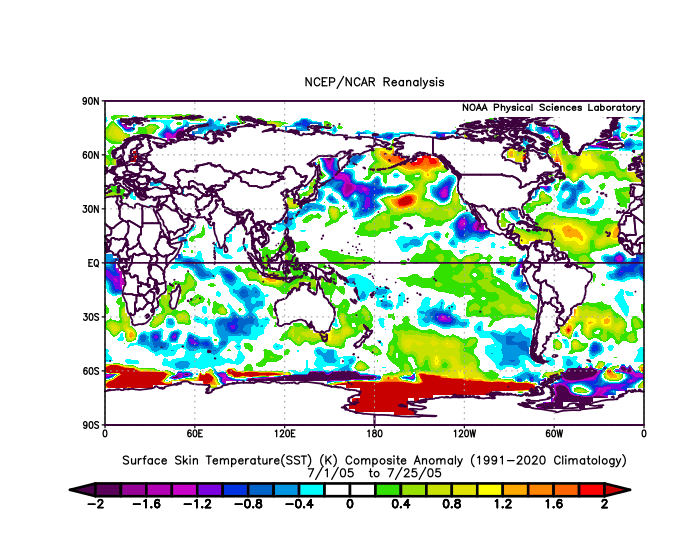
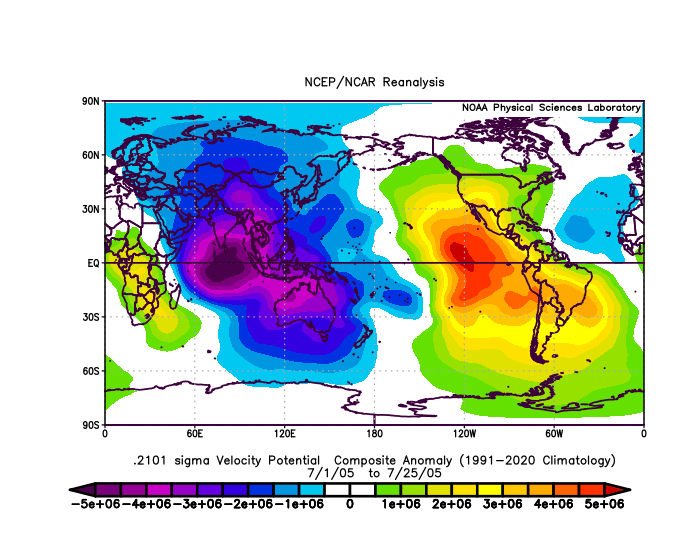
I dont remember stating 22-23, I did post about 2020 (since this was a first year Nina situation) though maybe that is why you keep mentioning 22-23 year? To use 2020 as an example this was the pattern that looked almost identical to placement for your July picture. By the looks of it forcing should have been much further east due to those rather anomalous waters around New Guinea, but that wasn't the case. Was 2020 just an anomaly to the situation? 1998 (since this was also a first year La Nina) seemed like reasonable placement due to the waters around Sumatra actually showing a more positive value than most in the pacific, besides the lasting affects of the super Nino into almost mid summer across 1+2 region. 2005 had a funky look as well a westward displaced forcing compared to where greatest warm values were. Honestly this year should look fairly similar to 1998 VP with the warmest warmest waters overall near Sumatra or a less intense version of 1998 and broader -VP but as shown that is not the case. Is the atmosphere essentially trying to split the difference because both areas are almost equally warm? I do have to go though so ill try to get a response in tomorrow when Im at work all day.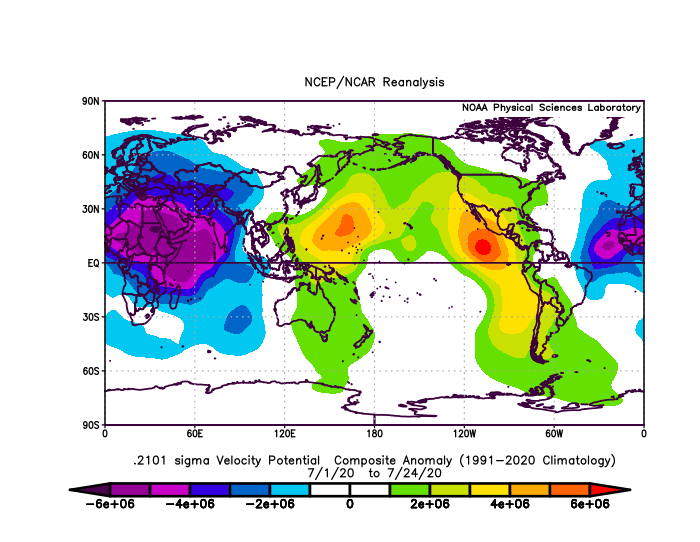

-
2024-2025 La Nina
so_whats_happening replied to George001's topic in Weather Forecasting and Discussion
My point was not about the hurricane season it was more along the lines that we have seen this type of VP pattern before without necessarily having an over abundance of equatorial warmth near the Maritime Continent and the blazing warmth around Japan. So there must be something else to it than just those two features. Maybe it is possible those two features help to amplify the pattern a bit more over the recent years but 1999 just did not have the Maritime warmth we are currently seeing yet had a very similar setup, 1998 was fairly similar but more toward Sumatra region than New Guinea. I do get your point though on the hurricane season and this for sure interrupts that process even with indicators through the roof. -
2024-2025 La Nina
so_whats_happening replied to George001's topic in Weather Forecasting and Discussion
-
2024-2025 La Nina
so_whats_happening replied to George001's topic in Weather Forecasting and Discussion
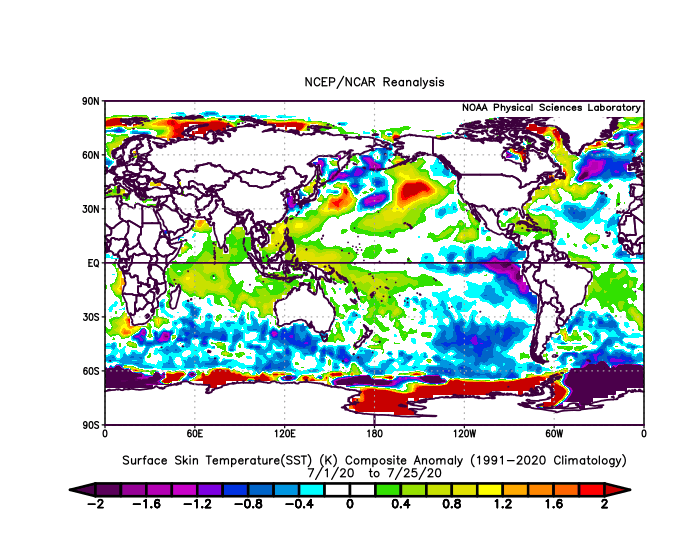
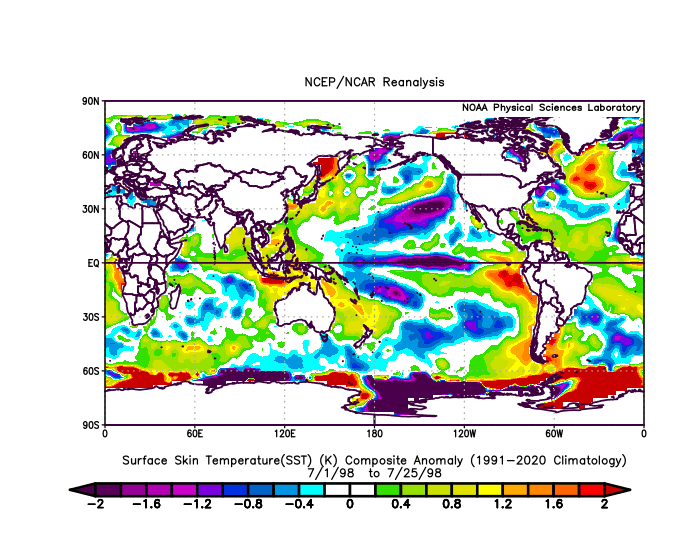
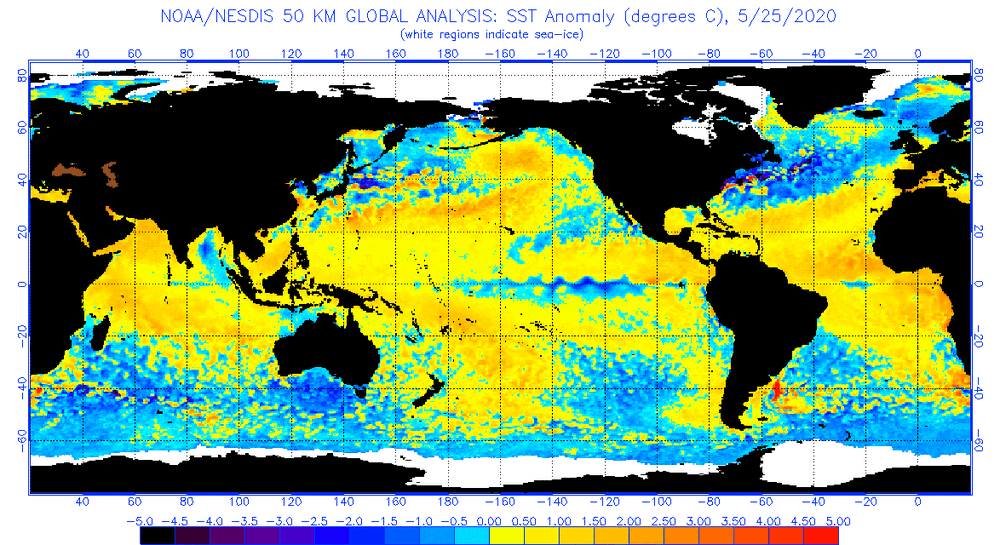
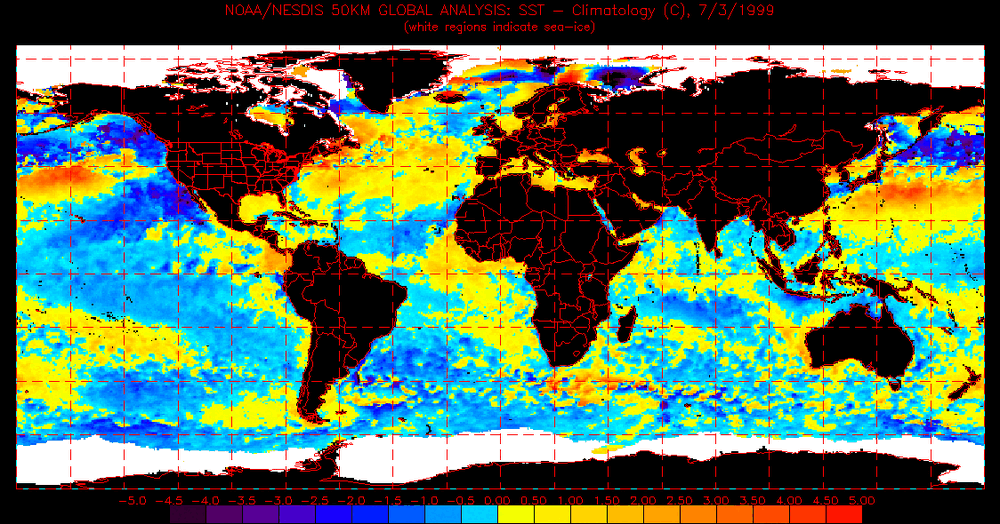
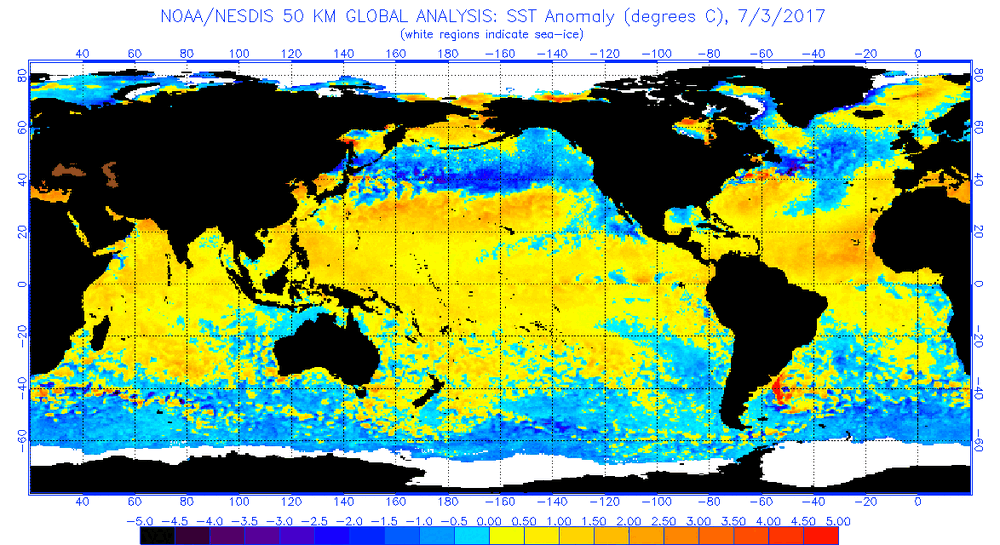
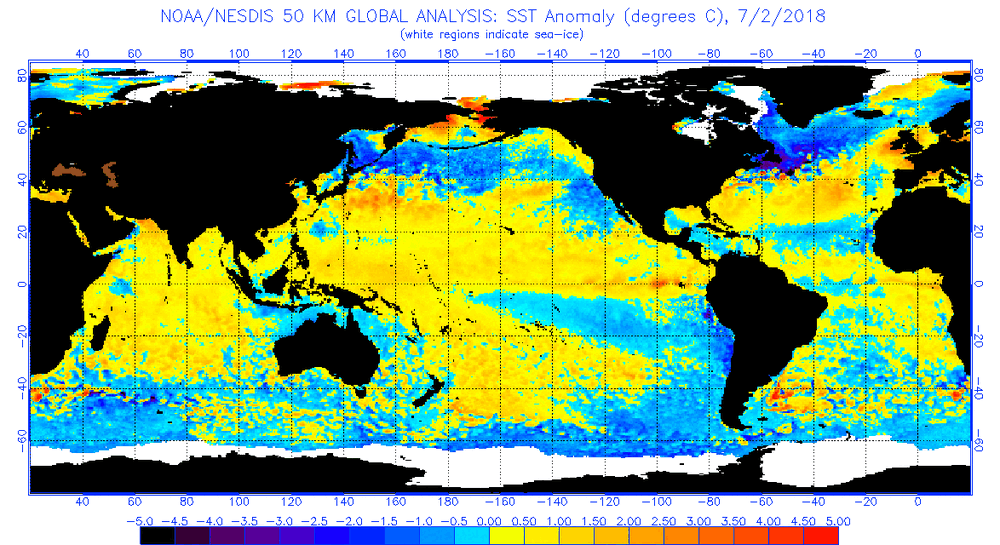
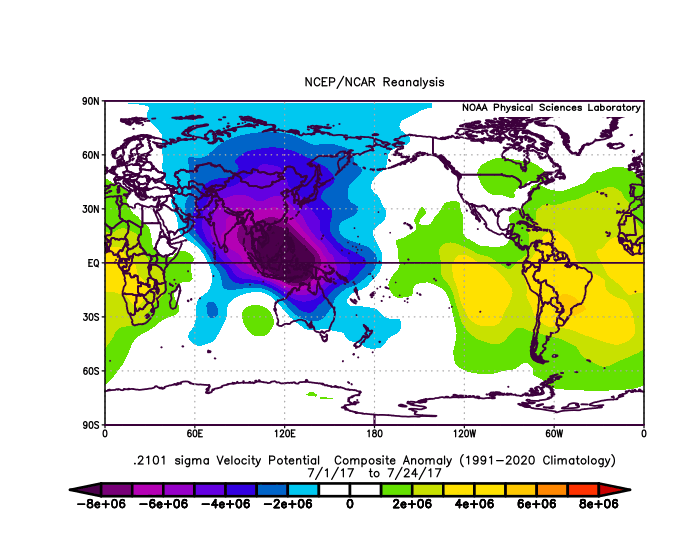
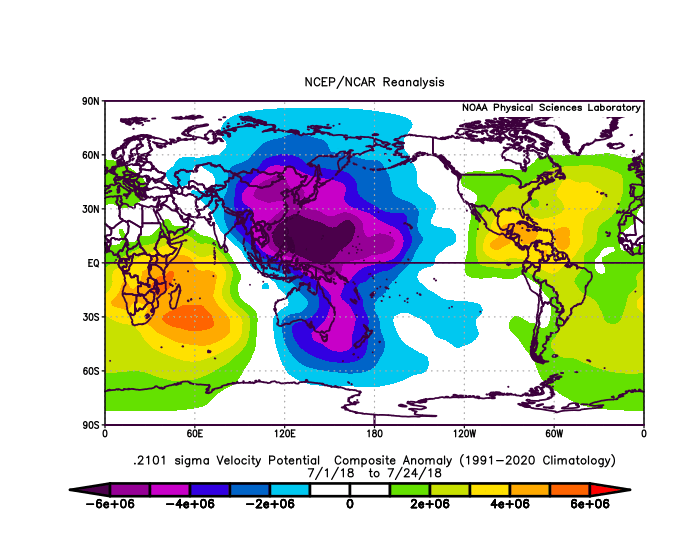
So we saw a very similar VP map to this year back in 1999, 2017, and 2018. Im sure if I ran through the years we could probably find fairly similar looks. 1999 in a second year Nina we didn't have the equatorial warm pool but we did see the warmth SE of Japan giving the PDO -2.34 in July. 2017 had a developing Nina but was rather weak overall PDO was actually positive neutral during this time and didnt have the huge Japan warmth (was more displaced to Korea and mainland China. We did have the equatorial warm pool east of New Guinea. 2018 was actually a weak Nino but managed to have a fairly similar VP response had the warmth SE of Japan in a fairly similar spot to 1999. Also having the warm pool east of New Guinea. However during the developing 2020 Nina event we managed to have a more typical response in July as shown by your maps above. PDO state was negative but weakening and the waters around Japan were not quite as warm. The waters in the IO near Africa were more anomalously warm then near New Guinea maybe that helped in shifting the VP state for 2020? Ill make another post what I have SSTA wise for the beginning of July for these years, except 2020 which I only have until end of May. If you happen to have a better SSTA reanalysis I would love a link.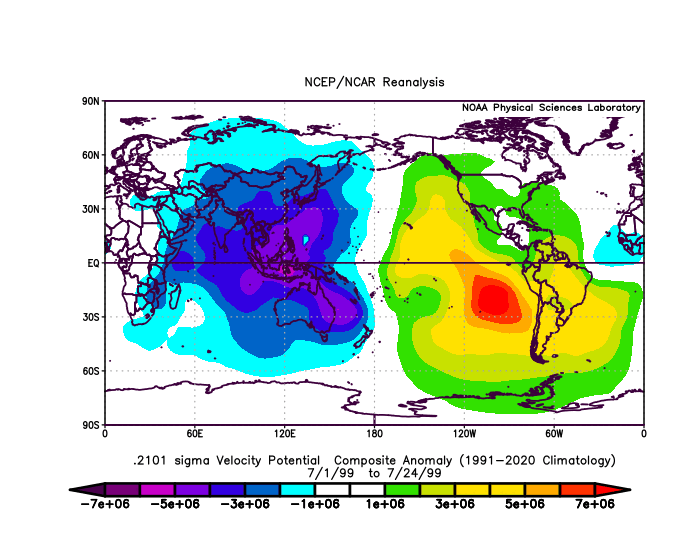

-
2024-2025 La Nina
so_whats_happening replied to George001's topic in Weather Forecasting and Discussion
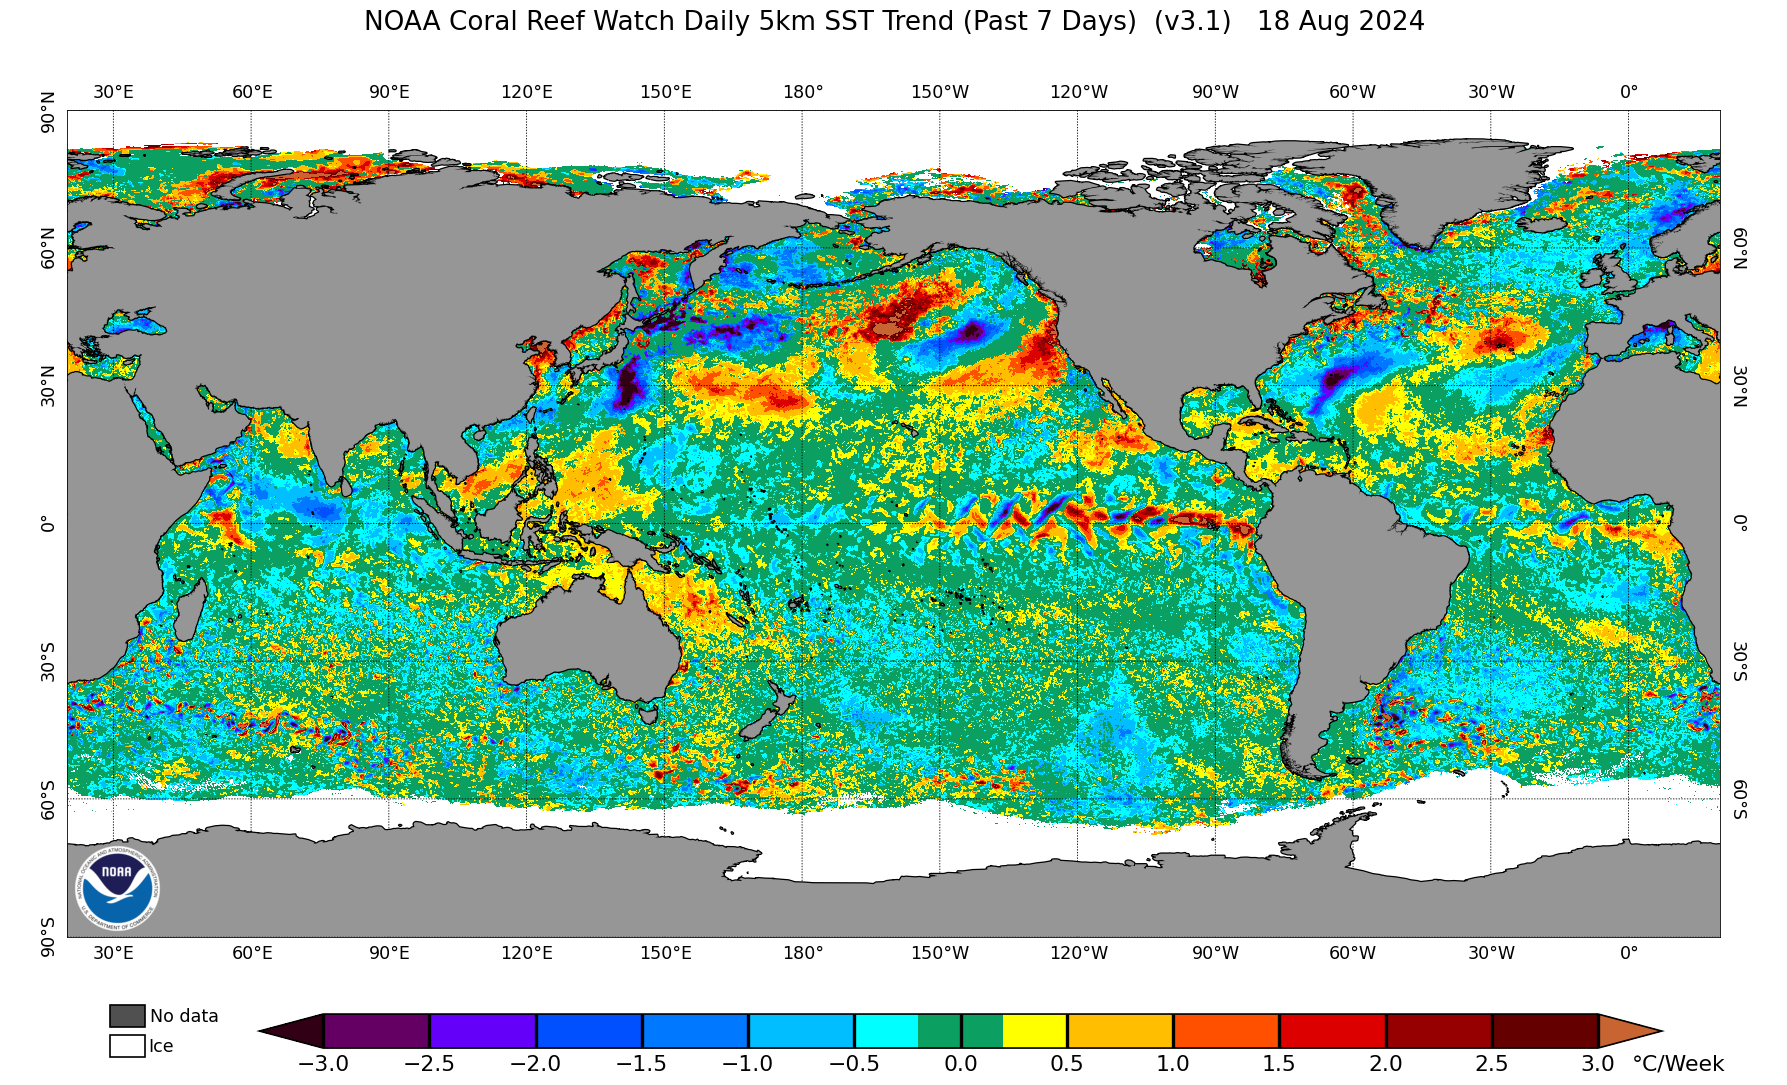
The last typhoon in the WPAC actually had a pretty significant cooling of waters around the Philippines and Taiwan.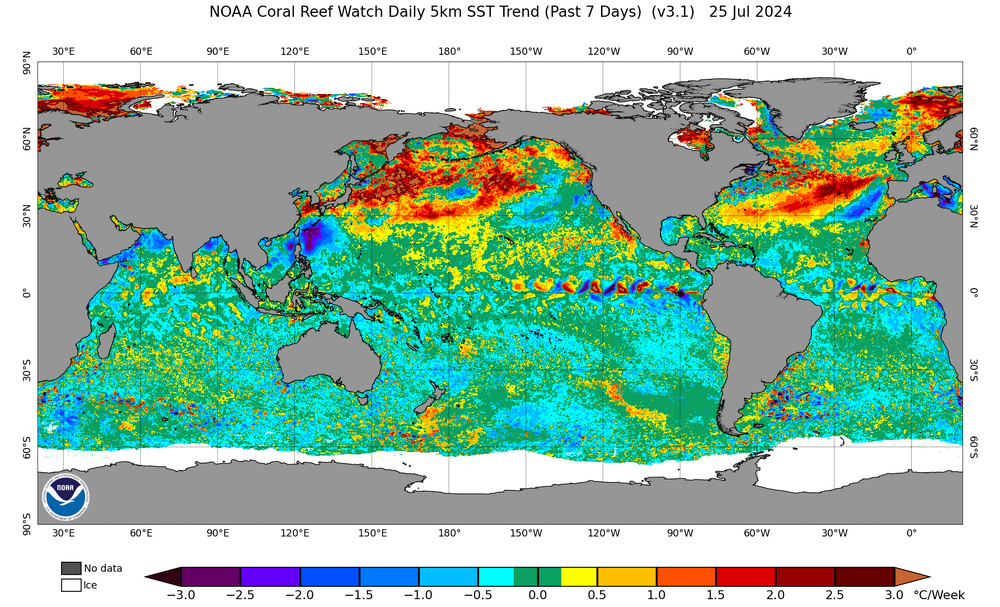


.png.fce6b85ce0c5adee7c20d0bc21b4edd5.png)
.gif.e4700ab49de6e1b7b4a7bc9340d49bf1.gif)

.gif.453d57e0e1f7f45f724e02c8bf570a6c.gif)


.gif.24e34c4b1b26341e5457f09afefaa348.gif)