

so_whats_happening
-
Posts
1,590 -
Joined
-
Last visited
Content Type
Profiles
Blogs
Forums
American Weather
Media Demo
Store
Gallery
Everything posted by so_whats_happening
-
2025-2026 ENSO
so_whats_happening replied to 40/70 Benchmark's topic in Weather Forecasting and Discussion
This is the wonderful thing of strong blocks and poleward flux. Ill have to take a look back and see what exactly caused the flow to buckle so much over the last 2-3 weeks. -
2025-2026 ENSO
so_whats_happening replied to 40/70 Benchmark's topic in Weather Forecasting and Discussion
Lol parade of storms you would be lucky to get one maybe two good KU style storms in a season during the performative Nino style years. My goal this year is one 1 foot snowstorm and move on. Who knew that La Ninas produced quite the rains starting to show up for central and southern California in the medium range. -
2025-2026 ENSO
so_whats_happening replied to 40/70 Benchmark's topic in Weather Forecasting and Discussion
If you don't wish to post photos it is fine, I do wish you would at least reference the sites so that people could see what you are mentioning is all.

-
DCA NYC BOS ORD ATL IAH DEN PHX SEA 1.1 1.4 1.9 1.4 1.1 2.1 2.4 2.4 .8
-
2025-2026 ENSO
so_whats_happening replied to 40/70 Benchmark's topic in Weather Forecasting and Discussion
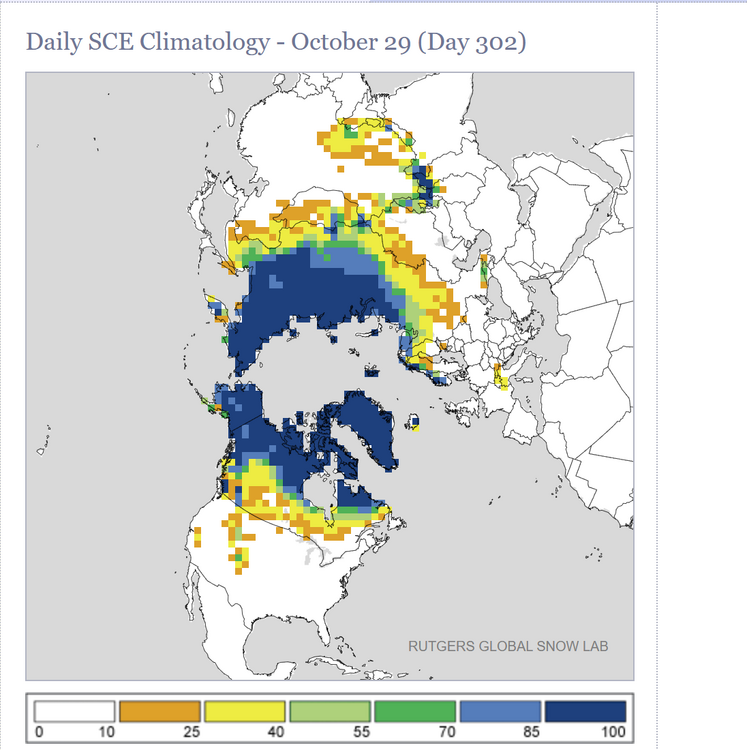
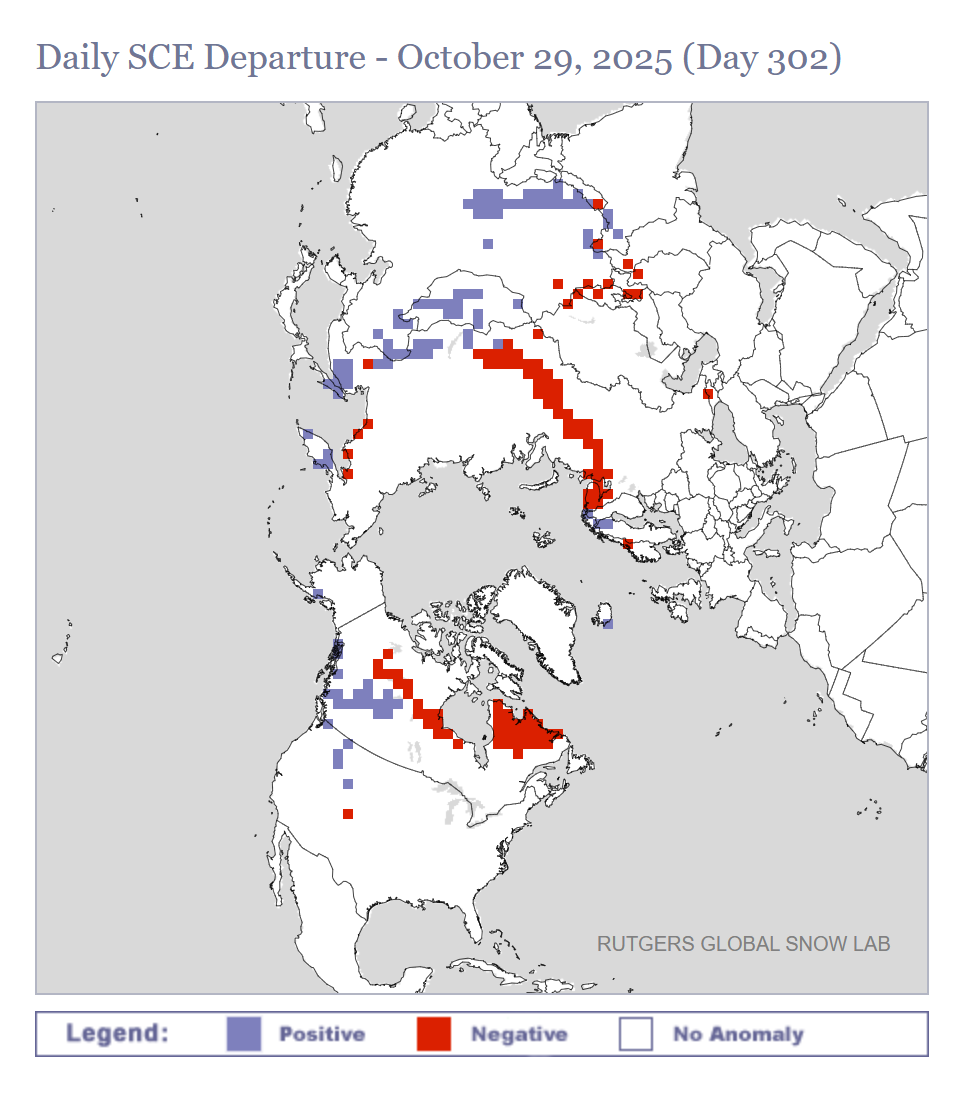
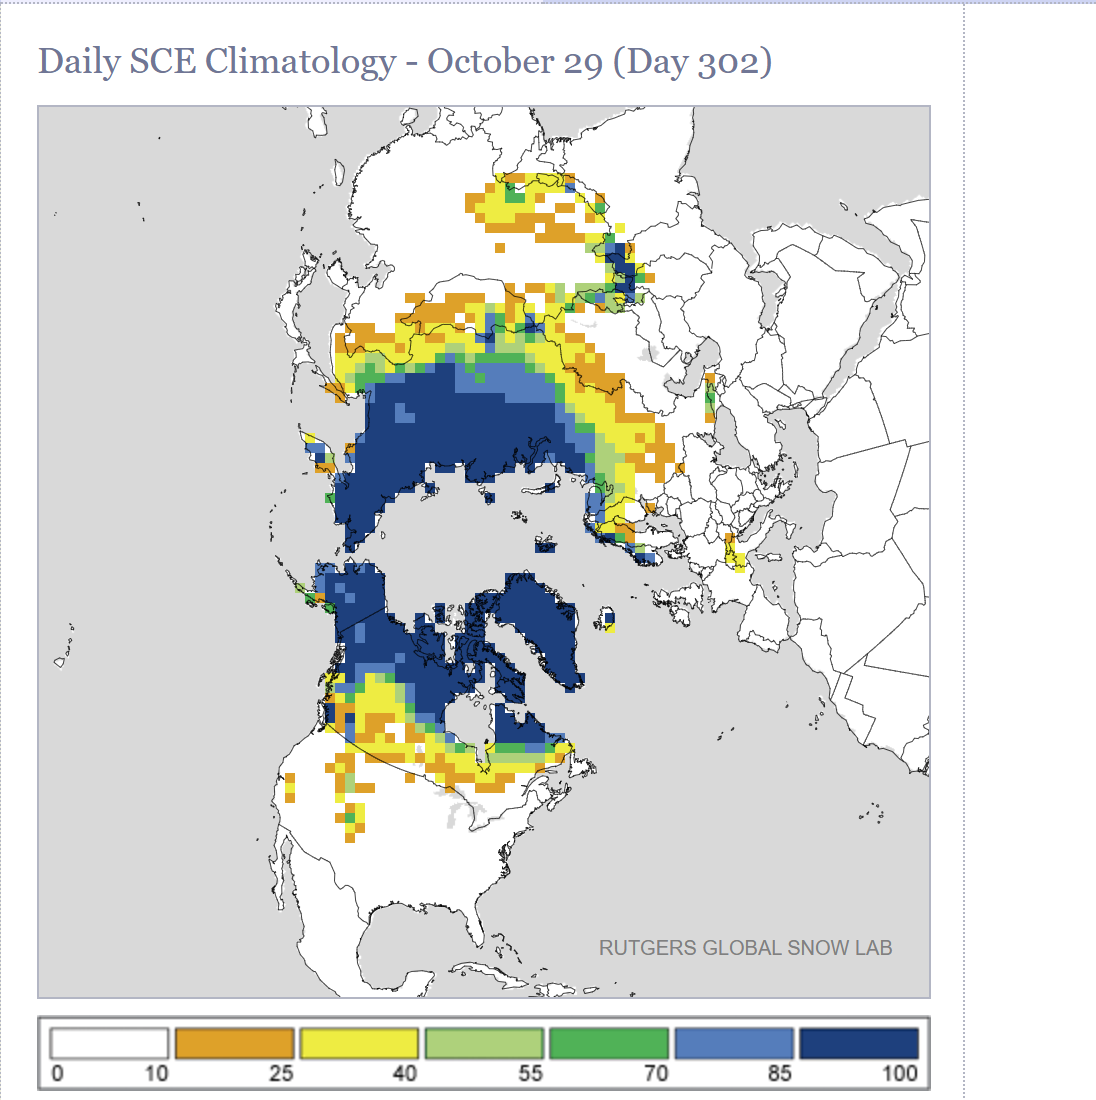
If you are going to show a snowfall coverage map you need to include the departure from average as well. Blocky but gets the point across. The first shows departures from climo and the second shows what climo should look like this time of year. Based on September 1970- August 2000. https://climate.rutgers.edu/snowcover/chart_daily.php?ui_year=2025&ui_day=302&ui_set=2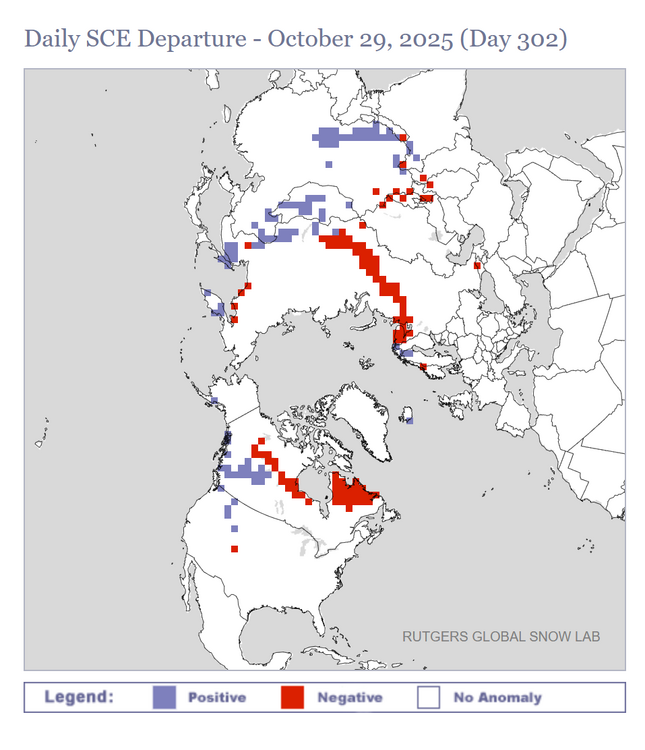
-
2025-2026 ENSO
so_whats_happening replied to 40/70 Benchmark's topic in Weather Forecasting and Discussion
Ehh he put words together to still make him relevant that is about all I got from it. -
2025-2026 ENSO
so_whats_happening replied to 40/70 Benchmark's topic in Weather Forecasting and Discussion
I still do not know why you guys focus so much on this guy. If you have issues with what he says call him out on the platform he is posting this information on. -
2025-2026 ENSO
so_whats_happening replied to 40/70 Benchmark's topic in Weather Forecasting and Discussion
Love the confidence but have my doubts To add according to the post by GAWX earlier the IOD normalized was positive in 1967 -
2025-2026 ENSO
so_whats_happening replied to 40/70 Benchmark's topic in Weather Forecasting and Discussion
I equate this IOD event to something similar like 2019/20 season. That IOD event was on par to some the most intense Nino events we have seen in the last ~30 years (1997/98, and 2015/16) yet when it came to oceanic temps we hit weak Nino status that year. If you look at the subsurface during this time you also had a downwelling kelvin wave in September and October making it look like we were about to really see this event go. I think the IOD in this case simply made it so the Nina like conditions stayed around just enough versus us pushing into weak Nino territory this year. I will say though subsurface on this event is deteriorating rather fast though there is a small chance we hit a trimonthly of about -0.6. -
2025-2026 ENSO
so_whats_happening replied to 40/70 Benchmark's topic in Weather Forecasting and Discussion
This is starting to get interesting though the 850mb wind anomalies are starting to show an impressive WWB event taking shape. This happened last year as well around late November early December where it effectively put a hold on the Nina growing and helped induce the EPAC warming along the equator with a secondary event taking shape at the beginning of February further enhancing the Nino state in the EPAC. Let us see if something similar is occurring though about a month in advance compared to last year. Here is the TAO data for the last month and a half.
.thumb.gif.c8eced48a66982ccd548ad20a11628ab.gif)
-
2025-2026 ENSO
so_whats_happening replied to 40/70 Benchmark's topic in Weather Forecasting and Discussion
This is just the wake from Priscilla not sure it really strengthens much beyond that. You can still see the wake from Neoguri from the middle to late September just east of Japan. -
2025-2026 ENSO
so_whats_happening replied to 40/70 Benchmark's topic in Weather Forecasting and Discussion
Fascinating! Really cool chart. -
2025-2026 ENSO
so_whats_happening replied to 40/70 Benchmark's topic in Weather Forecasting and Discussion
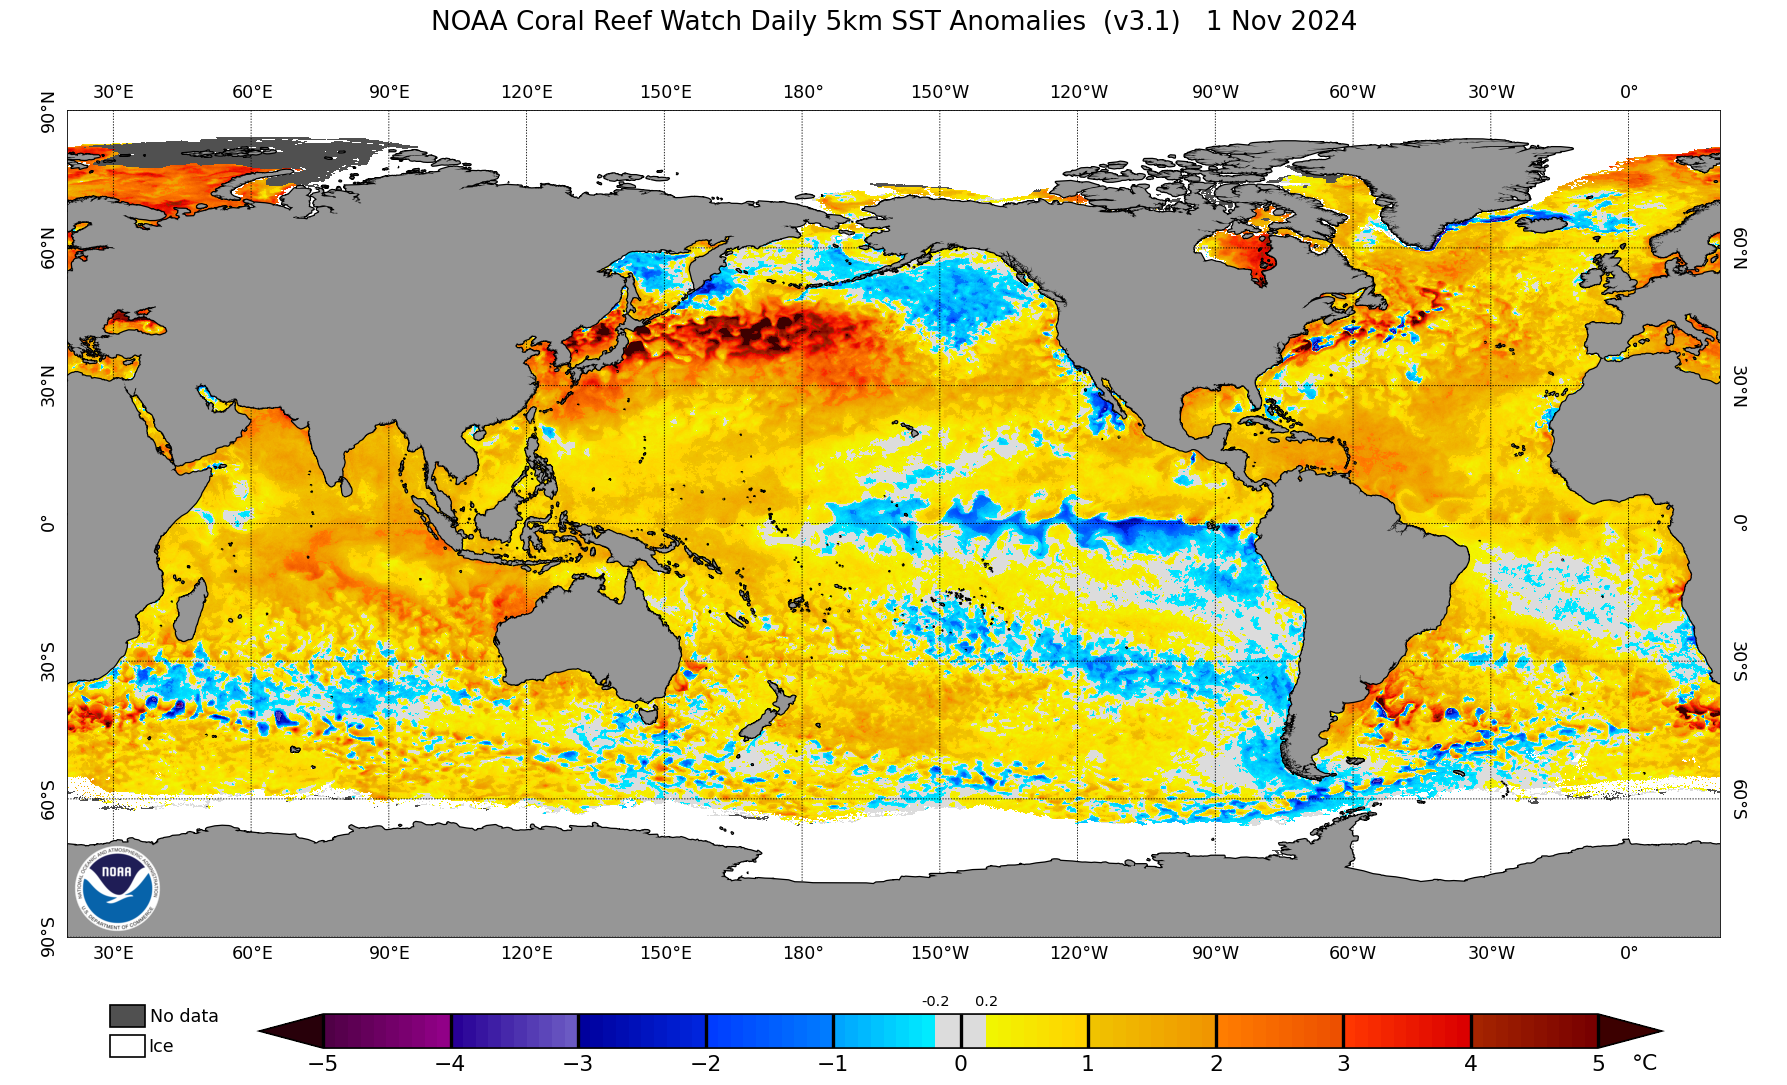
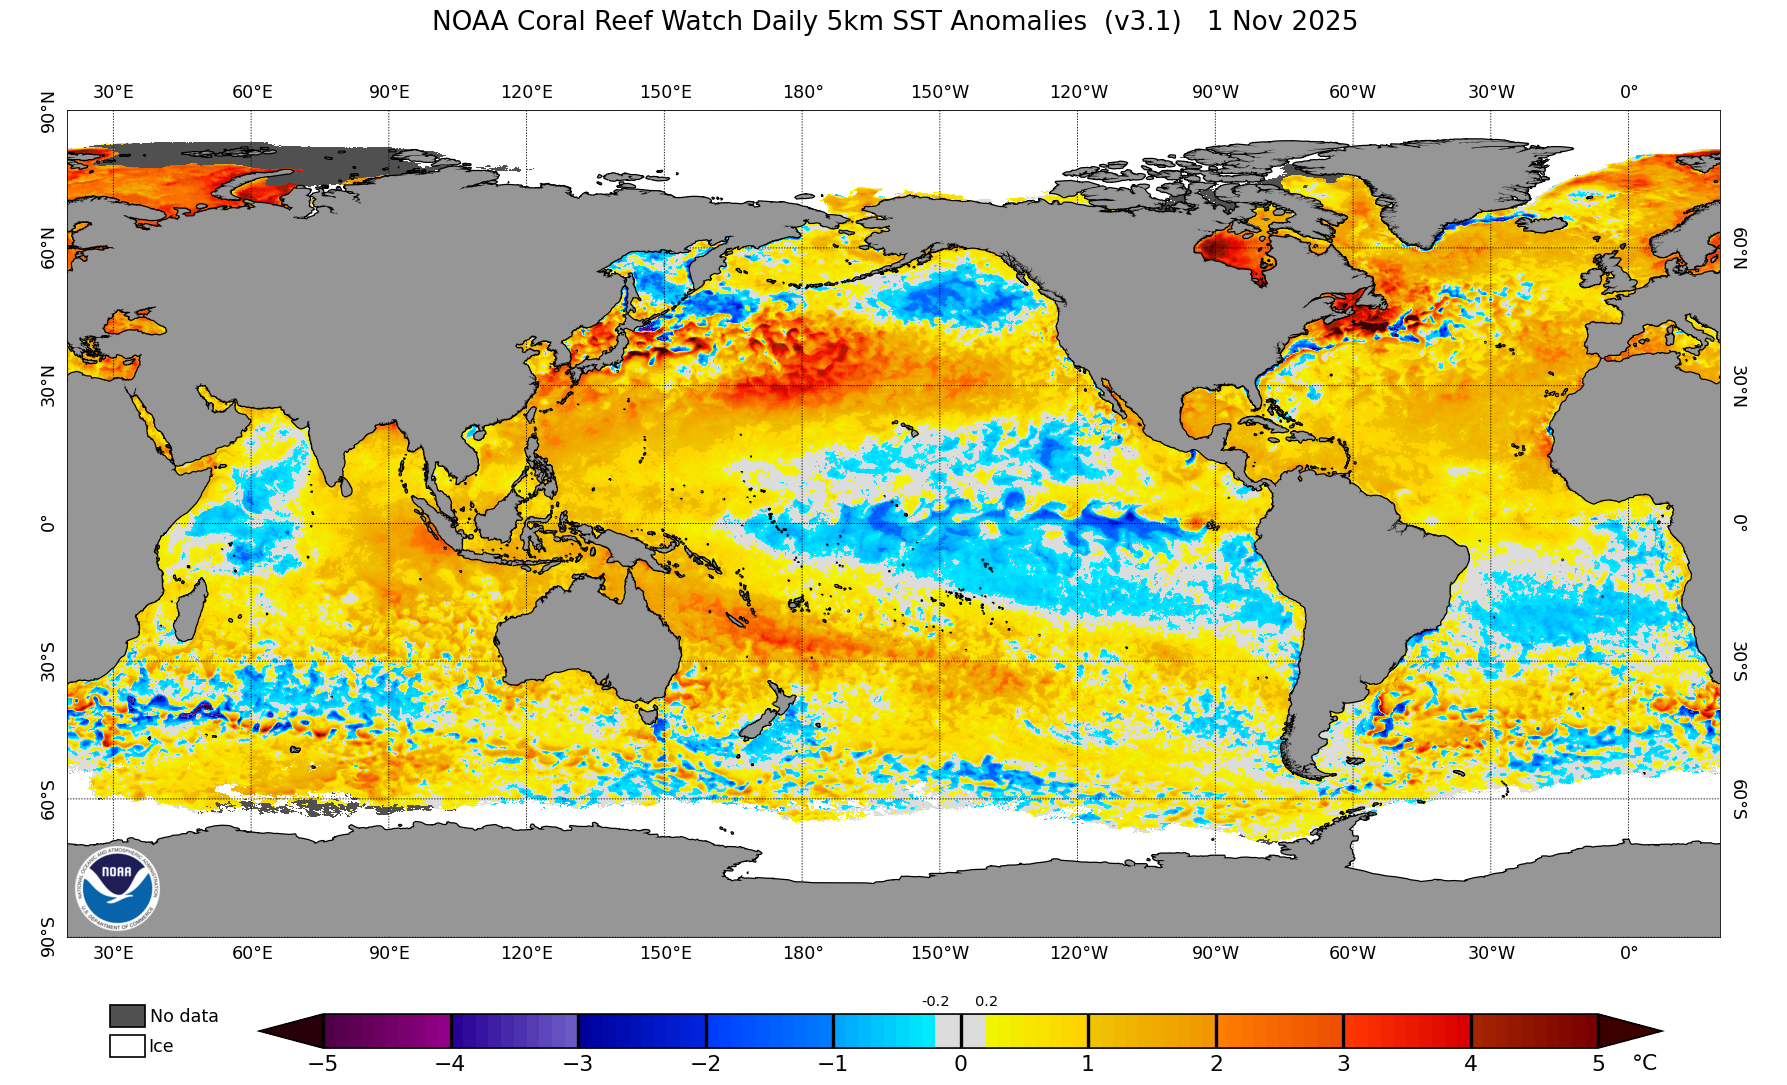
There is a fairly large system being modeled going into this weekend right over the warm pool region. I think there is forecasted 60-80knot winds already starting to show up across the area. Should definitely help continue carving out the cooler waters and moving that warm pool. As for the Atlantic there is still a decent NW Atlantic warm tongue around Nova Scotia so we should continue to see ridging potential in the region and add the risk of things at times connecting with the SE ridge. Im still rather hopeful that average snowfall can be achieved this year across many areas. RMM plots never fully grasp the intensity of such waves but regardless it should be pretty intense wave to start things off for fall. We are a little off where we were last year at this time for MJO but it looks to follow a similar path and intensity as we did through October last year. Here are the SST anomalies last year as we ended summer and went into fall. The PDO last year had a double dip take place and October values, at the time, were some of the lowest on record.
-
2025-2026 ENSO
so_whats_happening replied to 40/70 Benchmark's topic in Weather Forecasting and Discussion
It looks like the warm pool SW of the Aleutians may be on the move very similarly to how last year evolved. This should continue to push further east with time allowing the index for PDO to start to make a run to neutral status. If we do indeed start to push these waters further east toward the Gulf of Alaska it should allow for a weaker overall trough going into Canada then we have seen. The waters west of Japan into the Koreas and China is not dwindling any time soon but if the area further east does try to continue to cool it could play for a pretty impressive snow event or two as a giant lake effect event like they experienced a few years ago. https://psl.noaa.gov/map/clim/sst.anom.anim.week.html Also the MJO is finally on the move and actually becoming a wave versus the null action over the last 2 months. The enhanced trades are some of the furthest west we have seen in a long time this could very well continue to cool the waters at least around the eastern portion of the maritime continent as we go into late fall early winter. I would not be surprised to see one last system in the Caribbean for the month of October to close out the season as the MJO moves through 1-2-3.
-
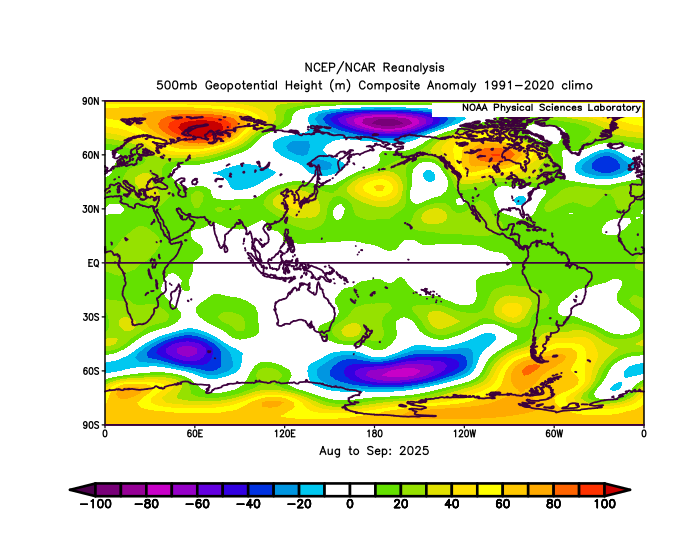
2025-2026 ENSO
so_whats_happening replied to 40/70 Benchmark's topic in Weather Forecasting and Discussion
Remarkably similar 2 month period with some probably pretty important differences.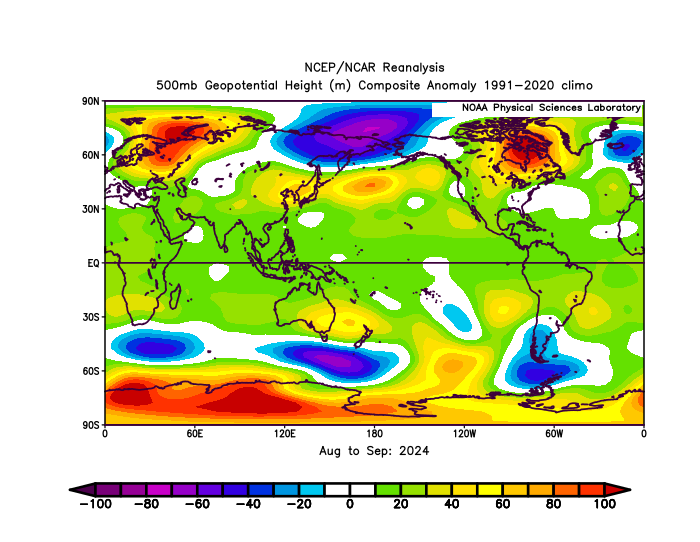
-
2025-2026 ENSO
so_whats_happening replied to 40/70 Benchmark's topic in Weather Forecasting and Discussion
Yea we will see what happens, I'm more so interested if this will actually show that negative anomaly being finally taken out. That feature has been present for a very long time even during the last Nino. -
2025-2026 ENSO
so_whats_happening replied to 40/70 Benchmark's topic in Weather Forecasting and Discussion
Just a quick update on the subsurface. Looks like it was a nice 'burp' in the ENSO state..thumb.gif.a4522f008cb7db8a202b01c7c761e876.gif)
-
As always thanks Roger. It is nice to see as a consensus we do pretty well!
-
Oh boy a few hours late sorry DCA _NYC _BOS _ ORD _ATL _IAH __ DEN _PHX _SEA +2 +2.3 +2.4 +3.5 +1.6 +2.1 +1.4 +1 +1.6
-
2025-2026 ENSO
so_whats_happening replied to 40/70 Benchmark's topic in Weather Forecasting and Discussion
Although it does look like the 850mb wind field may be trying to change up. Lets see how it plays out Last 90days and then the next 2 weeks potential.

-
2025-2026 ENSO
so_whats_happening replied to 40/70 Benchmark's topic in Weather Forecasting and Discussion
To me it just shows that forcing, namely maritime, is not ever omnipotent. Could it go back to being continuously 4-6 absolutely but currently regardless of what phase we seem to be globally open although weak in most locations, every single basin is firing off tropical activity right now. While it is something we don't see all that often and for this persistent I don't see it more than that. -
2025-2026 ENSO
so_whats_happening replied to 40/70 Benchmark's topic in Weather Forecasting and Discussion
We peaked earlier this year with the extreme -PDO so the runway is a little bit better.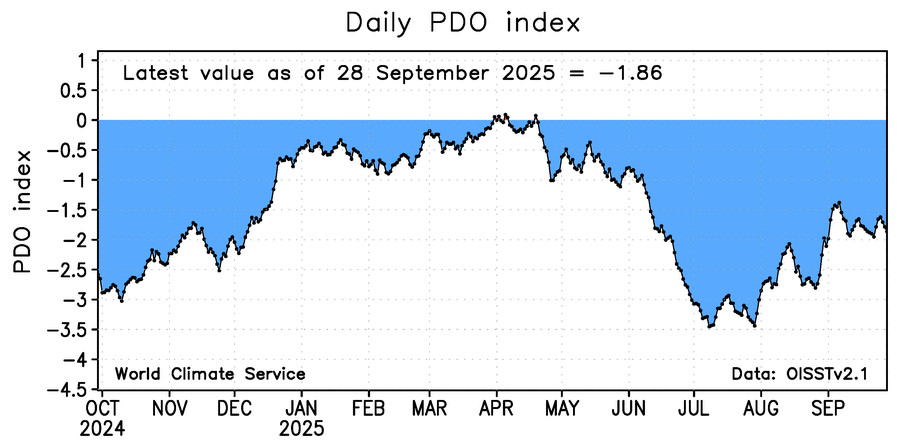
-
2025-2026 ENSO
so_whats_happening replied to 40/70 Benchmark's topic in Weather Forecasting and Discussion
When they get going they have become really nice storms this year. Erin, Gabrielle, and Humberto all have had amazing satellite imagery. -
2025-2026 ENSO
so_whats_happening replied to 40/70 Benchmark's topic in Weather Forecasting and Discussion
.thumb.gif.fb67b3bc1f0ba6f1ccc4eef60d7842a0.gif)
-
2025-2026 ENSO
so_whats_happening replied to 40/70 Benchmark's topic in Weather Forecasting and Discussion
I feel like there was a way but maybe that was a different forum I was on. So true though 100+ pages... im not going through that. CDAS almost looks representative to RONI output compared to OISST and CRW.


.gif.206d8ecf108c724a9deb59cb0526d45e.gif)


.gif.6a6a8541953af971c299b72c26fec6fb.gif)

.gif.175331d3b935c9014d5e48c621e5e4f4.gif)