

so_whats_happening
-
Posts
1,350 -
Joined
-
Last visited
Content Type
Profiles
Blogs
Forums
American Weather
Media Demo
Store
Gallery
Everything posted by so_whats_happening
-
2024-2025 La Nina
so_whats_happening replied to George001's topic in Weather Forecasting and Discussion
Even better yet to our current pattern here is 4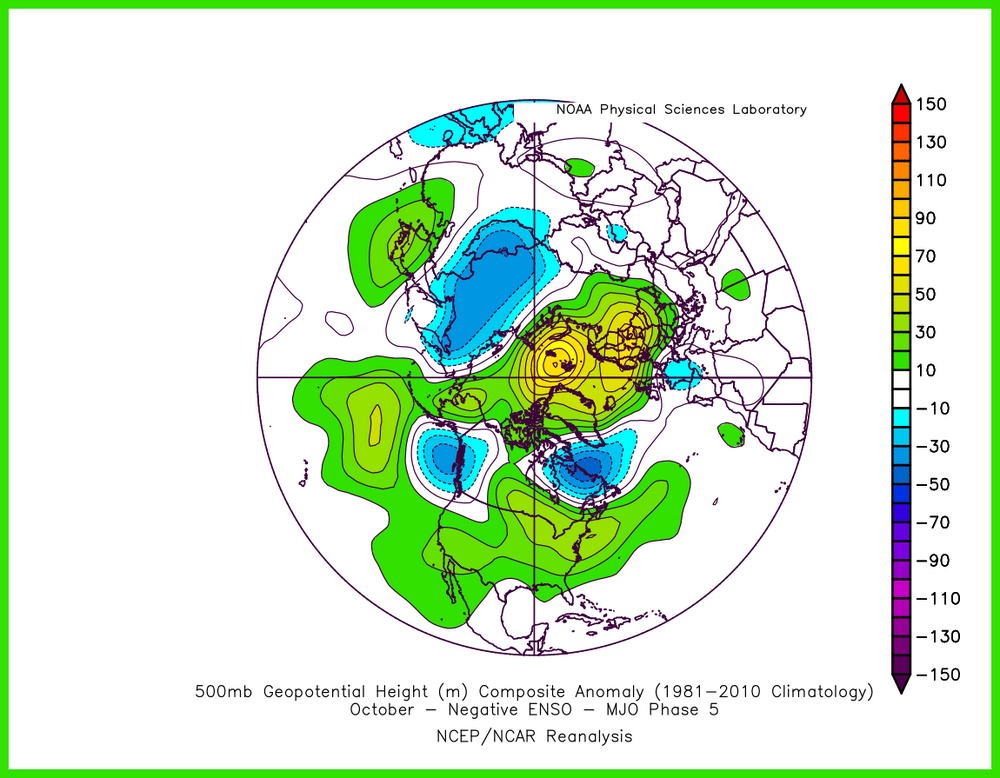

-
2024-2025 La Nina
so_whats_happening replied to George001's topic in Weather Forecasting and Discussion
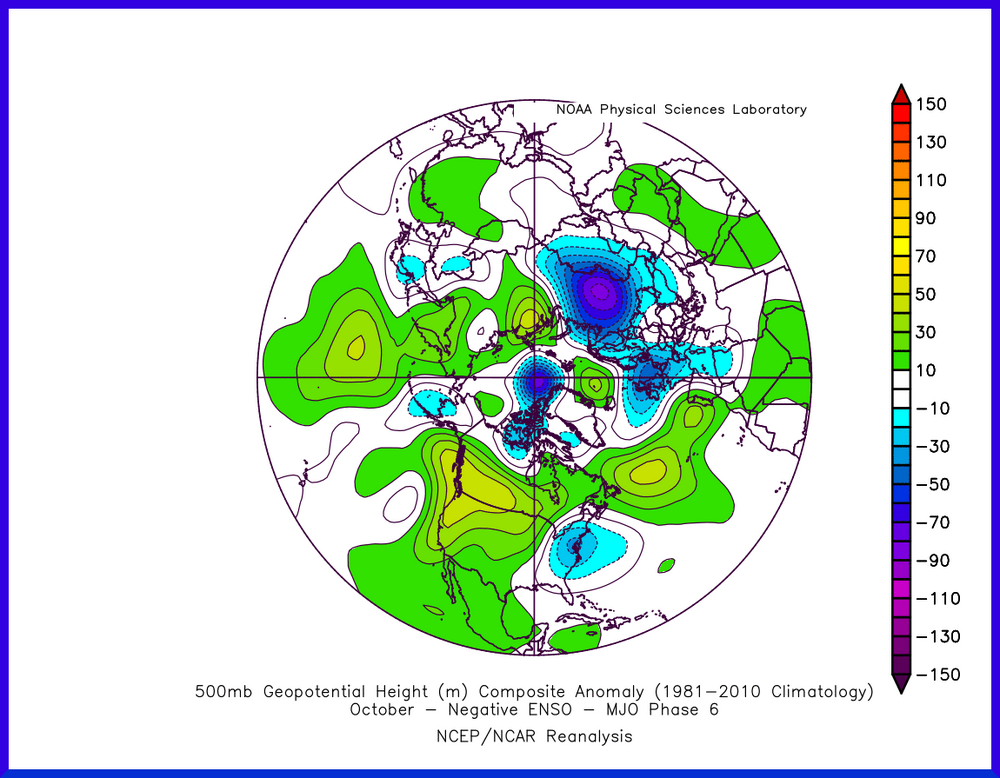
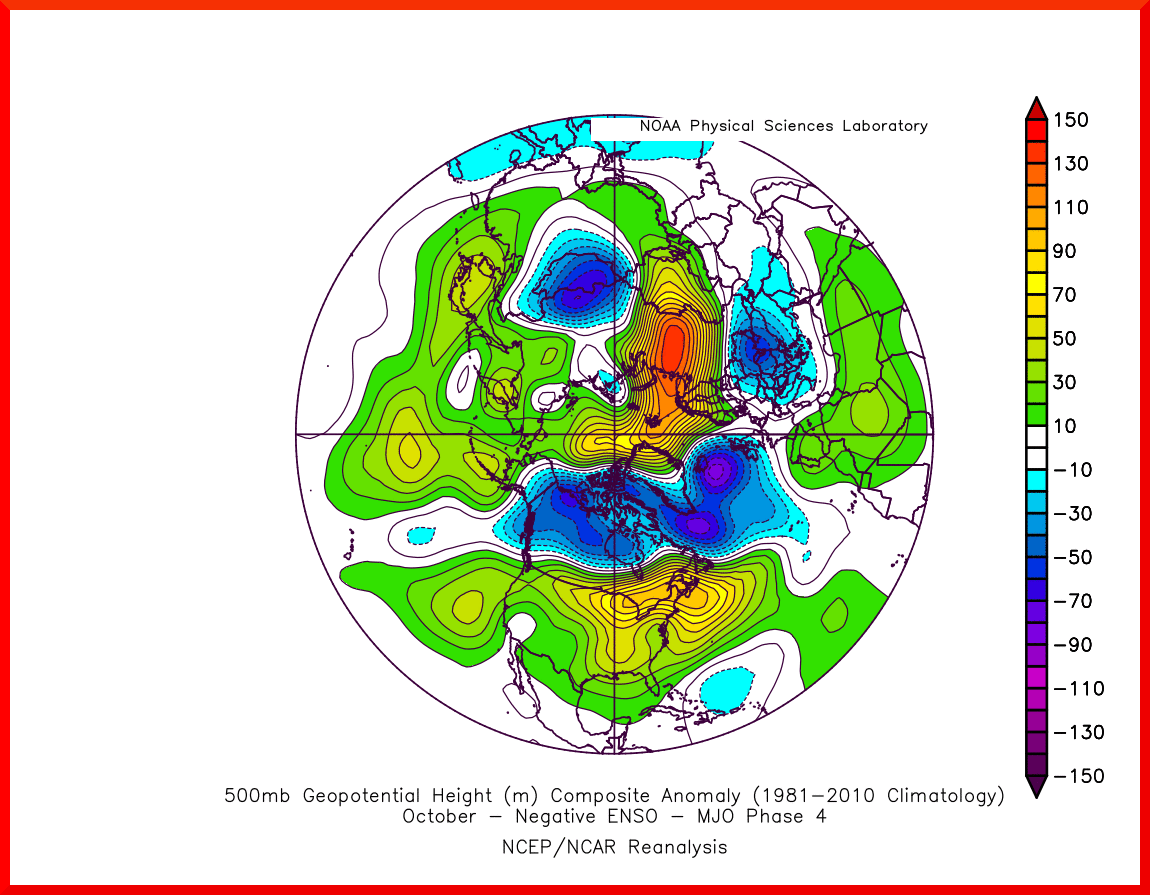
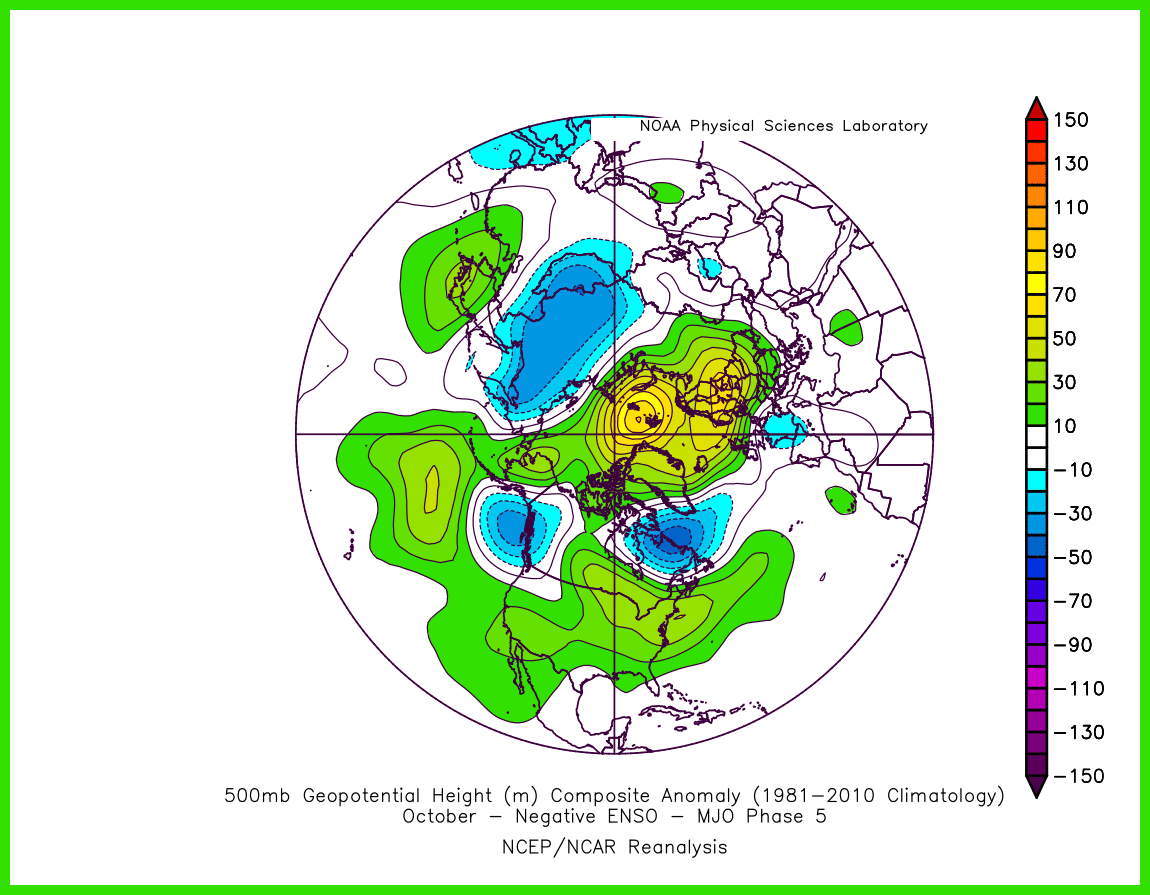
Most MJO forecasts barely put us in 8 by the end of the month and the effects won't be felt right away so I would expect that in mid latitudes for November. https://www.cpc.ncep.noaa.gov/products/precip/CWlink/MJO/CLIVAR/clivar_wh.shtml Here is 5 and 6 though, 5 seems to be the reasonable look we have for that time frame.
-
2024-2025 La Nina
so_whats_happening replied to George001's topic in Weather Forecasting and Discussion
I mean just looking at the SST patterns they look very similar in both time periods, right now we have warmer oceans so to compensate for the same -PDO signature and value we have higher anomalies than the surroundings just as you did back in the day. As for the 500mb pattern can't explain the difference but we could easily be in a constructive pattern versus a destructive pattern overall. Im sure the atmospheric warmth right now plays a role in allowing a more ridge like presence versus a trough like presence but im sure this flip flops so much it is hard to say this will be what the pattern should be. The biggest issue I have is we have seen these marine heatwaves before this is in fact what you are pointing out right now but what is to say that a -PDO should produce this atmospheric pattern. It may be more common for a pattern to occur during these strong phases of teleconnection but it does not necessarily mean that this will always be the resulting pattern. Im sure ill get lambasted for such a take. -
2024-2025 La Nina
so_whats_happening replied to George001's topic in Weather Forecasting and Discussion
April of 1859 and July of 1950 both tied at -3.65 if my eyes have not deceived me. This is the most negative block of PDO years we have seen since the early 1950's. If we continue on this path of -2.5 and below we could end the year as the most negative average PDO year on the ERSST records. As for your second point yea having the PDO this low late into the year typically means we have a continuation even if there ends up being a relaxation of the PDO values as we close out the year. -
2024-2025 La Nina
so_whats_happening replied to George001's topic in Weather Forecasting and Discussion
TAO finally brought back online the eastern portions of the subsurface (not sure for how long) you can see just how much of a difference this makes in the overall look. Much more inline now with the CPC look although the most upper portions of eastern Nino 3 are a bit off between the two. BTW some things are finally starting to be updated from NCEI. One in particular that went wild with this last update, PDO. Ill just leave the link below and folks can take a look at it when they get the chance. https://www.ncei.noaa.gov/pub/data/cmb/ersst/v5/index/ersst.v5.pdo.dat

-
2024-2025 La Nina
so_whats_happening replied to George001's topic in Weather Forecasting and Discussion
The bolded was probably the biggest factor this year maybe they go hand in hand? When we finally relaxed the VP pattern where it was globally showing more uplift versus being concentrated around Maritime Continent things went wild. You can see the brief breaks in VP that allowed the small portion of time where storms were able to form. I get where you are coming from with ITCZ shift but to me that just signals a storm that would have formed but have a better recurve potential versus one in lower latitudes of around 7-10N. I do ask is there evidence of this via wind anomalies now that we have passed that time frame that we did indeed shift the ITCZ further north? I would assume we would need to look at maybe 850mb for this observation but Tropical is not my forte.
-
2024-2025 La Nina
so_whats_happening replied to George001's topic in Weather Forecasting and Discussion
It is not far fetched to believe that if indeed we do see the -WPO periods that a -EPO happens in tandem, as for staying power I do not believe that will be the case but weirder things have happened. I think it is still a good idea to know that oddities do happen and that certainty this far out is anyone's guess. If the idea is true that atmospheric mode changes before oceanic temps do then one shouldn't get caught up in the here and now of current oceanic temps, just know that the pattern could easily revert back type of deal. Take a look at mid month for an example even with a strong -PDO and an Aleutian Low (though this is much further west in a more ideal spot) the resulting pattern in the east is one that folks would love if this happened closer to winter time. Just stuff to keep in mind as we have seen extremely harsh conditions over the east over the last few years, it is nice to see some breaks in the persistence department. -
2024-2025 La Nina
so_whats_happening replied to George001's topic in Weather Forecasting and Discussion
I think we see a lot of back and forth with the WPO this year. I believe this is what raindance was trying to articulate before he left. While yes the -PDO state will still have a strong influence I could see us overall near neutral in the WPO department with some periods of pronounced + and - WPO patterns mixed around. I don't believe as of now we see a steady state of +WPO this winter. As always this could change but if the constant back and forth we are seeing now is an indication ill take it. -
2024-2025 La Nina
so_whats_happening replied to George001's topic in Weather Forecasting and Discussion
Nice I agree as well overall though I do expect the mean trough to probably be a little further west and probably the Aleutian Ridge but as you state timing is and always will be everything. We have come rather close with several storms over the past couple years but timing was just off or the cold retreated just too quickly. I will say it will be interesting to watch the NAO state as we get further into Fall and early Winter. For some reason we have flipped that switch and we could just as easily flip it back so that may be a bit of a wild card. I do believe we continue to see the slow demise of the -PDO state. It ain't flipping this year but a gradual push to neutral is something that has been on my mind for a bit. While the atmospheric pattern still tries to revert back to the ridge around Japan it seems to only have flairs right now of that state which could serve us opportunity, as expected with timing of course. Also good luck with the job search it is really difficult right now to get into the field, very competitive. With one maybe two spots open at NWS offices and nearly 20-30 applicants it is tough to stand out. I presume you are trying the NWS route. Luckily I have the weather observer job currently so I get minimal experience under my belt and look like a little bit of an oddball when applying to locations, but seriously though best of luck to you. -
2024-2025 La Nina
so_whats_happening replied to George001's topic in Weather Forecasting and Discussion
Most products will have late updates due to the NCEI issue from Helene. -
2024-2025 La Nina
so_whats_happening replied to George001's topic in Weather Forecasting and Discussion
Nah we are going to be waiting a bit on data due to the NCEI issues from Helene, not sure when things will be back up and running. -
2024-2025 La Nina
so_whats_happening replied to George001's topic in Weather Forecasting and Discussion
Maybe for the bolded but this is about when we typically start to see the seasonal change enough to end the season. Still could be a random storm that pops up in the Caribbean but nothing on the horizon as we go toward mid month and further. I like to think solar does still have some important impacts into patterns but I think of it as a bit of a lagged component in that this spike will show up later on in our sensible weather. -
2024-2025 La Nina
so_whats_happening replied to George001's topic in Weather Forecasting and Discussion
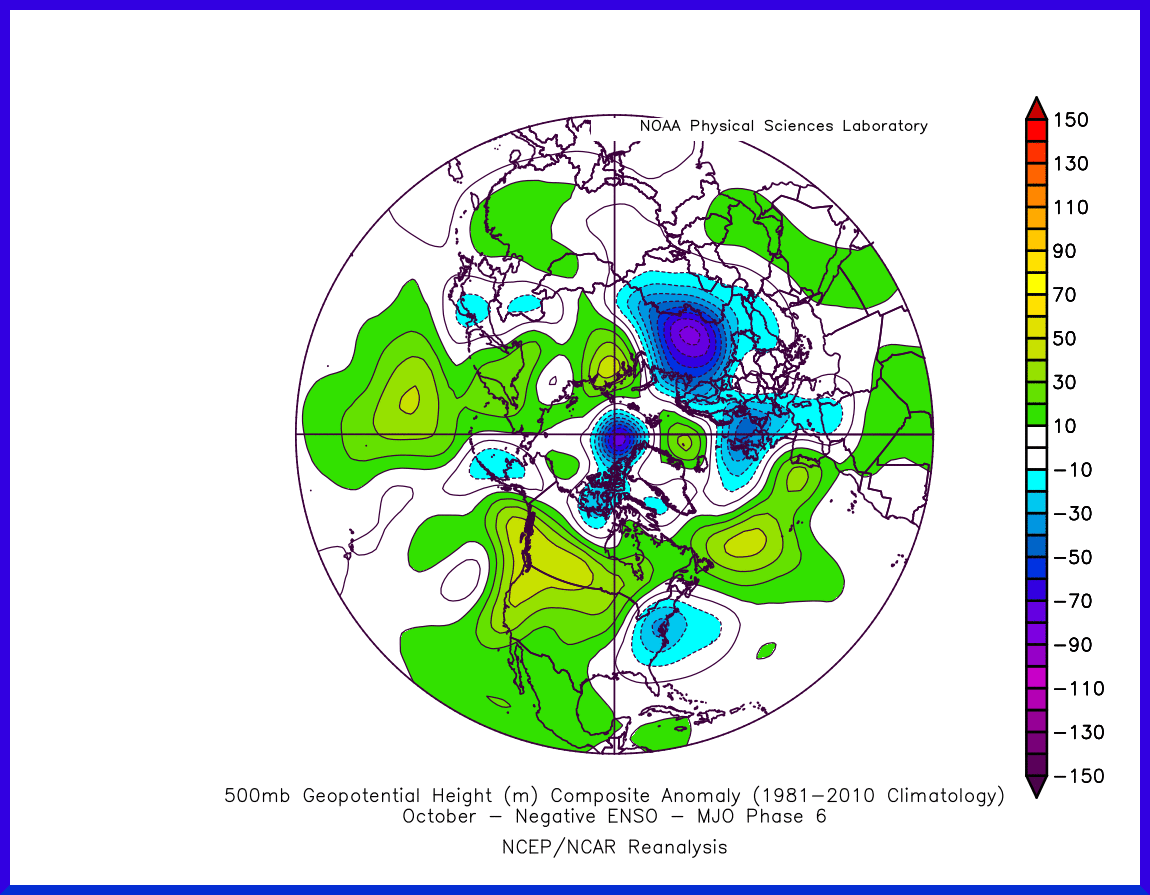
We are just about at what used to be the seasonal average (1950-2000) for ACE at about 90 ish. The ACE of 1991-2020 climo era is what used to be considered a hyperactive season which is now the average. Anyways we are right at average for total storm/ hurricanes/ major hurricanes for the season. It looks as though we get maybe one more named system but we should trail off the season near the time it typically does. Kirk and Leslie alone should be able to pick up enough ACE to put us right near the 1991-2020 climo ACE. As for other areas the strong WWB event in the Indian Ocean looks to spark a cyclone for that region and maybe 1 more solid typhoon in the WPAC before things globally calm down a bit. Most models still have what looks like a solid 5/6 pass for the MJO coming up around mid month. We should also start to see the -NAO relax quite a bit going forward as well but that western ridge may mean business again as we get to mid month. Here is a look at what the pattern could entail based off an MJO Nina passage through 5/6. I started using the Nina base instead of La Nada as we are right on the edge of La Nina status versus over the summer where were virtually neutral. Nothing too exciting on the horizon which is probably for the best after Helene, most could use a solid dry period. Im excited to get some nice diurnal swings and maybe get a solid kick start into leaf changing season. Ill update some of the Oceanic components sometime next week.

-
2024-2025 La Nina
so_whats_happening replied to George001's topic in Weather Forecasting and Discussion
Yep was reading about the other day. PSL products are also being affected. Hope they can get everything situated relatively quick. -
2024-2025 La Nina
so_whats_happening replied to George001's topic in Weather Forecasting and Discussion
The OISST has not updated in 5 days. -
DCA _ NYC _ BOS __ ORD _ ATL _ IAH __ DEN _ PHX _ SEA +.6 +.6 +.8 +1.5 +.8 +1 +2.1 +2.6 +1.4 I feel like I wanna go warmer on ORD and in the west but Ill hold off.
-
2024-2025 La Nina
so_whats_happening replied to George001's topic in Weather Forecasting and Discussion
As for Tropical activity there may be two systems in the next week, the wave in the Atlantic looks really nice right now which should be the main show. Still early overall but it looks like a recurve as of now is the likely and at least a Hurricane. Most models have some type of recurve and moderate strength. Then another little system in the gulf may develop into a named system probably wont get much past that. Of course looking forward it looks as though the Atlantic will be weakly open for business if a nice wave can come off the African coast but Caribbean and Gulf may be shut off for a bit. We get a push back into weak 4/5/6 probably close to mid month as we go into null by next weekend with the easterlies picking up and a little VP push. I mean it really sucks to see runs like the 00z Euro North America view and we are only in October. It gives me hope but feel I need to dial that back in a bit unfortunately..thumb.gif.143238ff5e9ef0f004b015c0f3b06d23.gif)
-
2024-2025 La Nina
so_whats_happening replied to George001's topic in Weather Forecasting and Discussion
This storm was very much how Michael developed 6 years ago and had such a better opportunity to go all out then Debby did due to track, If Debby had a little less land interaction initially like Helene did it could have done similar. This was the Satellite loop for Debby when it got the opportunity to get going into the Gulf. https://rammb-data.cira.colostate.edu/tc_realtime/loop.asp?product=4kmirimg&storm_identifier=al042024&starting_image=2024al04_4kmirimg_202408021340.gif&ending_image=2024al04_4kmirimg_202408051806.gif Ernesto did pretty well but came up just short too for a major hurricane, surprisingly VP was not good for a phase 1 passage. So location of the storm being east of the warmest regions limited the overall strength with that system. Here is the VP of Debby, Ernesto, and Helene. The VP overall this summer has been against us from opening the Atlantic up fully but these weak breaks in the overall positive VP setup from 7/1- 8/31 have yielded several storms.
-
2024-2025 La Nina
so_whats_happening replied to George001's topic in Weather Forecasting and Discussion
These waters do not warm this time of year, rather they tend to just not cool off as much. I do find it interesting to see the anomalies start the uptick though in Bering sea and sea of Okhotsk. Will have to keep a monitor on how this goes in the coming month or so. -
Definitely been a concern of mine. It looks as though it finally was able to kick out most of the dry air and may need only a 6 hour window coming up of convection wrapping around fully and then it takes off... We are within about 1 day of landfall and the time from now until it peaks is crucial. If it happens quick there is still a small chance of it but maybe not enough if it happens around daytime and throughout the day tomorrow not gonna be pretty.
-
2024-2025 La Nina
so_whats_happening replied to George001's topic in Weather Forecasting and Discussion
.thumb.gif.3d37864f6432d8ab3c3d6f16ac772492.gif)
-
Arctic Sea Ice Extent, Area, and Volume
so_whats_happening replied to ORH_wxman's topic in Climate Change
It looks like we have just about hit the bottom for extent and area has started to see a nice uptick since the beginning of the month. Probably have a some refreezing happening in the next week start to show up? It is possible this waits until the beginning of October to start the process. Lotta warmth still running around. -
2024-2025 La Nina
so_whats_happening replied to George001's topic in Weather Forecasting and Discussion
Honestly I still like this look for an overall guess to the winter. I would expect the warmth in the south to be a bit more bulbous with an episode or two of SE Ridge flaring up and a dislodged -NAO. Again as much as I would like a pure -NAO winter season it doesn't seem very likely. Temps would likely be about 1-2C warmer but the general idea is there.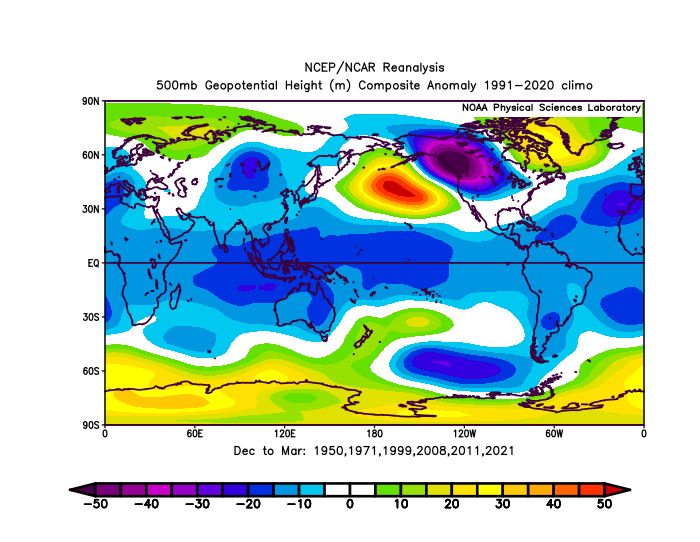

-
2024-2025 La Nina
so_whats_happening replied to George001's topic in Weather Forecasting and Discussion
This is the first time in about 6 years we have had a +NAO summer. Most have been neutral for a month and mostly negative overall. The last time we had a positive NAO summer was 2017 and 2018 and before that 2013. Folks draw whatever they want from that sample set but notably 2013 was the only other one in the last 15 or so years that has had high solar as well as a +QBO pattern to boot. Im sure ill get the usual commentary of the SST patterns were entirely different. I get it not everything will be perfect as much as I would love it to be (would make things a hell of a lot easier). -
2024-2025 La Nina
so_whats_happening replied to George001's topic in Weather Forecasting and Discussion
The lowest monthly ever recorded was actually April of 1859 and July of 1950 where we bottomed out at -3.65 for a monthly value but at that point we are looking rather far into the past and the symmetry of pattern evolution may not be there. My guess for this year is we get the continuum of central plains/ front range cold dumps. With having a SE Ridge pop up from time to time but as of now nothing in the extreme department from my perspective. Definitely feels like a relaxation for this intense east coast warmth during winter but still averaging above average for the season overall (just not +6 maybe more like +1 to+2). Ill gladly take something else for a change but persistence has been great so far this year, so far last month and so far September have been the only bigger anomalies this year for temps in the east.


.gif.4c5639067e24847b4cf330f7478dcdfe.gif)
.gif.cd637abcbf0c5ac844a2c5c805c01ea6.gif)