so_whats_happening
-
Posts
1,483 -
Joined
-
Last visited
Content Type
Profiles
Blogs
Forums
American Weather
Media Demo
Store
Gallery
Everything posted by so_whats_happening
-
2024-2025 La Nina
so_whats_happening replied to George001's topic in Weather Forecasting and Discussion
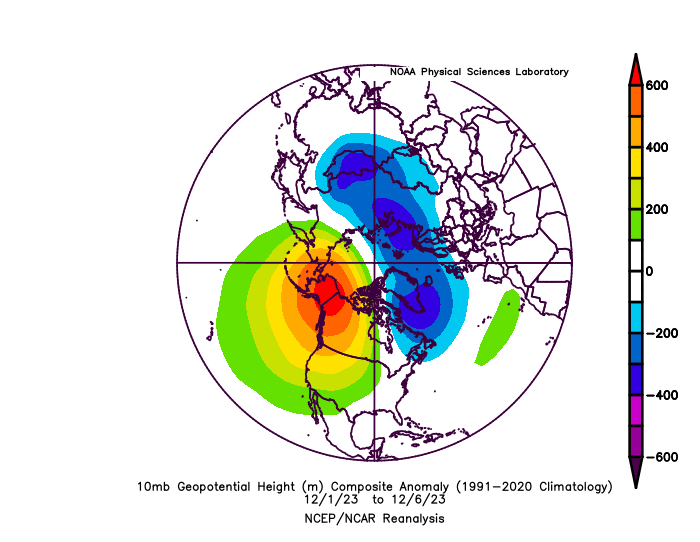
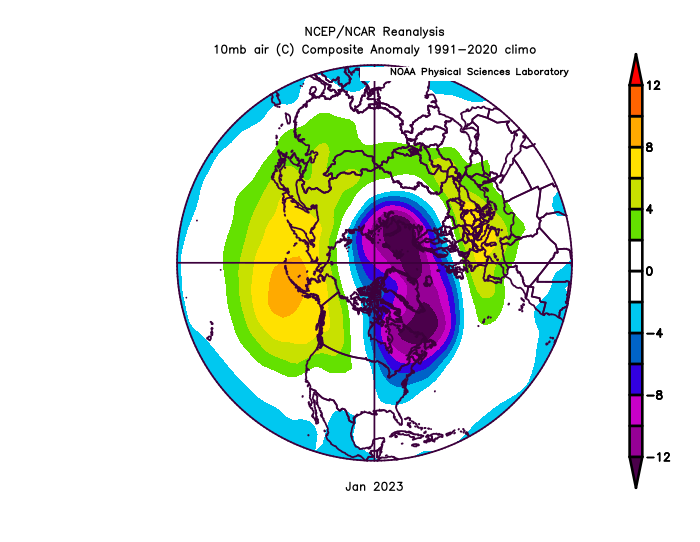
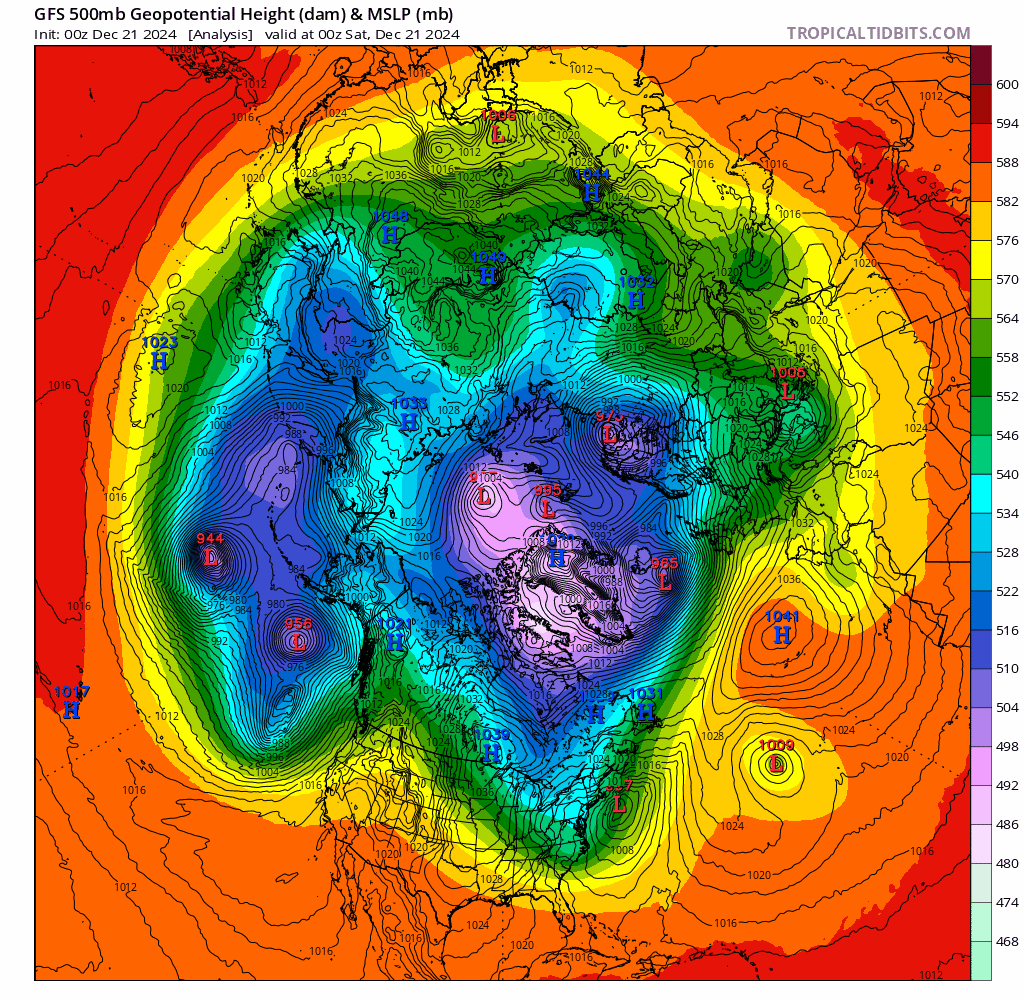
Depends on what type of SSW takes hold and what pattern should evolve from this event. If we get a solid wave 2 potential that shows up it could reshuffle the pattern in our favor a lot better than a large wave 1 response like we saw last year. Of course a wave 2 response doesn't always mean ridge west/trough east. The propensity of the atmospheric pattern to not fully revert back to the constant deep -PNA has been a nice change-up for this year even with a La Nina starting to actually build properly. The SSW (which this one I actually consider significant) that came in the beginning of January 2024 I think just linked up in the wrong spot for us. We had a fairly strong 500mb ridge in SE Canada already in place leading into that strong wave 1 response so it locked the pattern up rather quickly and we just could not shake it we also did not see the breakdown of the SPV fully so once the warming was done it started to gather itself together again. Talk about unlucky. Now if we get significant wave 1 or wave 2 (preferably) with an atmospheric pattern of ridging into Alaska and retracted Pacific jet like we have been seeing off an on I wonder if the results would be different, I mean they should just not sure how it would translate yet. https://acd-ext.gsfc.nasa.gov/Data_services/met/metdata/annual/merra2/flux/vtn_10_2024_merra2.pdf https://acd-ext.gsfc.nasa.gov/Data_services/met/metdata/annual/merra2/temp/t60_90n_10_2024_merra2.pdf We had a heat flux but not a significant stratospheric warming event that took place. It was at best a displacement event that happened to work a little bit in our favor instead of roasting us like what typically happens in a Wave 1 response. I don't want to discredit that it was a stratospheric warming event but it was nothing noteworthy. Maybe it was because the SPV was already well established and strong that we didn't see a significant rise in temperature other than to near average? This warming event we just had helped relax the SPV and bring it back to what is typically average for this time of year so any further attacks will start to impede in the strength much more, if we do see these attacks come to fruition. As for the snow/cold possibilities that come along with it I think the important thing would be to have much more wave 2 response, this means help not only from the Alaska region (which is the typical location of the 10mb ridge) but also over northern Europe. We need poleward flux/ wavebreak events (negative tilted troughing leading to large blocking highs) to happen and that seems to only be on the Pacific side right now, the Atlantic has been having more equatorward wavebreak events which still helps to keep the SPV intact. We had a very strong wave 1 response last year that gave us a blip of winter weather hopefully it is not a wash rinse repeat scenario. This was last years wave 1 response compared to this years (seen above). Of course the SPV was a bit weaker last year so it helped to rock the boat a bit more compared to this year. Angle of attack is also extremely important as to the proper effects into the mid latitude maybe because the Pacific jet was a bit stronger due to a deep -PDO state that was not changing caused it to have a different location for the atmospheric ridging location? May be something worth looking into down the road.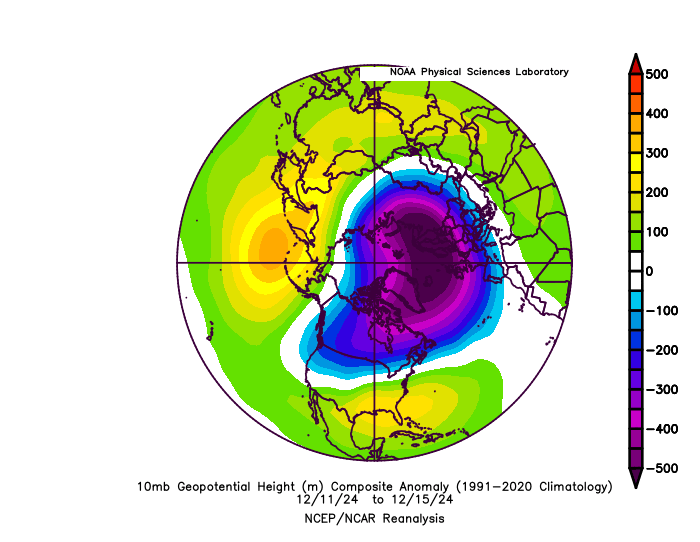
-
Nice call on the warmer DEN call Stormchaserchuck. Also didn't expect that IAH would get quite as warm as it has been.
-
2024-2025 La Nina
so_whats_happening replied to George001's topic in Weather Forecasting and Discussion
This is a big thing in question right now the only thing that could truly disrupt that potential is a Major SSW event which interestingly enough is starting to show some signs at hour 240 (about first week of January onward) of something trying to develop. Now I would like to see a few more runs as we get into the new year and continue showing this. As for the pattern this has been the strongest 850mb wind response so far this event from mid November to mid December. The last was back at the end of summer (end of August/early September) with the enhanced trades. This was when we saw our first Nina like response show up where we went from warm neutral into cool neutral. This should start to level off and create another small rise in 3.4 SST coming up over the next 2-3 weeks before things potentially restart with stronger trades around mid January? A trimonthly of below -.5 may be hard to come by again depending on how things evolve the next month. This monthly should come in around -.7 ish maybe -.8. If we get January to cooperate in the same manner we can hit that -.5 threshold for a trimonthly just barely pushing the Nina status (not officially since we won't have 5 months most likely) but the effects of this should be enough to allow the atmosphere to respond. If we continue to cool into January and February we definitely start to run the risk of it being officially being labeled La Nina via CPC standards I'm not sure of this yet. We could potentially be setting ourselves up for another string of Ninas as several years have had Nina-like conditions before a Nino spike and going back to Nina the following years. It is fairly odd to get this type of push this late in the typical ENSO timeframe but seemingly not too unheard of as several seasons did have a late peak of NDJ and even DJF. This season has definitely thrown some curveballs so far and I'm not sure we are done with those surprises. -
2024-2025 La Nina
so_whats_happening replied to George001's topic in Weather Forecasting and Discussion
https://psl.noaa.gov/map/clim/sst.anom.anim.week.html If we continue with a pattern of hurricane force after hurricane force winds over the warm pool it will continue to spread out. I do not see a flip yet maybe for next winter? The 12z Euro showed if we have a pattern that continues like this fun could be abound. -
2024-2025 La Nina
so_whats_happening replied to George001's topic in Weather Forecasting and Discussion
The models have come around to some minor wave 2 pressure on the SPV over the last 5 days so we get some disruption and probably a flattening out of the SPV strength coming up here. What happens after that will be interesting Euro has a solid wave break over the Atlantic after this one setting up over Europe this week. So while it is technically an equatorward wave break which tends to help with some strengthening there was an attack on both sides of the SPV at the same time which will help put a squeeze. Now what comes of this will be important if we keep seeing the weakening of Gulf of Alaska style vortex and more ridging we can get this to connect from 500mb up. This will really start to put pressure on the SPV especially with Alaskan ridging and extension into the poles showing up into the new year. I don't like to look past 240 typically but some fun stuff showing up. This was last nights 00z Euro op run I mention the EPS wasn't terribly off the idea out to 240 it at least had the Alaskan polar ridging setup showing up just not the Atlantic wave break (this one more poleward) following so not as much pressure on the SPV as the GFS is trying. Here is a look at the GFS run for 00z op. Just remember that operational will be a bit erratic but it is nice it does have some backup with the ensembles showing up. A progressive cool down does seem reasonable if we continue to get ridging into Alaska and some of the poles into the 5-9th period through the country, sustainability of these patterns still is a concern but we can cross that bridge in time. A lot of that sustainability will be of course help from Tropical forcing if we can still manage some semblance of 7/8/1 passage of the MJO just do not want to see a crash to COD and a pop back out around 2/3. Should really get some answers this week. BTW managed just slightly under an inch of snowfall last night from the transfer and remaining upper level low and may get in on some snow squall action. Nice little blip of winter weather right now.

.thumb.gif.418507c981b3f0dd74ddff1572f76346.gif)
-
2024-2025 La Nina
so_whats_happening replied to George001's topic in Weather Forecasting and Discussion
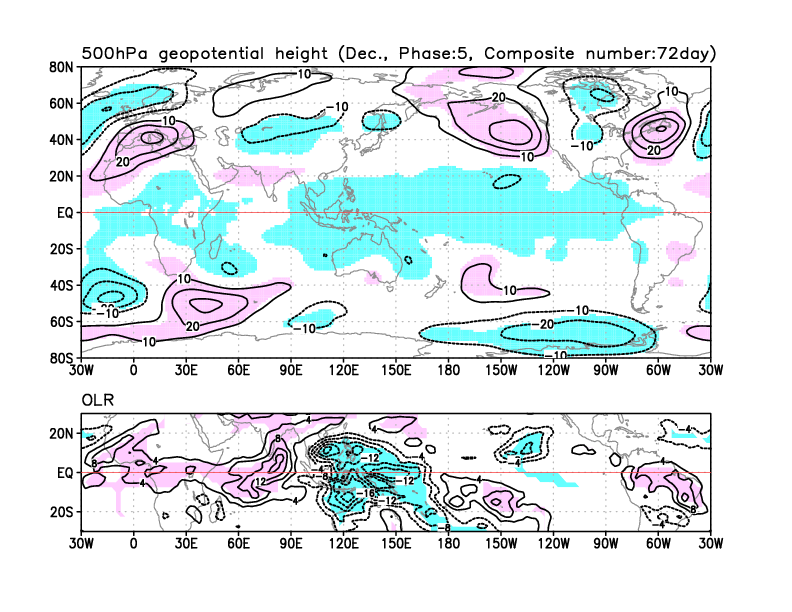
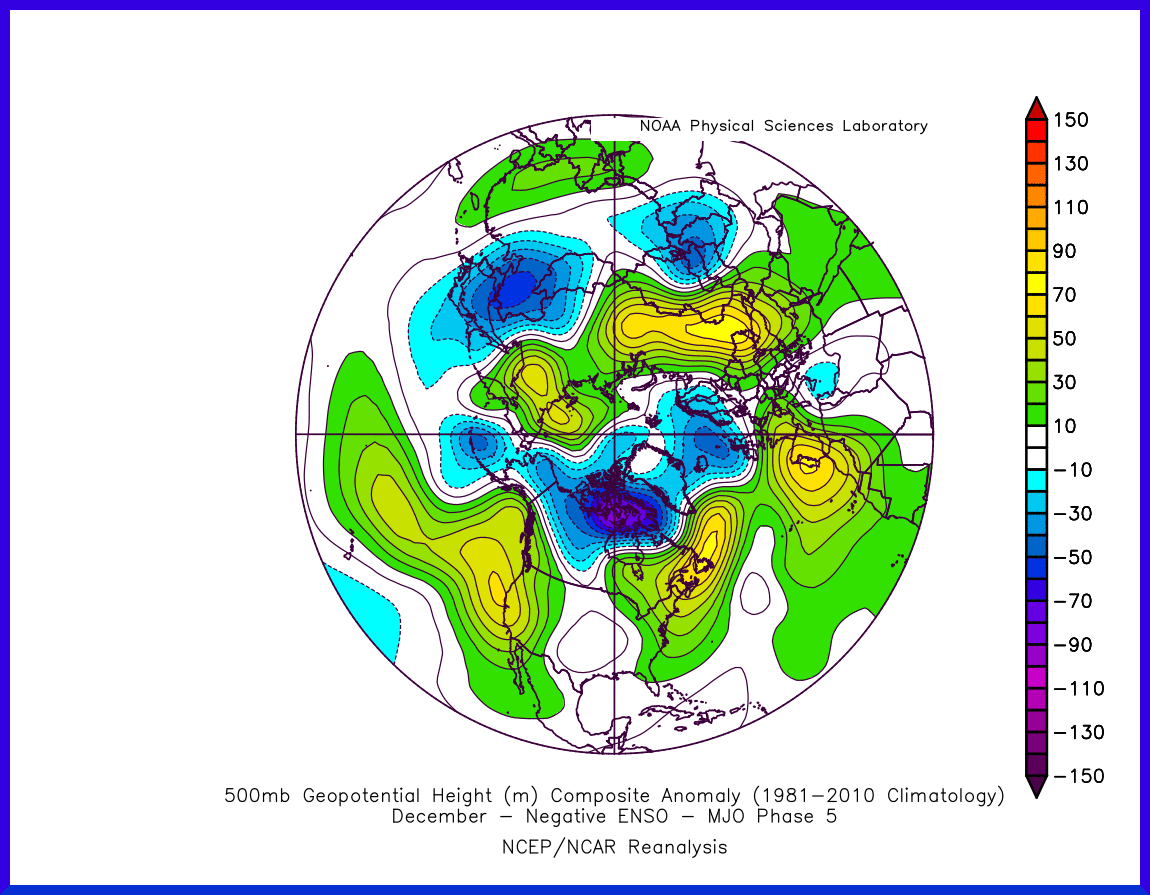
How it gets there not exact but surprisingly GEFS, ECMWF, and JMA all in rather good agreement. I do hope we don't have a high amplitude 7 and then quick to the COD becoming a weak 3/4 and repeating like we have had in recent years, that just leads to cold unleashing through the central plains. With the minor Westerly anomaly showing up into the new year this will start to look like a modoki La Nina with another warming of eastern 3 and 1+2 so it may throw us a bone if we can hold amplitude into 8/1 with that type of setup. My fingers are crossed! Of note the MJO has been crawling almost 2 weeks in phase 5 pretty solid phase 5 look in the northern hemisphere. As Bluewave has mentioned the jet extension is a bit more than we typically would see under this pattern thus you can see the shift of reality to what would typically occur.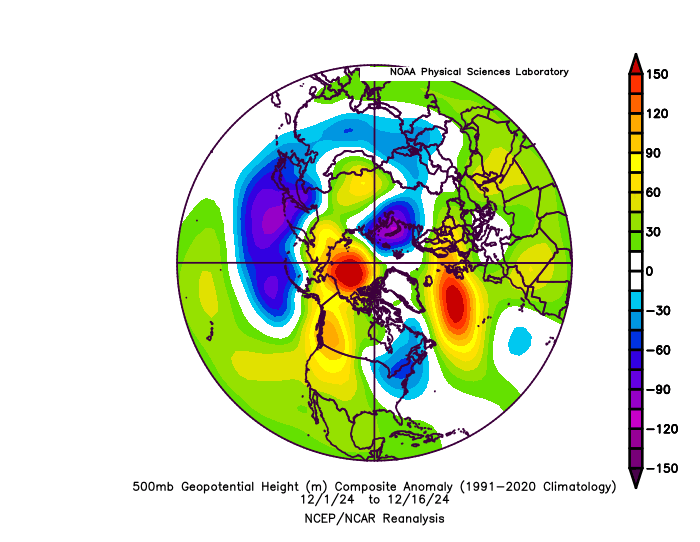

-
2024-2025 La Nina
so_whats_happening replied to George001's topic in Weather Forecasting and Discussion
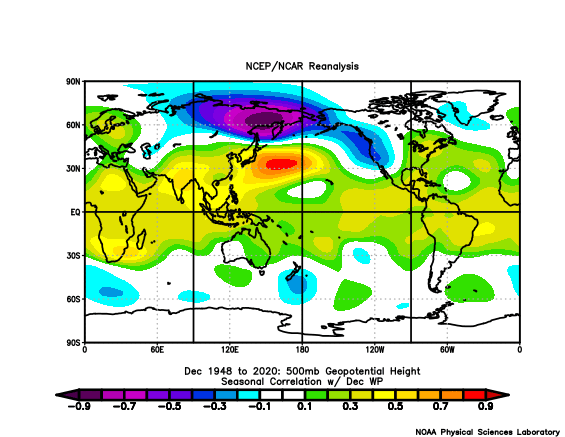
This is a minor warming so I wouldn't expect major shifts in SPV location/strength or resulting 500mb/surface temp pattern to something seen in my post. If I had to say what may be influencing our pattern a bit right now it would have to be a blend of 3.4 trying to look Nina like and the WP pattern finally looking negative, for now. The PDO seems to be rather muted for now even with negative departures still around so as to not be the main driver. As Bluewave has mentioned there really are some competing factors taking place but things are not staying locked so while overall it may seem like the PDO is muted during these times when it relaxes we bounce right back to the -PDO stance. It may be a wildly variable season with no real clear direction that wants to stick out like a soar thumb.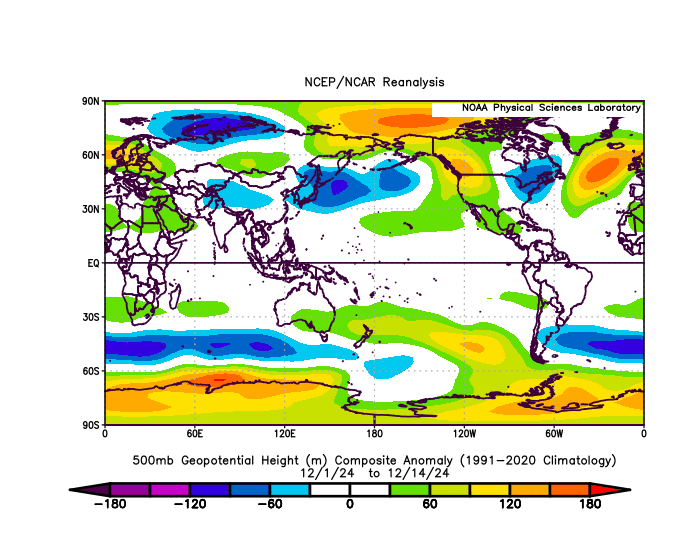
-
2024-2025 La Nina
so_whats_happening replied to George001's topic in Weather Forecasting and Discussion
To me it just looks like a typical wave 1 response with little to no action on the european side to try the squeeze play. So your typical wave 1 response would be to have a warm Canada, we would typically also see a colder eastern Europe but with waters well above average in the Barents sea they tend to moderate just too much and it looks rather mild. We saw something similarish last year. This is not to say it follow in the same path but if I had to take a guess. Here is a nice write-up for one that occurred in 2016/17 season. https://agupubs.onlinelibrary.wiley.com/doi/full/10.1029/2021GL097024
-
2024-2025 La Nina
so_whats_happening replied to George001's topic in Weather Forecasting and Discussion
Last about month and a half the subsurface Nina state seems to be making a little comeback, the overall look is a lot more of a Nina look than it has been for awhile. It will be interesting to see if we do indeed get the weakening of trades showing up on models toward the first week of January..thumb.gif.6f76cf28b6aa9611061aad54f1dd16ef.gif)
-
2024-2025 La Nina
so_whats_happening replied to George001's topic in Weather Forecasting and Discussion
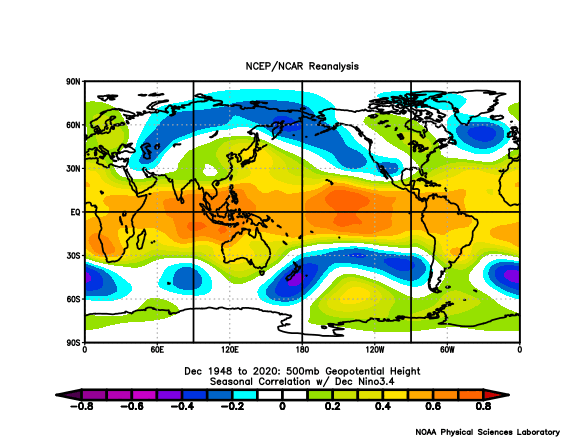
Warmings occur all the time it is the wave activity that is the important factor that coincides with the warming event. So far there seems to have been quite a lack of negative tilted troughs which send poleward flux which would help slow flow, weakening the SPV. Until we start to see that at the 240hr mark showing up consistently it is just a tale. As of now there looks to be a minor displacement event that takes place but nothing showing up right now through December maybe we start to see signs as we get toward the end of the month into January? It would be nice to see the Atlantic side of things help out a bit but im not seeing it with a fairly large ridging pattern trying to set up along western Europe which leads to minor poleward flux just a bit too far south for my liking. vT__lat_p_30N-80N_zm.pdf -
2024-2025 La Nina
so_whats_happening replied to George001's topic in Weather Forecasting and Discussion
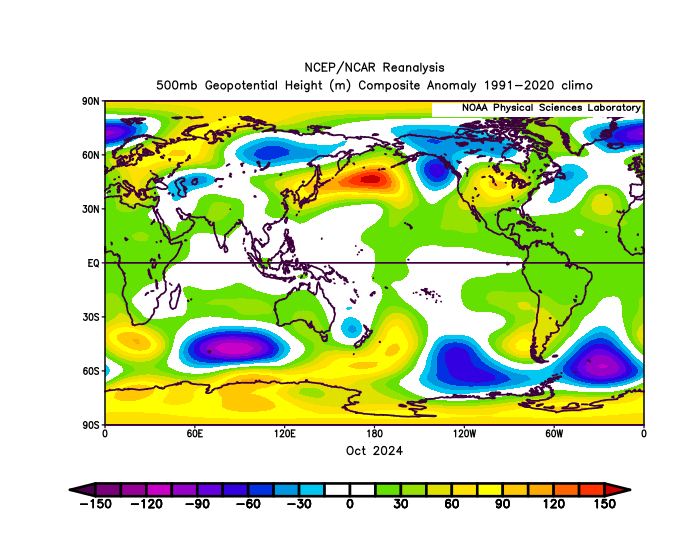
The last 3 months of 500mb patterns shows we finally have changed up the persistent ridging just east of Japan, for now at least. It has not yet setup the continual western ridge like we saw in 13/14 but everything else was still pretty spot on. Again it is not to say that there will be redux of exactly what happened in 13/14 but it is interesting to note the similarities that have shown up over the past couple of months.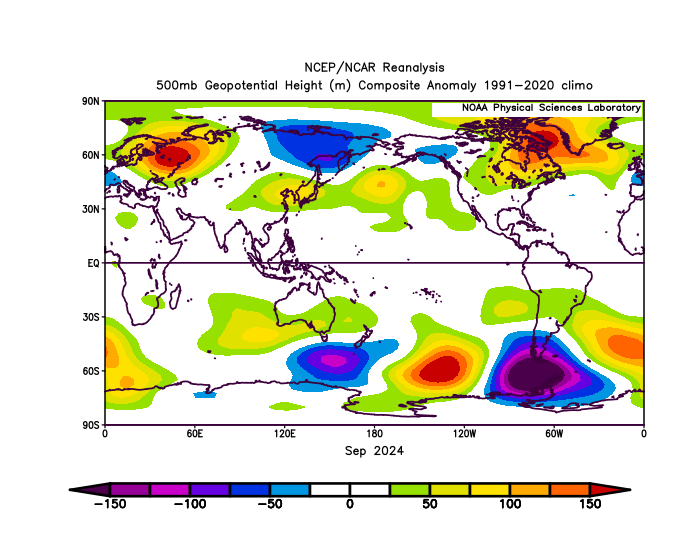
-
2024-2025 La Nina
so_whats_happening replied to George001's topic in Weather Forecasting and Discussion
It is nice to see cooling finally starting to spread through the Equatorial Pacific, especially past the dateline which has struggled for the past few years to do. This should inhibit strong convection in the 6/7 region as the wave passes through so less overall impact from these phases going forward. The MJO is just crawling at this point so the initial thoughts of 5/6 by mid December seemed right but not sure we make it into 7 or 8 until January now. This is by far the strongest the Nina has looked this year and maybe just maybe there is a chance of hitting a trimonthly of -.5, monthly seems like the better option. The subsurface is a struggling and this last little push we are seeing could be the end of whatever Nina state we currently have. No rapid changes are expected but we look pretty close to 'peak' and should slowly neutralize out again. The warming of waters in the Bering Sea, Sea of Okhotsk, and starting to show in the Gulf of Alaska are good things to help us down the road. While it does look like we did make a dent in the PDO numbers we are still running on the high side of things which is unfortunate, but it is nice to see the loop currents off of Japan instead of it being one solid orange/red/brown area. -
DCA _ NYC _ BOS __ ORD _ ATL _ IAH __ DEN _ PHX _ SEA -.8 -.6 -1 +1 +.8 +1.2 +1.6 +2.2 +.8 DCA _ NYC _ BOS __ ORD _ DTW _ BuF __ DEN _ SEA _ BTV 13" 19" 35" 29" 31" 98" 39" 3" 81"
-
2024-2025 La Nina
so_whats_happening replied to George001's topic in Weather Forecasting and Discussion
What I have found kind of crazy about this pattern is there is no retrograding features at all showing up. The overall trough/ridge pattern seem rather stuck even with a rotating MJO wave to try help kick things along. Even with this semi standing wave look, flow is still rather fast and we would need the buckled flow to buckle even more to really slow things down. We do not have negatively tilted troughs showing up creating poleward flux onto the SPV so that will continue to strengthen slowly over time. I do feel the atmosphere is really trying to change going forward instead of trying to revert back to the same ol' humdrum. The fingerprint of the -PDO and background Nina-like state is still holding strong for now. The waters off of the NW coast of Australia are extremely warm right now. This may be something that needs to be watched as those waters are now some of if not the warmest in the equatorial ocean right now with the waters around 130E-180 are trying to cool a bit with these winds being stuck. I hope we can start to chip away at that warm pool in time. Outside of these few things nothing big seems to be on the horizon. I expect the PDO to be under -3 for the month of November which is a good thing to see. I am also not sure we get to a -.5 trimonthly, this next month should be very telling as we are pretty close to the typical Nina peak timeframe. -
Gulf Stream to Shut Down this Century
so_whats_happening replied to 40/70 Benchmark's topic in Climate Change
Flow can still happen continuously even with the overall lessening of the northern branch deep water formation zone. The water essentially just spreads out across the northern most Atlantic and into the Arctic ocean, makes sense sort of why we are seeing the issues with sea ice on the Atlantic front. Eventually the shock will come to the system with the slowing down down by Florida the estimated time of one loop is about 1000 years so if you have multiple shock locations working in tandem maybe it halves or quarters the time? (big question if that would be the cases) The biggest issue would be at the deep water formation zones basically how long does it take to push the issue through the system. If we start to see Florida current slow down with respect to what we have seen thus far through measurements we can only assume this causes issues further downstream even more than we currently see. If I remember correctly one theory is the Gulf stream sort of takes on a more southerly look (gyre situation) versus branching into two paths west of the Azores. -
2024-2025 La Nina
so_whats_happening replied to George001's topic in Weather Forecasting and Discussion
Agreed there seems to be a strong signal showing up around that time. Still over a week out so we will have to wait a few more days for better details. Luckily it seems like the energy off the West/ Pac NW is the culprit so maybe we can get a reconnaissance in there to help clear things up over the weekend before it impacts much of the country during Thanksgiving week. -
Gulf Stream to Shut Down this Century
so_whats_happening replied to 40/70 Benchmark's topic in Climate Change
It is interesting to see the Florida Current is still as active as it has been with little if no slow down. Could it be simply this current just does not necessarily shut down (or takes a much longer time to occur than previously thought) versus Gulf Stream or region the North Atlantic drift region? I don't have nearly enough access to things as I did in school but has overall vertical properties changed drastically around Iceland? In my time of doing oceanography salinity, density, and temperature played a major role in how quickly currents moved in both the horizontal and the vertical, im sure none of that has changed. Are we seeing changes such as larger freshwater layers not necessarily at the surface but meters down impeding vertical transport or surface temperatures being just too warm to allow vertical transport to increase thus causing a pile up in a way of these warmer waters? This would ultimately create a positive feedback loop of warming and further slowing down if this were the case. It is crazy to see little to no trace at least over the last 5 or so years of the Labrador current or hell even the Canary current. This is one of those chicken and egg situations i feel, was it the atmospheric pattern that helped create and enhance the NW Atlantic warming or was it a by-product of an already warming portion of the ocean (due to maybe a slowing northern process) that has shifted the jet configuration and has allowed to further enhance? Have we seen vertical transport changes in the Southern Atlantic similar to what is occurring in the North Atlantic? I feel these two locations would be much more in sync with each other than the currents further south into the subtropics. I know we probably do have quite some time and much warmer temps to experience before what is a collapse of the AMOC but these are just some of things I think about from time to time. Maybe one day in the next decade we flip the AMO and these things can be put to bed for a little... -
2024-2025 La Nina
so_whats_happening replied to George001's topic in Weather Forecasting and Discussion
https://www.meteonetwork.it/models/mjo/ -
2024-2025 La Nina
so_whats_happening replied to George001's topic in Weather Forecasting and Discussion
Been awhile since I have posted one of these updates. Life has been a bit much lately....thumb.gif.32165ed7418e91c6e5c3f6772cc3dc0b.gif)
-
2024-2025 La Nina
so_whats_happening replied to George001's topic in Weather Forecasting and Discussion
The only thing I do worry about and it certainly has been something brought up several times by Bluewave is the linking of the -NAO domain with the SE Ridge pattern. It never is a guarantee but has shown that it does/ has happen quite a bit of recent. With a further south -NAO it could in fact hurt us rather than be beneficial, speculative of course at this time since we have yet to see a pattern really sustain whether warm or cold. What we have had thus far is a lot of swinging back and forth of temps. -
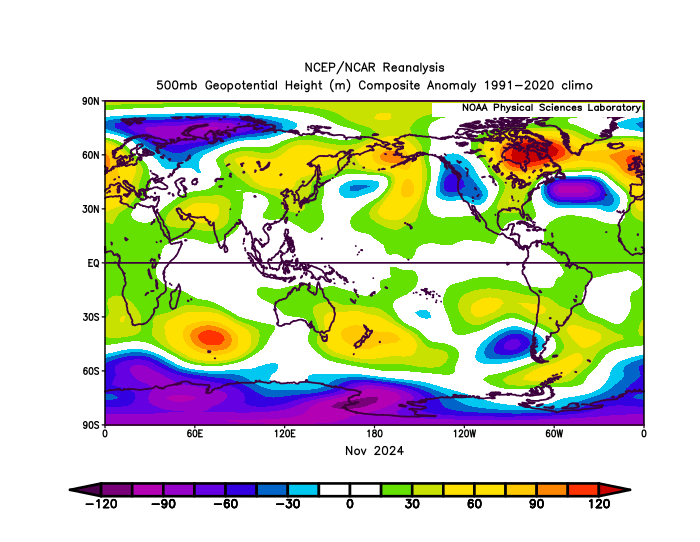
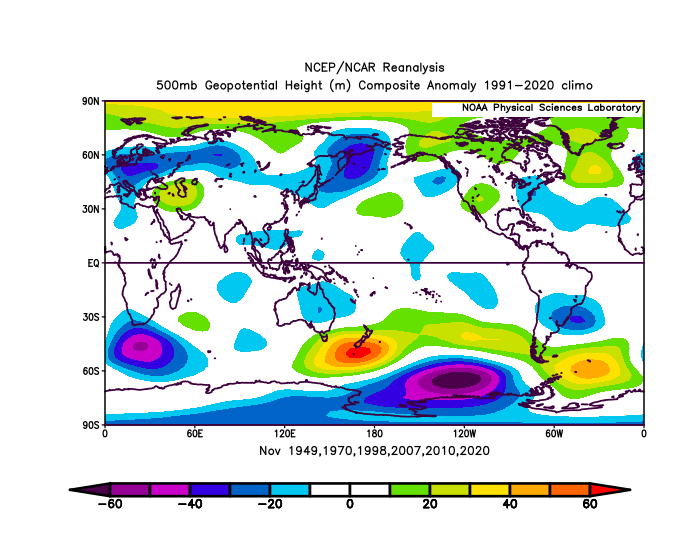
2024-2025 La Nina
so_whats_happening replied to George001's topic in Weather Forecasting and Discussion
I will also add the November from those years... really not that far off. The biggest discrepancy thus far would be the pattern into the eastern US, although we are on our way to more troughing trying to take over for the second half so we might be able to smooth it out a bit. Just know nothing will ever fit perfectly.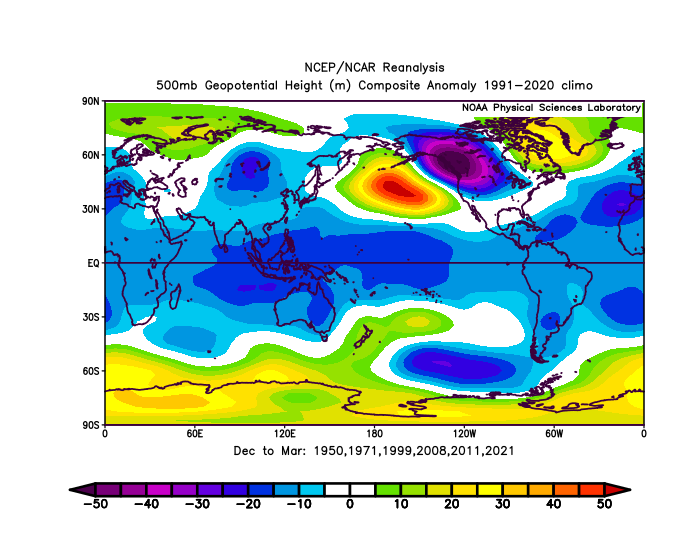
-
2024-2025 La Nina
so_whats_happening replied to George001's topic in Weather Forecasting and Discussion
A bit too far south for my liking but we shall see what happens. If anything that cooling we are seeing is only reenforcing an already strong +AMO. I still am liking this as the forecast for this winter so far it does not seem to be steering me wrong.
-
2024-2025 La Nina
so_whats_happening replied to George001's topic in Weather Forecasting and Discussion
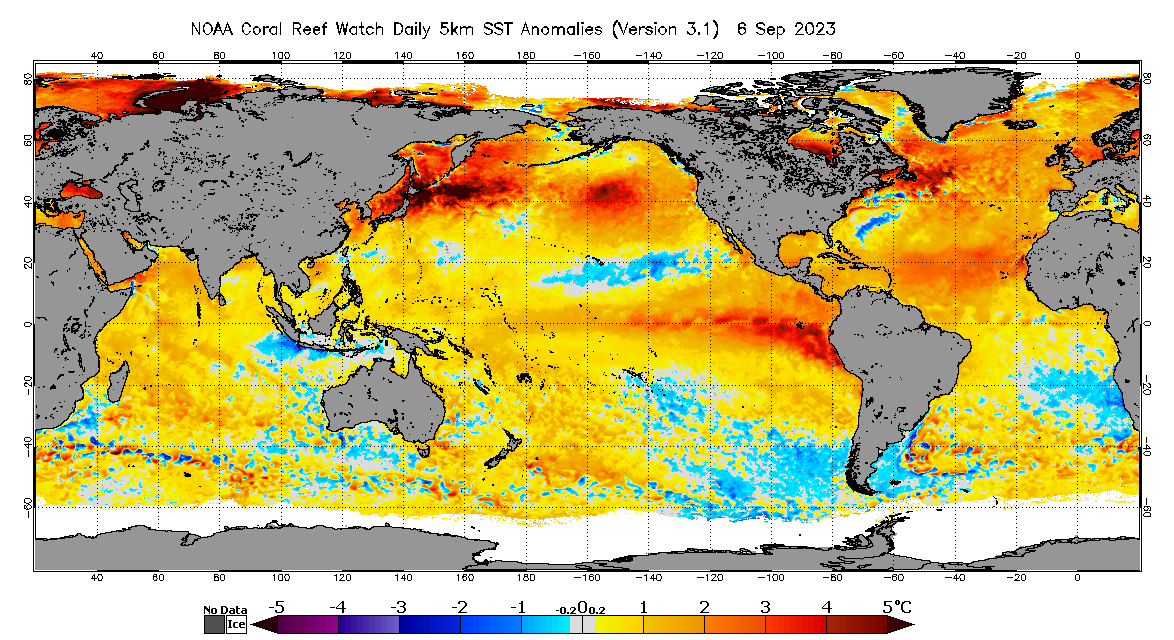
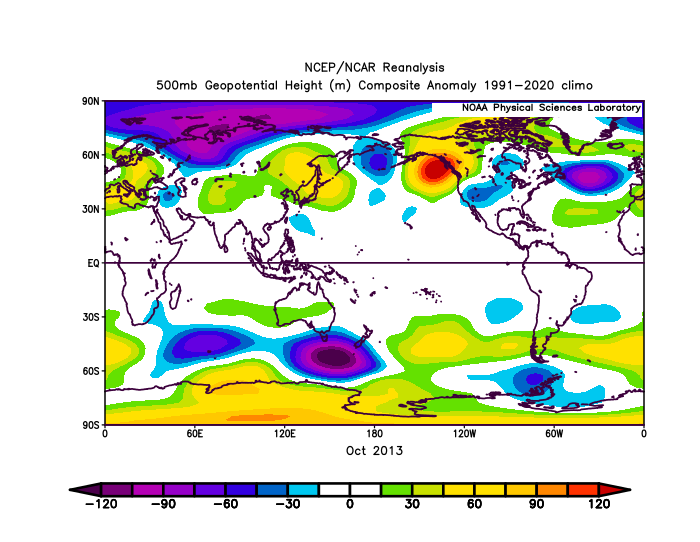
Here was last years SST anoms from Sept to Dec. You will notice the 'cooling down' of SST anomalies but overall the pattern stuck. This year thus far we have seen a back and forth of the 500mb pattern maybe signaling the end of this insanely negative PDO pattern but it will still take time to evolve and change up the Pacific SST pattern. My hope was that as we moved toward winter we would start to weaken the -PDO value but not fully flip everything this year. This may be occurring but until we start to see reductions in values we will continue to wait. I will say it is nice to see these 'mismatches' occur but the theme should still be for things to be sent right back to where we started given relaxation in forcings.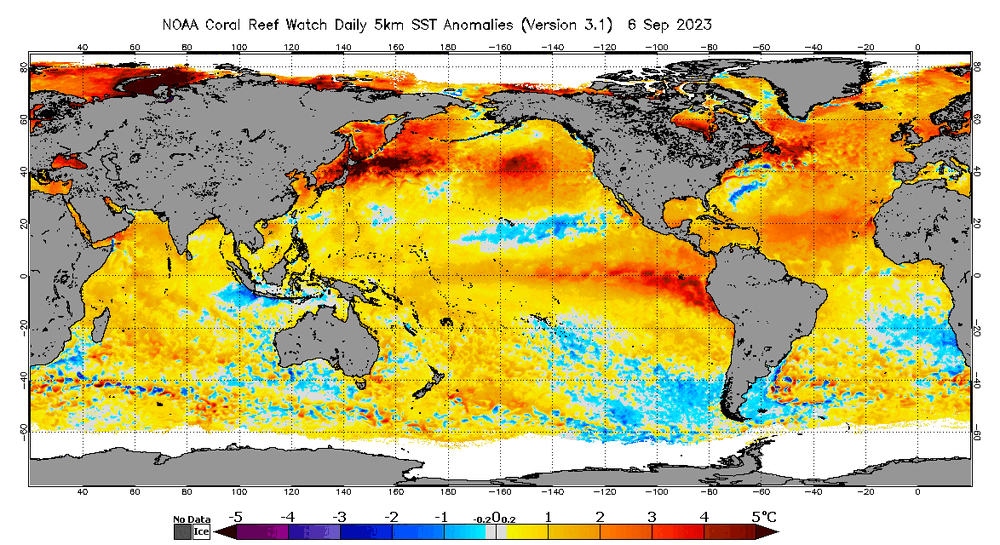
-
2024-2025 La Nina
so_whats_happening replied to George001's topic in Weather Forecasting and Discussion
Myself and others have noticed things seem to be off by about a month right now. Not to say this continues going forward but I can't help but think that maybe just maybe this still has a really solid possibility this winter. If we actually really start to reduce the -PDO within the next 2 weeks or so it only helps the idea. If we really start to amplify this -EPO pattern it could be interesting going forward.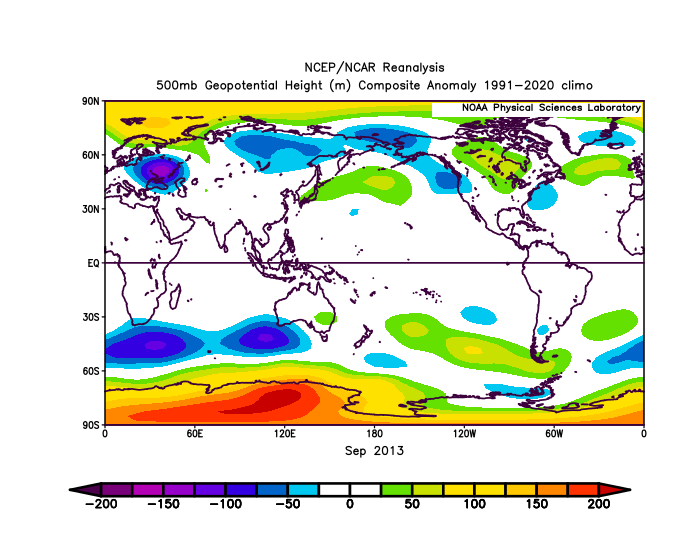

-
2024-2025 La Nina
so_whats_happening replied to George001's topic in Weather Forecasting and Discussion
Impressive changes going on across the warm pool. I expect a monthly down to -2 to -2.5 area for November and if activity continues then maybe just maybe above -2 for the first time in awhile. https://psl.noaa.gov/map/clim/sst.anom.anim.week.html


.gif.f24feac9d875cb5907b12d327f627db9.gif)
.gif.95ac3fef686d5ea25f95aa2869a6462c.gif)
.gif.4e2762df9f50f9055f6cbfd80657c050.gif)