TSG
-
Posts
742 -
Joined
-
Last visited
Content Type
Profiles
Blogs
Forums
American Weather
Media Demo
Store
Gallery
Everything posted by TSG
-
Somewhere near 2" now in Charlottesville. 19/14, mod snow, 0.5 mile vis
-
Some nice banding setting up over Albemarle. Approaching an inch here but it feels like a lot more with the temps preventing any melting. Salt did nothing this morning, roads caved instantly and have stayed covered. 18/12, moderate snow, vis. 1.25 miles
-
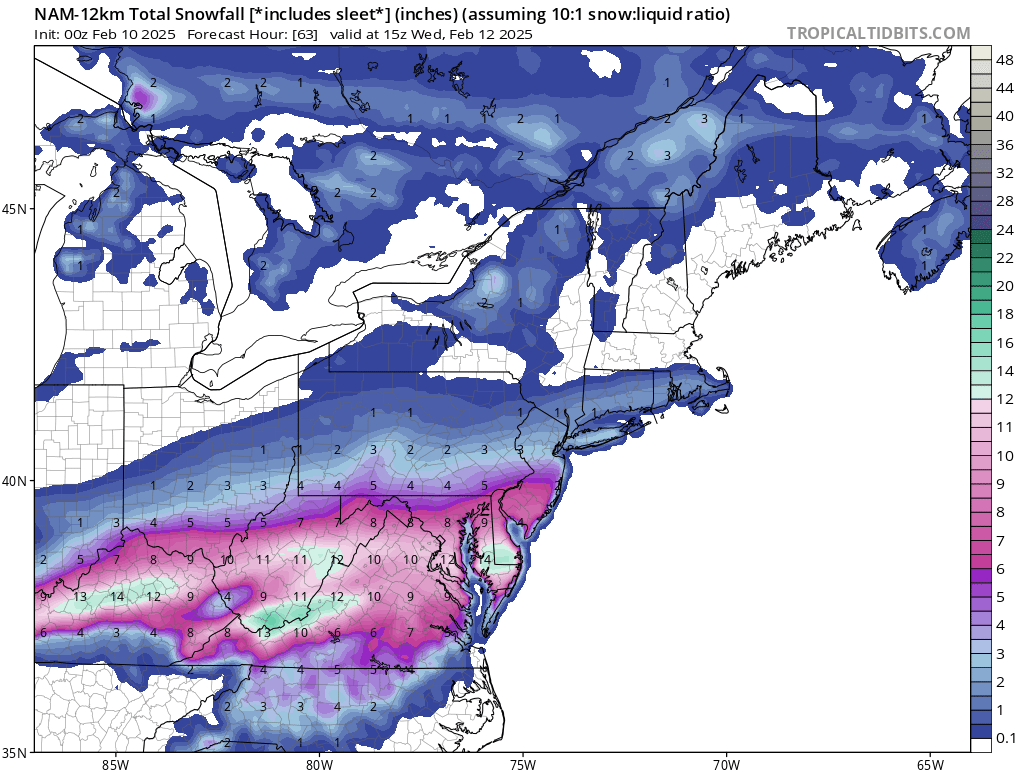
Yeah well half the people on this thread were doing the same so not sure this place is much of a step up. I guess if you're ignoring anything that isn't from a red tagger or like 3-4 other accounts it's fine lol. Posting any NAM output that's over 48hrs needs to be banned on here, not even kidding. These weenies need to have some sense knocked into their head. Like you might as well be posting the results of a coin flip..
-
well that was impressive to witness CHO went from 39F at noon to 55F at 1:30pm
-
Boundary layer temps continuing to run well below forecast down this way 12z NAM3k @ 1pm - 57F CHO @ 12:25pm - 45F
-
whatever survives down this way is going to become concrete overnight Temps are also way down compared to forecast. the 3kNAM had CHO at 50F by noon and they've only managed to get up to 38 here at 11:30..
-
can confirm that's a great family. I'm the same age as his youngest son. Went to JMU with them both
-
My parents I think adored him to a certain degree. He was definitely the face of weather for me as a kid. And even then, their nickname for him was "Boner Bob" lmao it had to do with how excited he'd get on air
-
Ahhh I read 12Z as 12K. I was kind of confused by that wording but carried on anyway lol. Sorry!
-
I'm shitting on it above lol, but the 12k is great 24-36hrs out from an event. The problem is it keeps running past that. I specifically remember the northern crew rejoicing Sunday night about this 00z run.. I had a feeling it was setting people up for disappointment.
-
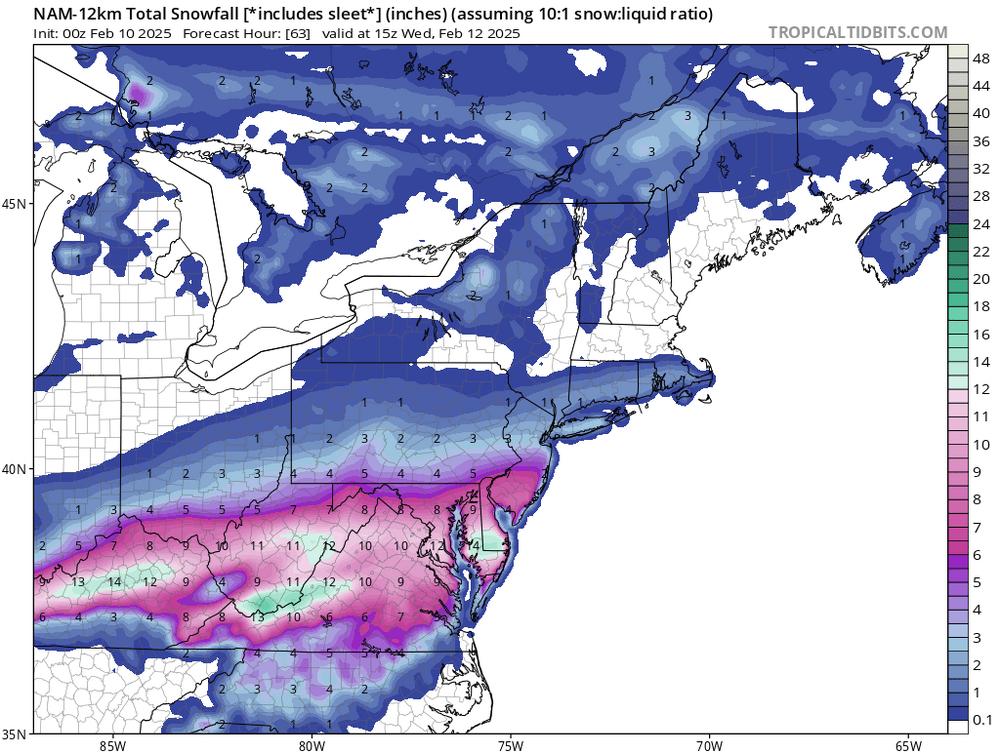
A friendly reminder to everyone what kind of hardware NOAA runs the 12kNAM on

-
HRRR is similar but less severe up your way. NAM3k is almost a non-event outside of favored spots/elevation. It's going to be interesting watching temps today. The HRRR is more accurate for down here rn, it has my area at 31 while the NAM is at 33.
-
is it within protocol to have a second one sitting in the freezer, ready for a precip switch or just reg 6 hr mark?
-
Amazing, one headlight and a rooftop full of snow ready to cover the entire windshield at the next red light
-
I think you'll beat that prediction. Back end precip looks to spread north between 10-12pm
-
you have less than 1.7"?
-
Uhhh hard disagree. there's already more snow on the ground in many of those places than what's on that map as a storm total 10 hrs from now
-
it completely missed the snow we got from the ULL pass in the early Jan storm
-
it's remarkable how many times this lesson has to be learned lol
-
Radar is playing tricks right now. Still under moderate snow down here despite the meager returns above
-
This happened with the early January 2022 storm. If high rate bands start training over 95, the crews will almost never be able to keep up. So then you get drivers coming either direction going at speeds appropriate for somewhat/mostly cleared conditions suddenly encountering a highway that's completely covered. Yeah.. good drivers would know to anticipate it but it definitely adds to the chaos. Also, 95 in NoVA is FILLED with MD drivers so don't be so quick to point a finger
-
Snow has taken over again in Charlottesville after about an hour and a half of mixed snow/sleet. holding steady at 28/27 since 2:30pm, 5mph NNE wind
-
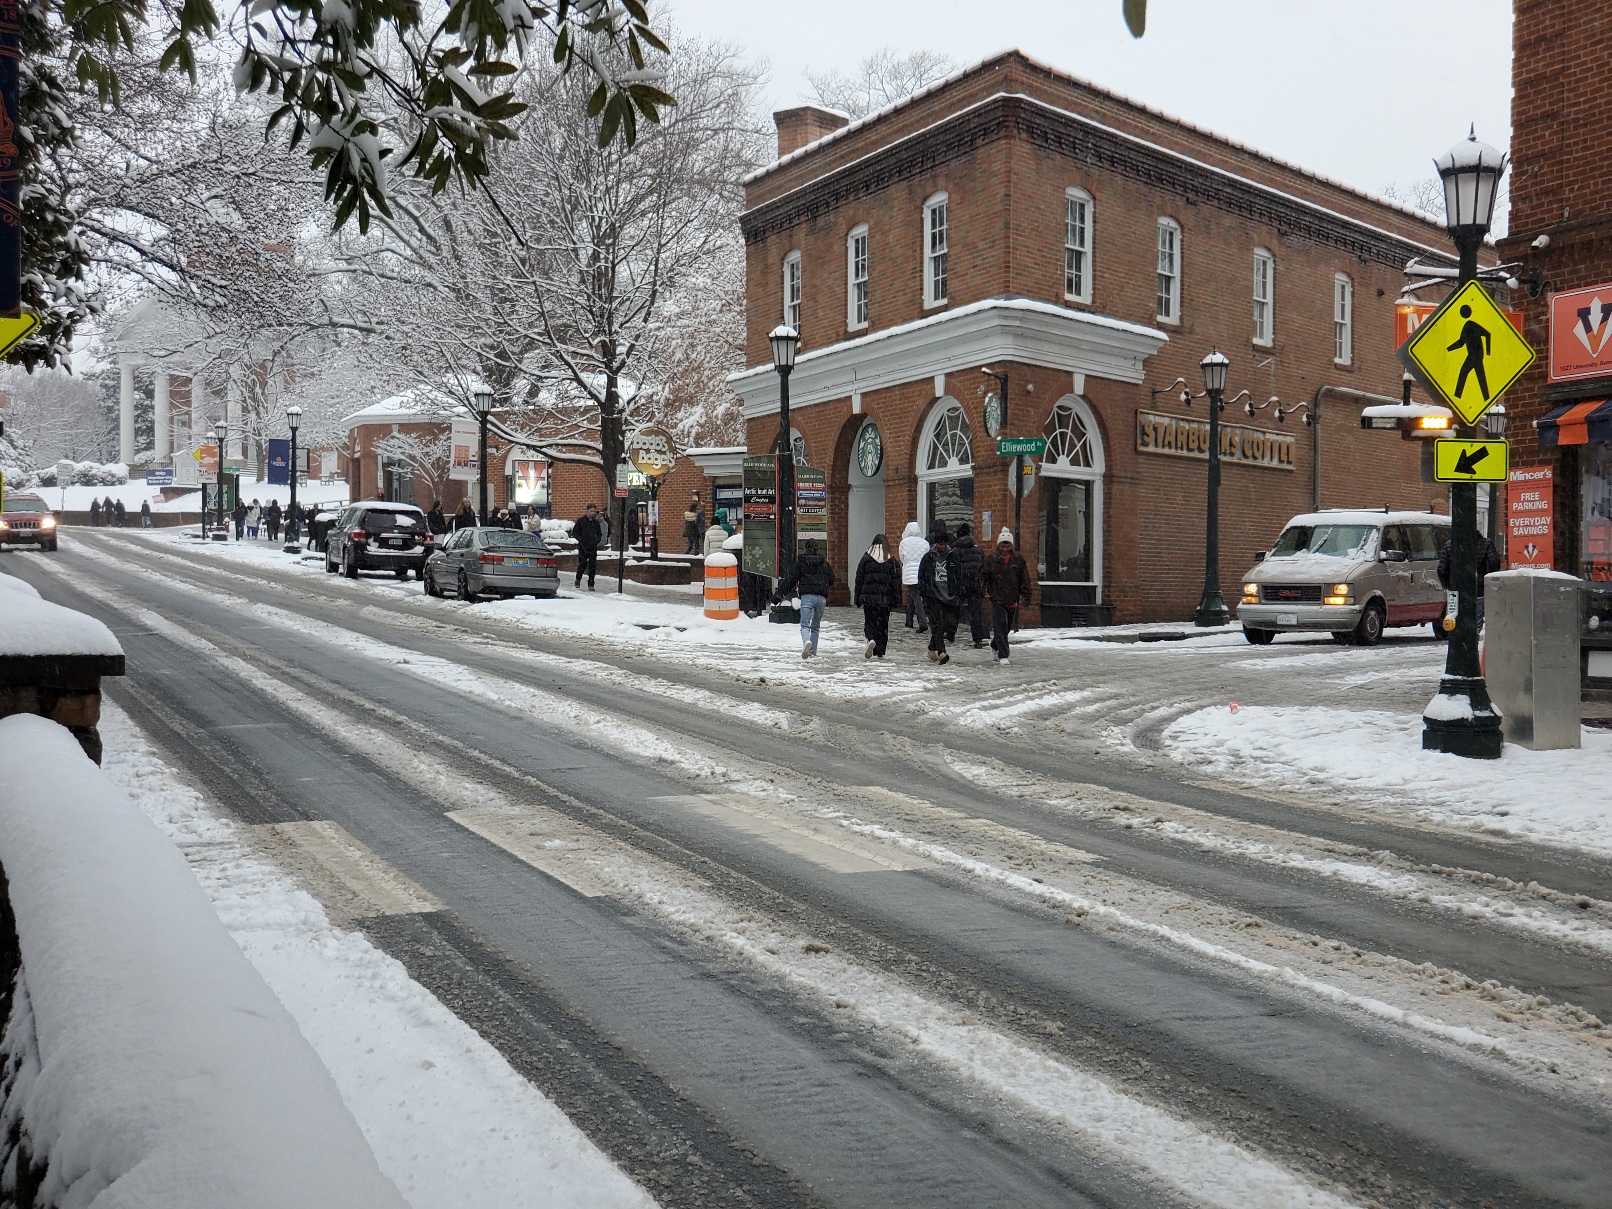
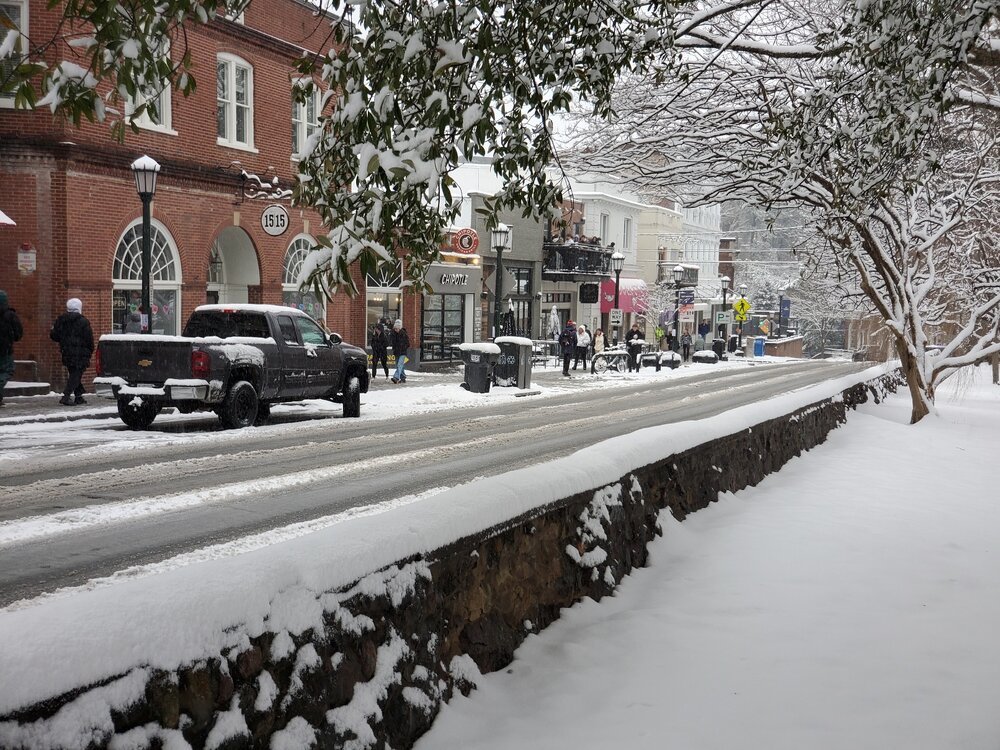
And two more of the Corner

-
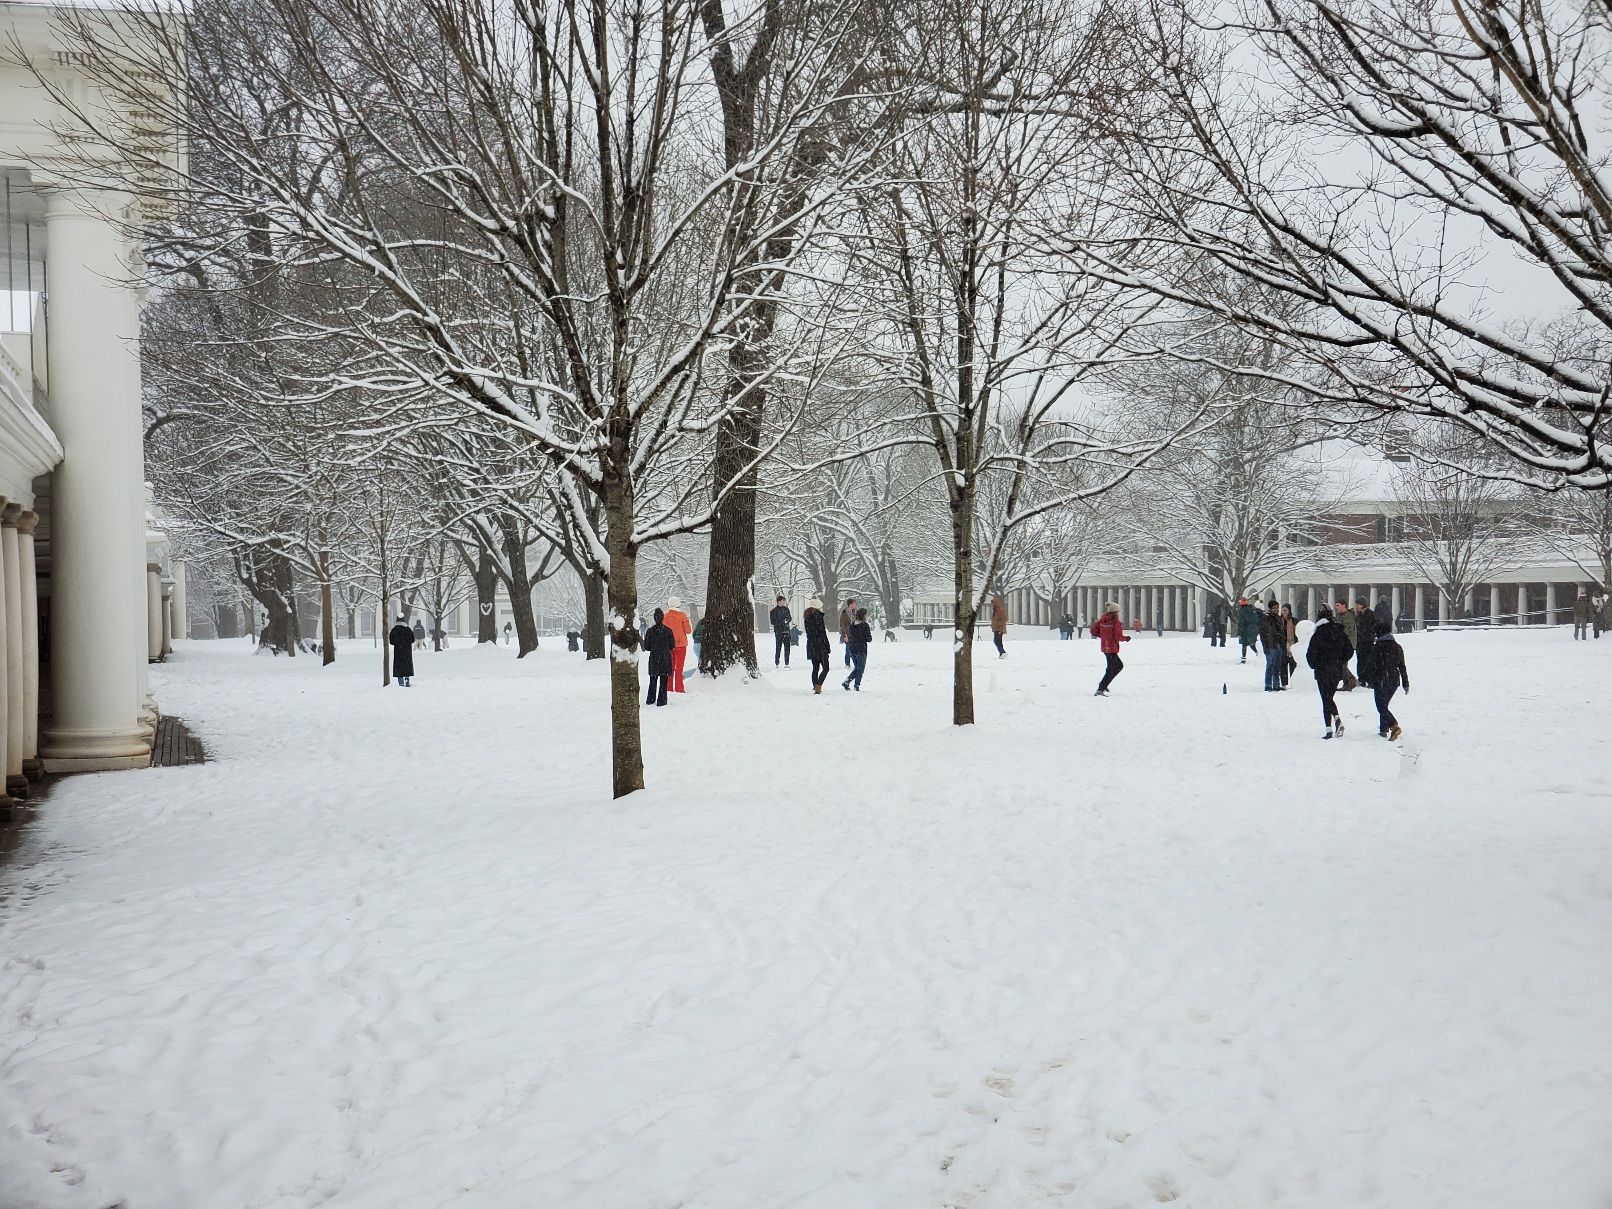
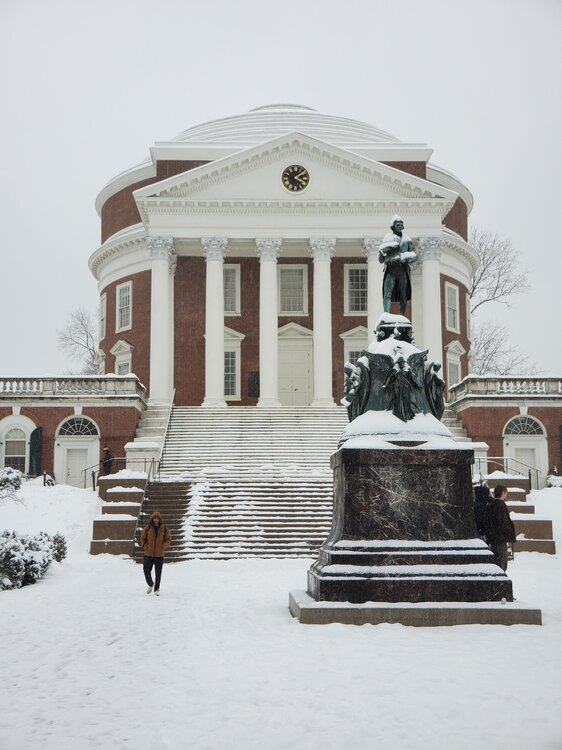
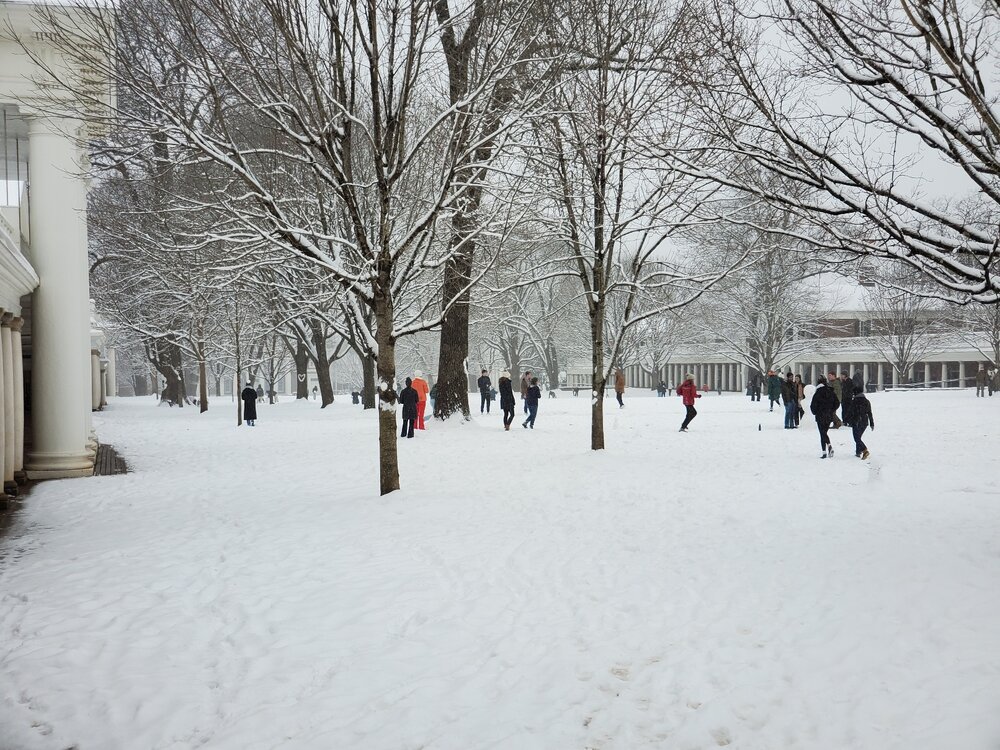
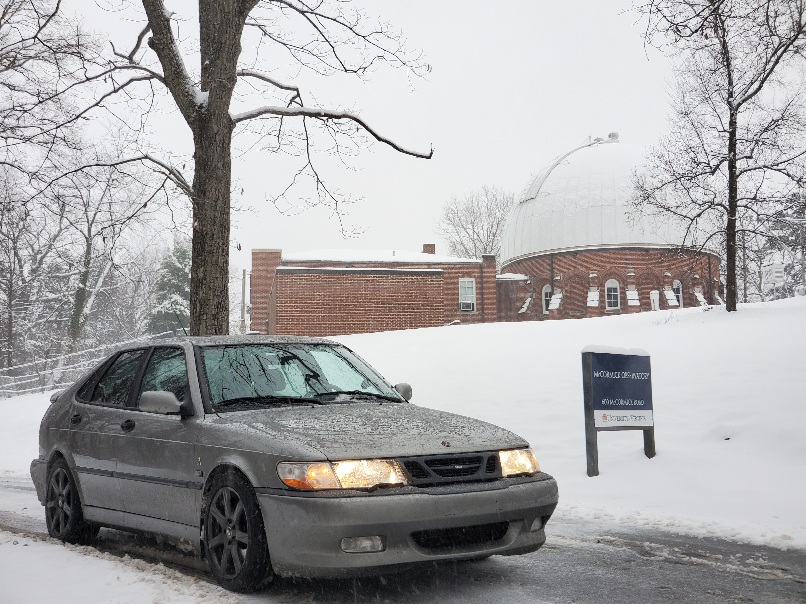
As requested @NorthArlington101 @WesternFringe The Rotunda The Lawn and a bonus shot of this old gal sitting victoriously on the top of O-Hill. Absolute monster in the snow except for that bumper clearance..
-
Heaviest snow I've seen since the 2016 blizzard when I lived in NW DC. Just awesome.