chubbs
-
Posts
4,086 -
Joined
-
Last visited
Content Type
Profiles
Blogs
Forums
American Weather
Media Demo
Store
Gallery
Everything posted by chubbs
-
https://data.giss.nasa.gov/gistemp/station_data_v4_globe/
-
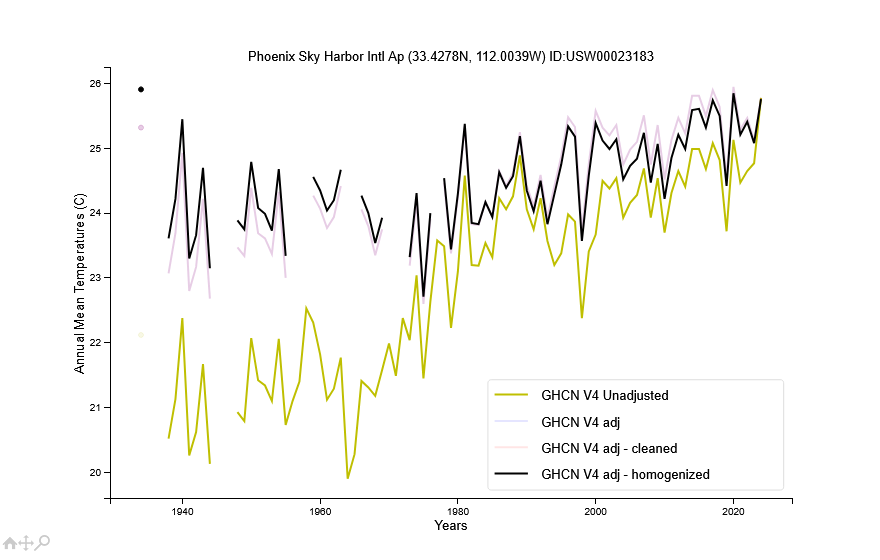
Not sure about Phoenix as a whole. But the heat island effect looks saturated at the Sky Harbor airport which isn't far from downtown. Actual and adjusted temperatures have warmed at the same rate since 1980. This means that the airport is warming at the same rate as regional sites outside of the Phoenix heat island. Before 1980 there is evidence of heat island warming at the airport (or some other site specific issue).
-
The arctic has much lower variability in the summer as melting sea ice holds surface temperature near freezing. That gives Antarctica more influence over the global mean in N Hemi summer. Unfortunately there isn't a similar plot for antarctica.
-
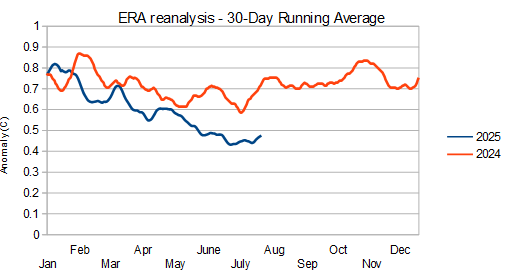
As the year has progressed, 2025 has cooled at an increasing rate vs 2024. Remember that 2025 stayed stubbornly warm as the el nino waned. My take is that some of the typical post-nino cooling was delayed until this year. We are still warm vs pre-nino conditions but not gobsmacking.
-
Chester County PA - Analytical Battle of Actual vs. Altered Climate Data
chubbs replied to ChescoWx's topic in Climate Change
Yes UHI at the Philly airport is saturated. UHI is non-linear with population density. Per chart below, the biggest UHI effect comes with the initial urbanization. In addition there isn't much year-to-year or decade-to-decade change in the area near the airport. Minor building in the flat part of the curve isn't going to move the needle.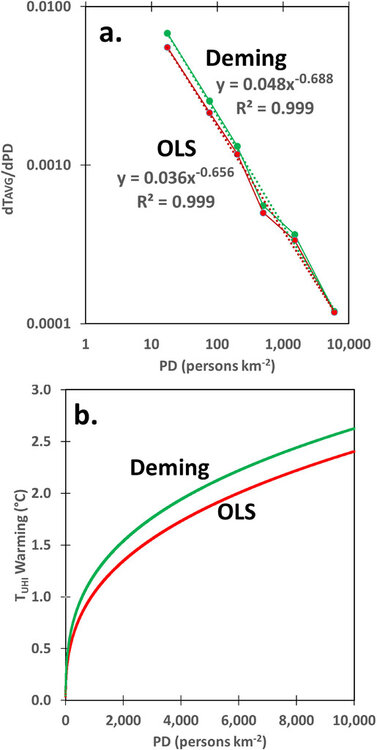
-
Chester County PA - Analytical Battle of Actual vs. Altered Climate Data
chubbs replied to ChescoWx's topic in Climate Change
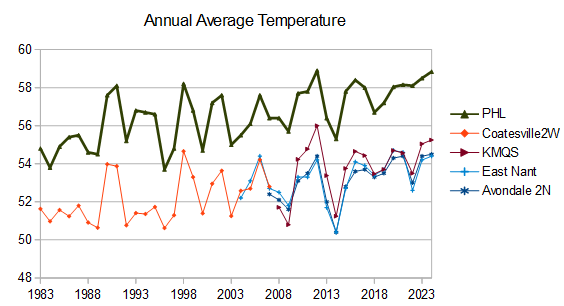
Here's a chart and table combining the Chesco, Berks and Philly Airport (PHL) data from the previous page or two. No doubt about it, Chesco, Berks, and PHL are all warming at the same rapid rate.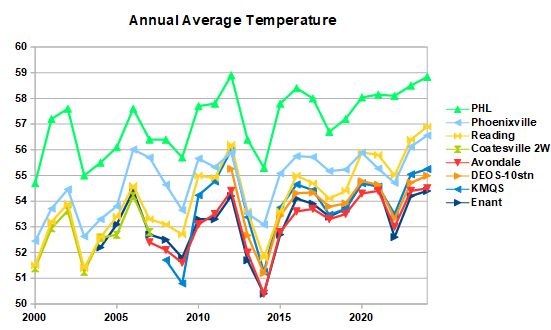
-
Chester County PA - Analytical Battle of Actual vs. Altered Climate Data
chubbs replied to ChescoWx's topic in Climate Change
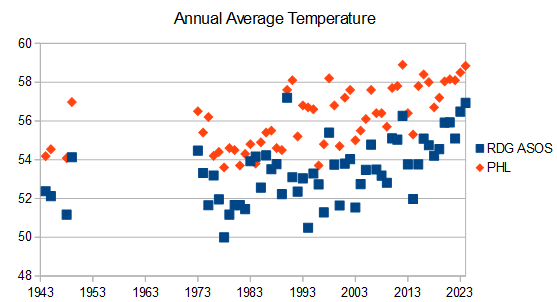
PHL isn't pulling away though. You are looking at the regression line, not the data itself. Reading (and Chesco) are warming as fast as the airport at the end of your chart., Note also that there are several years when Reading (and Chesco) is warmer than the Philadelphia Airport. That's a red flag for a data issue of some kind. Those years could have a big effect on the regression line. So what's going on here. I found two sets of data. COOP data from Xmacis starting in 1999, with the first year of full coverage in 2000; and, ASOS data from IEM which starting in 1943, but with many missing or incomplete years before 1973. Note that I was only able to find info on missing data at IEM with a one month resolution, So there may be some periods with missing data included in this analysis. The COOP data starting in 2000 shows a close match between RDG and PHL, with RDG warming faster than PHL, 1.3F/Decade vs 1.0F/Decade The ASOS data also shows a close match between RDG and PHL, but there is more scatter in the pre-2000 period, perhaps due to missing data. The difference between Reading and Philly is roughly the same in 1943 and 2024. You are beating a dead horse. There is plenty of high quality data that shows that the Airport is warming at the same rate as Chesco and the entire region. Sure you can find incomplete/inconsistent data or conduct a faulty analysis that says otherwise, but that doesn't negate the findings from the high quality data. You have to look at all the evidence. A piece of evidence that disagrees with consistent results from high quality data is inevitably flawed in some way.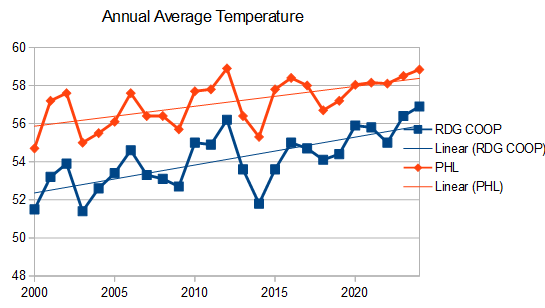
-
Chester County PA - Analytical Battle of Actual vs. Altered Climate Data
chubbs replied to ChescoWx's topic in Climate Change
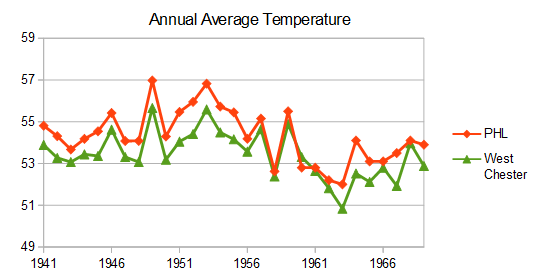
The Chester County COOP data is contaminated by station moves and other station changes, particularly in the 1945-1970 period. The three COOPs in existence in 1945 all had major cooling moves in this period: Coatesville (1946-47), Phoenixville (1948) and West Chester (1970). The Coatesville and West Chester moves have been well documented in this thread. The Phoenixville move in 1948 was equally significant as shown in the chart below. During the 1941-54 period covered by the chart, PHL tracks West Chester closely, along with with ABE and the Newark Ag station. I showed above that the airport PHL tracks Chester County station data very well when station moves are excluded: West Chester 1941-69, Coatesville 1948-current, Phoenixville 2000-25, and all the other Chesco stations. There is no evidence of a major heat island problem at the Philadelphia airport in previous page or two of material. You can't understand Chester County's climate without recognizing and accounting for the station moves and other changes at the Chester County COOPs. Your charts are just highlighting problems in the Chester county COOP data and/or your analysis methods.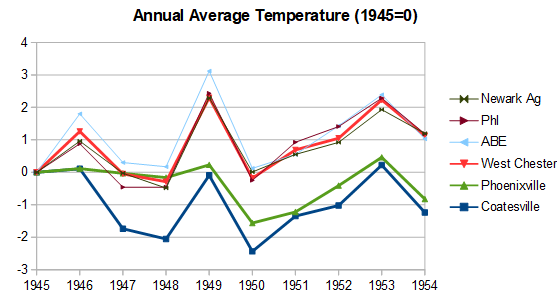
-
Chester County PA - Analytical Battle of Actual vs. Altered Climate Data
chubbs replied to ChescoWx's topic in Climate Change
Meh, your recent station table didn't include either station. Why the addition of these two stations now? Per NCDC Hopewell/Morgantown isn't even in Chester County and only starts in 1979, so has minimal impact on the 1970s. Can't find any information on Hopewell/Elverson at NCDC or IEM. Note that West Grove the highest of the other 1970s sites ended operation in 1976. Only the 4 lowest sites operated throughout the 1970s. So you are overstating the average 1970s elevation, potentially by a lot depending on when Hopewell/Elverson started-up. Its all a quibble anyway. PHL trends with Avondale for July high temperatures just like it did for annual average temperatures, I'm sure its the same story with the other Chesco stations. Why would July Highs be different than annual average temperature? One final point, The Phoenixville COOP is on the water company property. The water company property is not built up, with a few water company buildings, a small reservoir, woods and fields; and it doesn't change very much from year-to-year or decade-to-decade. Unlikely to have any heat island effects. Just another example of PHL doing a better job of matching individual Chesco station data than your network average. -
Chester County PA - Analytical Battle of Actual vs. Altered Climate Data
chubbs replied to ChescoWx's topic in Climate Change
I get 339' in 1970: Phoenixville- 105, Coatesville 1SW - 342, Devault - 360, West Chester - 440, West Grove - 449. -
Chester County PA - Analytical Battle of Actual vs. Altered Climate Data
chubbs replied to ChescoWx's topic in Climate Change
Yawn, Avondale and PHL are have similar trends for July Highs. All you are showing is that your station average doesn't match individual station data. Big change in the station network since 1970. The average station today is 100' higher.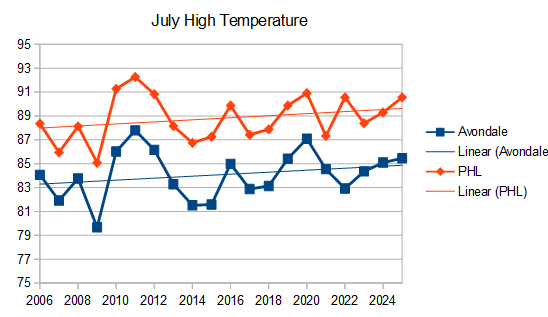
-
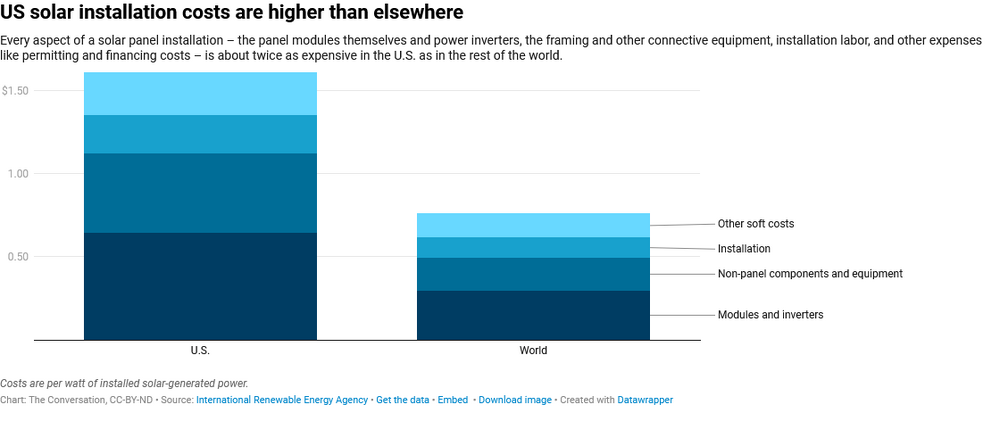
Yes, renewables and fossil fuel are completely different industries: extractive vs tech manufacturing. Fossil fuels are very profitable if you control a cheap resource. In renewables China is the low cost-supplier, with an ever widening lead. Making it difficult for the rest of the world to compete. We are a laggard in renewables from a cost standpoint due to tariffs, permitting costs and other factors. With the current administration we aren't going to catch-up either. Another factor is natural gas prices, which are well below global levels in the US due to our local production. Which also hurts the competitiveness of renewables. In the future as US LNG exports continue to increase, the difference between our gas prices and the rest of the world could shrink. We could easily end up with high cost power, vs the rest of the world, particularly China. Batteries and solar are becoming increasingly important to energy economics supplanting oil and other fossil fuels. We are way behind China and falling further behind. Hitching our wagon to the wrong energy horse. https://www.renewableenergyworld.com/solar/us-solar-manufacturers-lag-skyrocketing-market-demand/ https://about.bnef.com/insights/clean-energy/global-cost-of-renewables-to-continue-falling-in-2025-as-china-extends-manufacturing-lead-bloombergnef/
-
Chester County PA - Analytical Battle of Actual vs. Altered Climate Data
chubbs replied to ChescoWx's topic in Climate Change
The big difference between the Phila Airport and the Chesco station average occurred in the 1945-1970 period. That's when the Chesco station average cooled significantly relative to other regional stations. Before 1945, Chesco COOPs were as warm as the Philly Airport or the Newark DE Ag station. By 1970, Chesco COOPS were as cool as Allentown. The cooling was mainly due to station moves: Coatesville 1946/47, Phoenixville 1948 and West Chester 1970. A reverse heat island effect for Coatesville and West Chester. Meanwhile the Phila Airport tracked other regional stations and West Chester before the 1970 West Chester move. The raw data is very clear. The Phila Airport is a much more consistent source of climate data than the Chesco COOPs. PHL's consistency advantage grows when non-COOP data is added making the Chesco data even more inconsistent.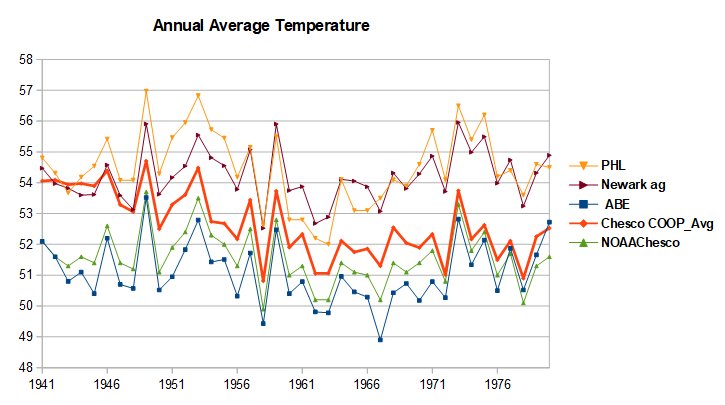
-
Chester County PA - Analytical Battle of Actual vs. Altered Climate Data
chubbs replied to ChescoWx's topic in Climate Change
I don't mind the network, but it is different from our COOP stations, particularly the older ones. Night and day different. By the way, regarding your post of a couple of days ago. Per the last few pages, there are quite a few local sites at 1F/decade in recent decades. Won't change what I wrote previously, but will keep an eye on it. -
Chester County PA - Analytical Battle of Actual vs. Altered Climate Data
chubbs replied to ChescoWx's topic in Climate Change
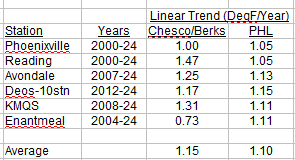
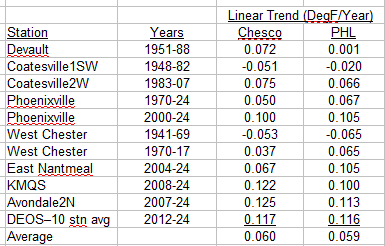
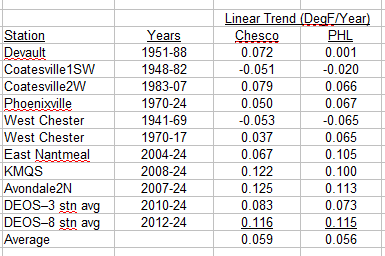
Meh. There isn't a big difference in the 2000-25 warming rate between Philadelphia and Phoenixville: 1.00 deg/decade for Phoenixville and 1.05 deg/decade for PHL. The difference is only 5% of the warming rate and is probably not statistically significant. I updated my table with the new Phoenixville and DEOS trends. No change in the main finding. Some plusses and minuses from station to station but on the whole the airport is warming at the same rate as Chesco stations.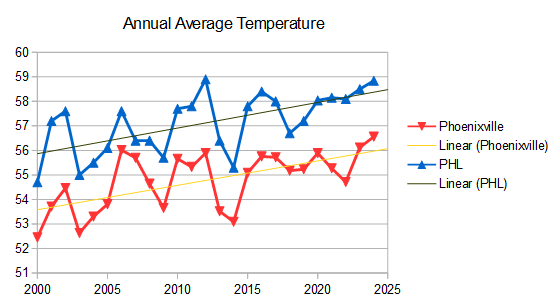
-
Chester County PA - Analytical Battle of Actual vs. Altered Climate Data
chubbs replied to ChescoWx's topic in Climate Change
Nice cherry pick among the DEOS. Per chart below, there is no difference warming between the 11 DEOS stations as a whole and the Philadelphia Airport. Some are warming faster than PHL and some slower. The warming rate for the DEOS stations in the 2012 and 2024 period, when all stations were active, is 1.17F per decade. The rate for the Philadelphia Airport is 1.15F/decade. Note that the airport had a warm sensor issue in 2022, which caused a one year spike in temperatures vs other regional station. That's not a heat island effect, since it disappeared in 2023. In any case the 11 DEOS stations and the Avondale USCRN station show conclusively that Chester County is warming rapidly in recent years, over 1F per decade. Can't blame it on heat island effects either. The stations are all remote.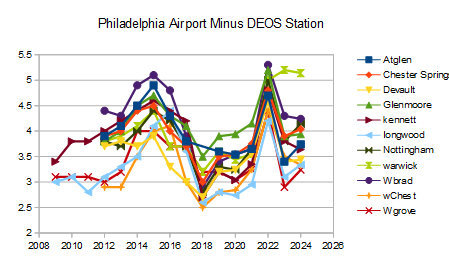
-
Chester County PA - Analytical Battle of Actual vs. Altered Climate Data
chubbs replied to ChescoWx's topic in Climate Change
That's what I had in my table. Phoenixville warming faster than PHL between 1970 and 2024. However per the table the following stations warmed faster than PHL: Devault (1951-88), Coatesville 2W (1983-07). West Chester (phl had more cooling, 1941-69), KMQS (2009-24), Avondale 2N (2007-24), and DEOS 3 stn (2010-24). As I said a mixed bag, but on average no difference.
-
Chester County PA - Analytical Battle of Actual vs. Altered Climate Data
chubbs replied to ChescoWx's topic in Climate Change
This looks OK. My Table had Enantmeal warming at a slower pace. Some stations are warming faster, like Avondale, some slower, like ENantmeal. Overall the warming is the same. -
Chester County PA - Analytical Battle of Actual vs. Altered Climate Data
chubbs replied to ChescoWx's topic in Climate Change
Not sure what you are plotting. The difference between PHl and Avondale in 2007 is 4.0, much larger than the value you have plotted. The difference between PHL and Avondale is nearly constant with time, with a slight decrease in the trend line. i.e. Avondale is warming slightly faster than PHL, though the difference may not be statistically significant. This agrees with the linear trend table I posted above and the chart showing Avondale and Philadelphia. You better check your math.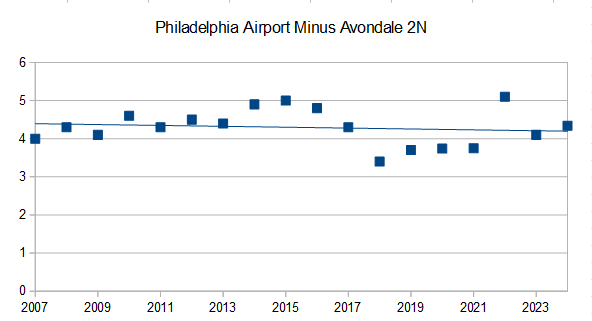
-
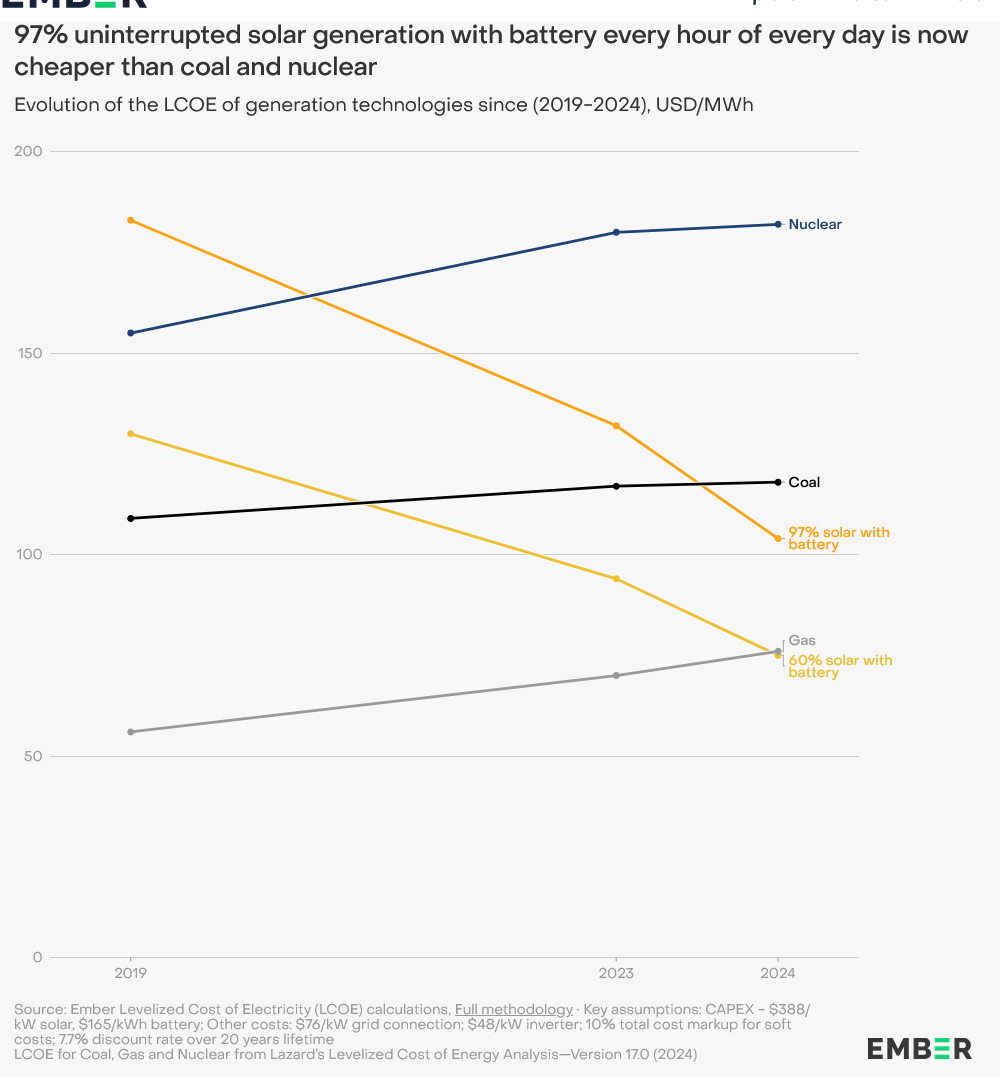
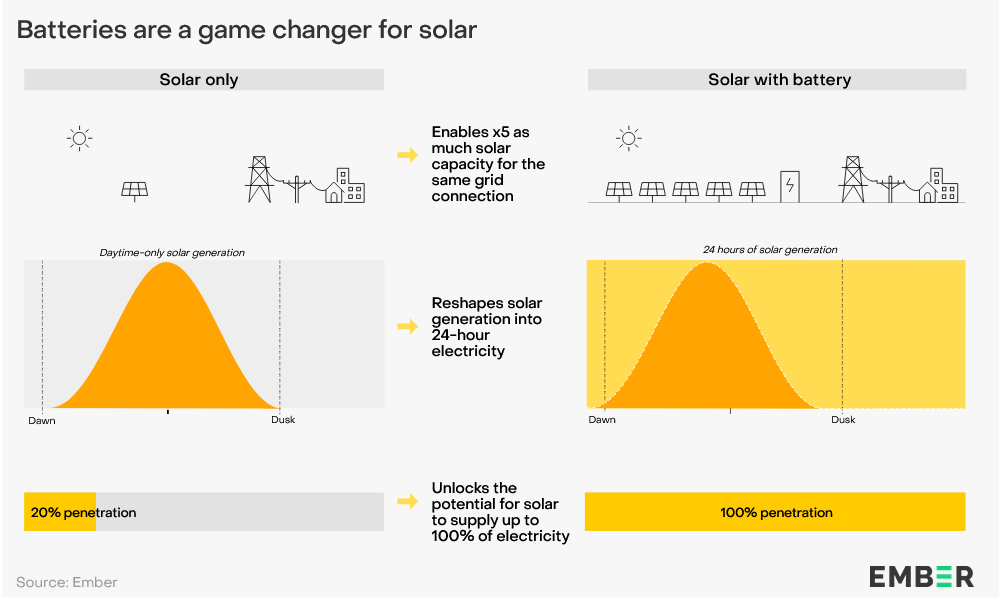
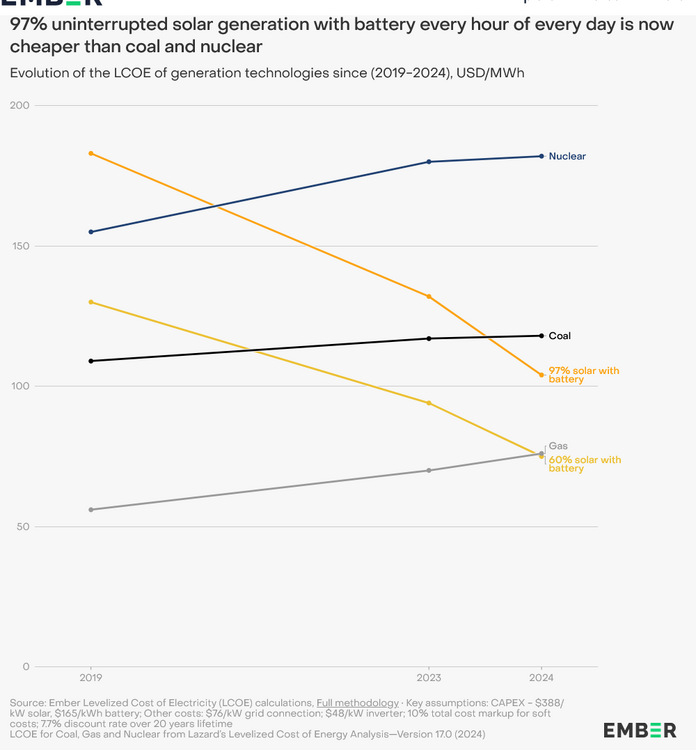
This is an interesting report. With the decrease in battery prices, 24-hour electricity from battery/solar is becoming cost effective in sunny locations. Projects are already being developed around the world and costs are only going to drop in the future. A game changer potentially. https://ember-energy.org/latest-insights/solar-electricity-every-hour-of-every-day-is-here-and-it-changes-everything/
-
Chester County PA - Analytical Battle of Actual vs. Altered Climate Data
chubbs replied to ChescoWx's topic in Climate Change
I was asking for a plot to back-up your cherry picking claim, individual stations that don't look like the Philadelphia Airport. Since you won't provide, I broke down and obtained the DEOS data, 11 stations. Guess what? DEOS looks just like the other data I looked at: Avondale, ENantmeal, KMQS and the Philadelphia Airport. Just as I thought it would. This region experiences the same weather. Unless there is a station change, all the stations move together. I separated the DEOS stations into 2 groups: 3 stations started in 2010 and 8 starting in 2012. Per the updated table, the station slopes for the 2 groups of DEOS stations are a close match to the Philadelphia airport, as close as any of the other stations in the table. Since your County Average has an increasing gap with the Philadelphia Airport, the county average doesn't match the individual Chesco stations. That's why I made the point above: the Philadelphia airport is a better match to the individual Chester County stations than your county average is. So what is the problem? Its not a heat island at the Philadelphia Airport. Its not cherry picking on my part. Has nothing to do with the raw data at all. Its your station averaging method. I've told you many times over the past 18 months: simple averaging of a changing network skews the result. The more the network changes with time, the bigger the skew vs station data. The other problem is cooling station moves at the Chesco Coops: Coatesville 1946/47, Phoenixville 1948, and West Chester 1970. That's why your results don't match the raw data. Very easy to check if I am right or not, just plot a few stations against your "Chesco County Avg".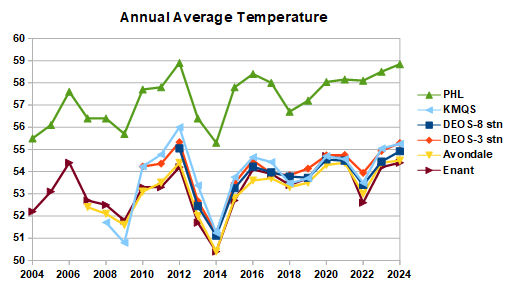
-
Chester County PA - Analytical Battle of Actual vs. Altered Climate Data
chubbs replied to ChescoWx's topic in Climate Change
OK, so you are saying the other stations (mainly DEOS that I don't have) don't agree with the Avondale USCRN station (or KMQS and ENantmeal)? That would be very odd considering the good agreement between the 3 stations (4 including the airport) and the high quality of the USCRN station with 3 thermometers in place. You'll have to show me that in a plot, because I don't believe you. No averaging either to hide the details, single station data only. -
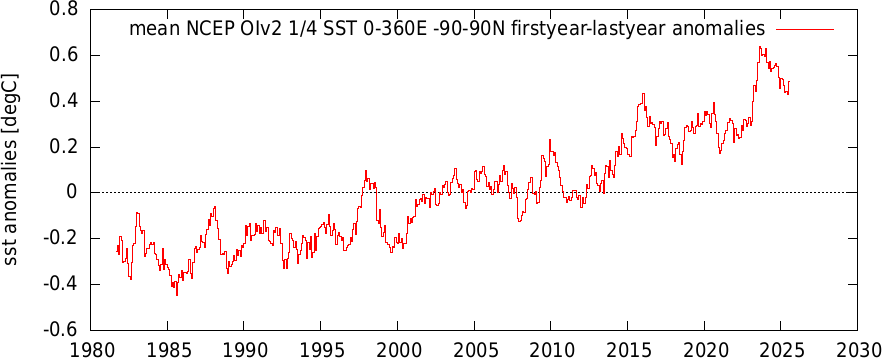
JB is right, July is tracking 0.23C cooler than last year on ERA re-analysis, a decline very similar to June. For the year-to-date, 2025 is running 0.11C cooler than last years record. A fairly typical enso-related decrease. Below is satellite SST including July. Showing how this nino compares to others. The biggest difference is the rapid spike upwards.
-
Chester County PA - Analytical Battle of Actual vs. Altered Climate Data
chubbs replied to ChescoWx's topic in Climate Change
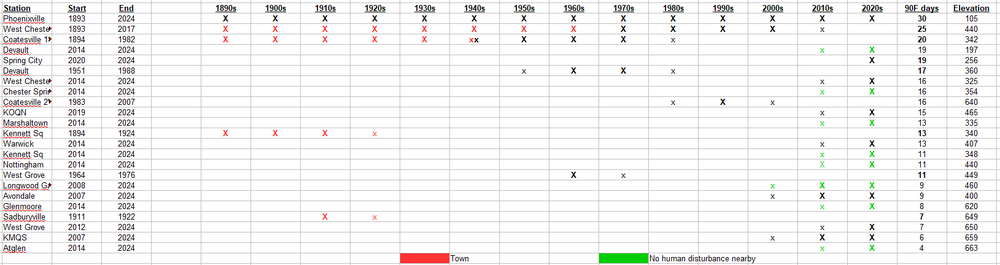
Wow. You don't recognize raw data when you see it. Let me repeat, the table below is based on RAW data, no adjustments. For every Chesco station, the raw data was used to calculate the linear regression slope. The Philadelphia airport slope is taken for the same years as the Chesco station: 2007-24 for Avondale, 2004-24 for East Nantmeal, etc. An apples-to-apples comparison of raw data: Chesco vs Philly Airport. I added West Chester from 1941 to 1969 to the table, avoiding the big West Chester station move in 1970. Also added a chart showing how the year-to-year raw Chesco data matches PHL. The results couldn't be clearer. From 1941 to 2024, airport is a better match to raw data from individual Chesco stations than you are. If you don't think so present a similar comparison. Without station moves of course. Likewise the 90F day data I posted in the table above is raw data, your own numbers mainly. The newer DEOS stations have fewer 90F days than our historic COOPs. Not surprising since the DEOS stations are in cooler locations than COOPs. As I showed with Phoenixville, West Chester and Avondale, you aren't matching the raw 90F day data from individual stations, not even close.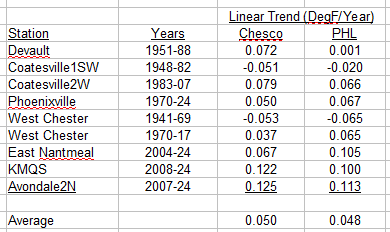
-
Chester County PA - Analytical Battle of Actual vs. Altered Climate Data
chubbs replied to ChescoWx's topic in Climate Change
Nope. No one measures the temperature of Chester County and there is no "actual factual raw data" for Chester County in your chart. Your line is a calculated value and you are making a rookie mistake which distorts the raw data. As I have mentioned before, taking the simple average of changing station network skews the trend. If you have cooler stations at the end vs the beginning you will combine the network and weather changes and bias the results. Easy to demonstrate using the 90F data for Chesco stations that you posted recently. The table below sorts the Chesco stations you are using from high to low 90F days. For stations with a long record only the last 30 years of 90F data are used for a btter comparison to the current stations. Due to location, the older stations tend to be at the top of the 90F list and the newest stations at the bottom. The 90F day plot that you posted recently is skewed by the change in the station network from 1950 to today. That's why your chart doesn't match the raw 90F data from Phoenixville, West Chester or Avondale, which all show an increasing in 90F days, not a decreasing trend. Your 90F result is determined by the stations you have selected not our weather. Same thing happens with temperature. Your county estimate is biased and the bias increases the further back you go as the county network becomes warmer and warmer relative to today's network. The 1940s network is completely different than the one you have put together for today.