chubbs
-
Posts
4,156 -
Joined
-
Last visited
Content Type
Profiles
Blogs
Forums
American Weather
Media Demo
Store
Gallery
Everything posted by chubbs
-
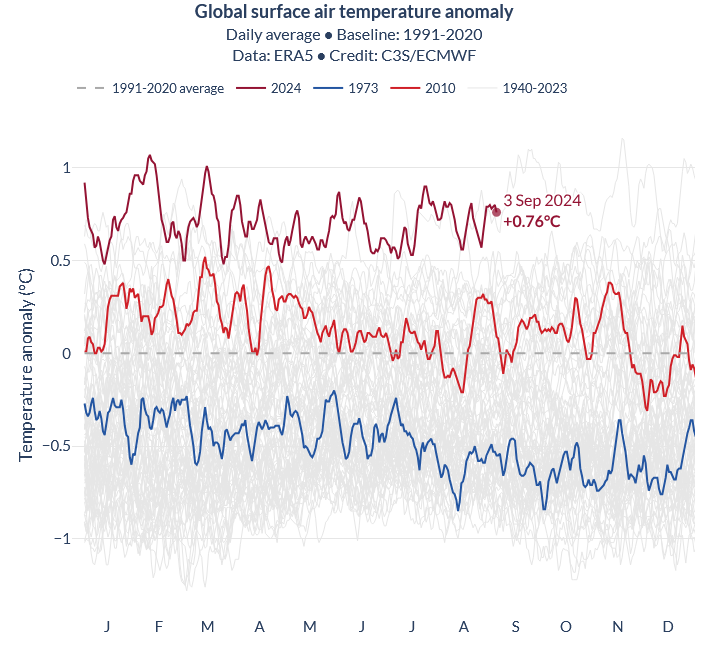
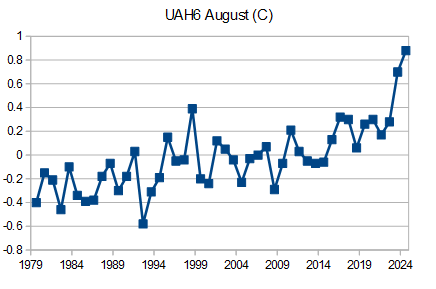
2023, 2010 and 1973 below, we've come a long way just in the past 10-15 years.
-
This nino has produced August UAH6 anomalies, this year and last, that are much higher than the previous high of 0.38 in August 1998 and even higher relative to recent Augusts. With the notable exception of 1998, enso effects on UAH6 have generally been weak in August and other summer month; but, this nino has maintained high UAH6 values through 2 summers. The $64 question is where will be next August, when nino effects are completely washed out.
-
Surface melt balance anomaly for Arctic ice caps relative to 1980-2010. The grey shaded area is one standard deviation. Melt was slightly above average for Greenland and well above average for the remainder. Record losses occurred from Svalbard through Franz Joseph to the Russian High Islands, mainly in July and August, showing the warmth near the Atlantic sea ice margin. https://www.climato.uliege.be/cms/c_5855702/fr/climato-arctic
-
Blog from Gavin Schmidt on this paper. As one might expect, the headline is overblown. Paper contains useful paleo data, but doesn't move the ECS/ESS needle. https://www.realclimate.org/index.php/archives/2024/08/oh-my-oh-miocene/
-
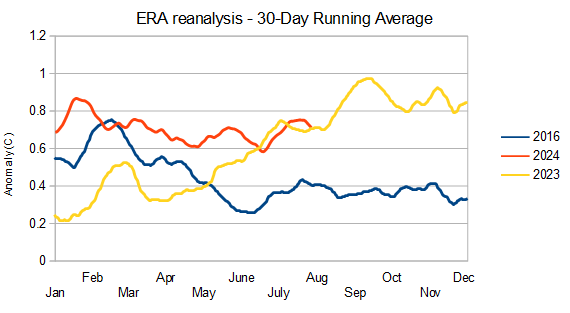
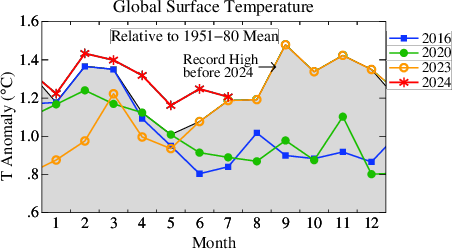
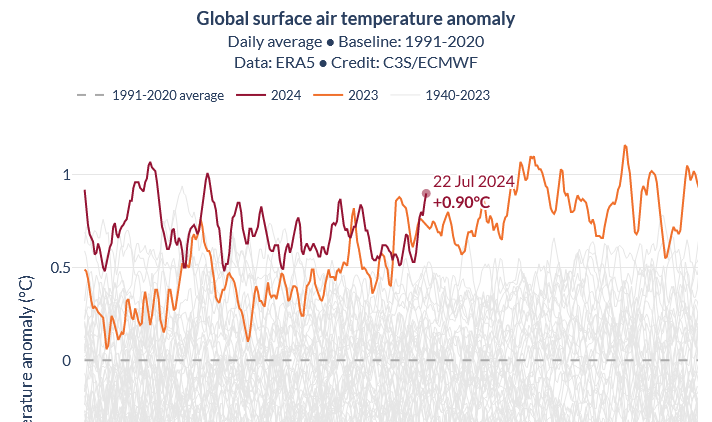
Temperatures this year have been slow to fall, which almost guarantees another record. Year-to-date, ERA is running 0.24C warmer than 2023, and 0.22C warmer than 2016. The remainder of 2024 would have to average 0.41C on ERA to avoid a record, i.e. close to 2016. The rest of the year will be cooler than 2023, but not that cool. In a more likely scenario, 2024 continues to run 0.22C warmer that 2016, and breaks the record by 0.05C.
-
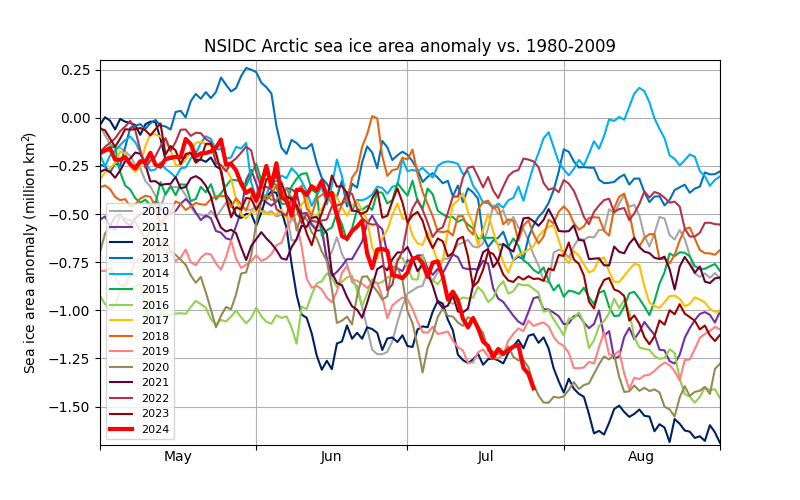
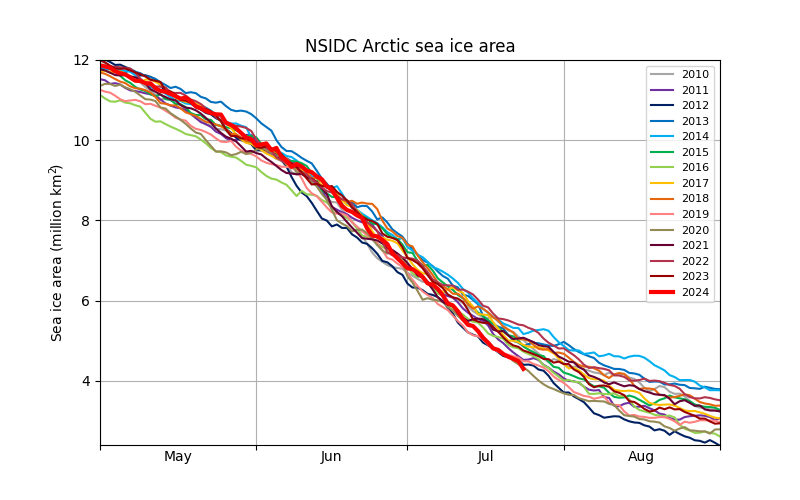
Relatively clear day today gives a good view of the "swiss cheese" pack this year, which is causing area to run unusually low relative to extent. This section is near the pole ( 88-89+N).
-
Report: Another Year of Record Heat for the Oceans
chubbs replied to donsutherland1's topic in Climate Change
The short answer is no
-
Chester County PA - Analytical Battle of Actual vs. Altered Climate Data
chubbs replied to ChescoWx's topic in Climate Change
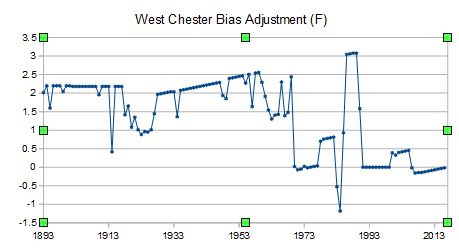
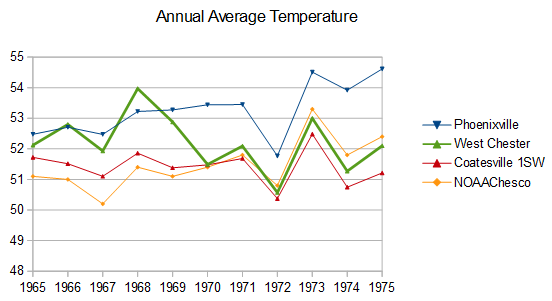
Using monthly raw data and comparing to nearby County sites it is very easy to spot when the West Chester station was shut down for several months and moved to a cooler site in 1970. The 1970 station move accounts for the bulk of the West Chester bias adjustment over the lifetime of the station. The older stations in Chester County were in much warmer locations than the stations we have today, older towns mainly, in the south and east portion of the county where people lived. Over the years stations moved to more rural sites and shifted north and west to better cover the whole county. If you assume that the Chesco monitoring network is the exactly the same today as it was 130 years ago you will be way off.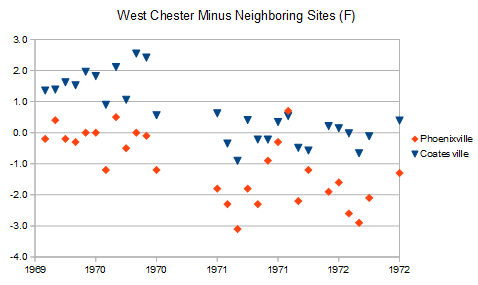
-
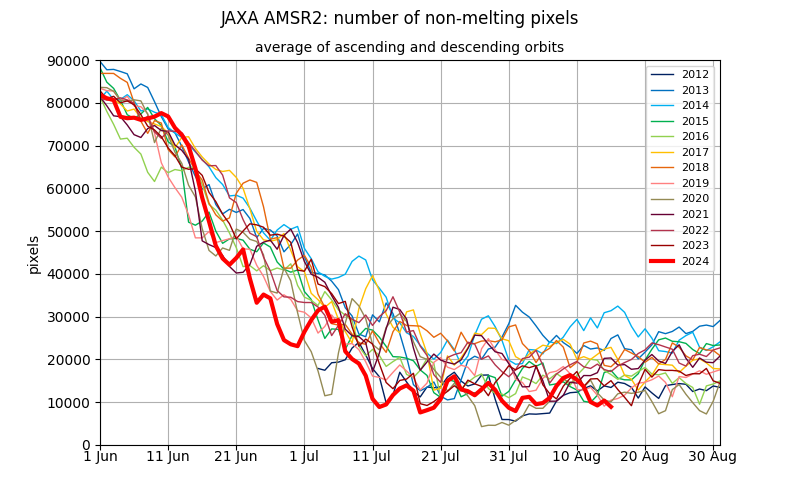
Despite the pattern change, melt indicators have remained elevated through July and August. Picking up again in the past week, per the top chart.
-
Chester County PA - Analytical Battle of Actual vs. Altered Climate Data
chubbs replied to ChescoWx's topic in Climate Change
Below is Coatesville with a very rough adjustment for the town-->outside of town move, 2F phased in between 1946 and 48 (2 moves in that period). This single, crude, move adjustment removes most of the difference between NOAA and the raw data. The agreement isn't perfect, but you wouldn't expect it to be. Coatesville 1SW had multiple in town locations and Chescowx is 3 different sites (Coatesville 1SW, Coatesvelle 2W and East Nantmeal). Each move would have some impact on measured temperatures. There can be non-move station changes as well. With all the station moves at Coatesville and West Chester, you get a much better answer by accounting for station changes.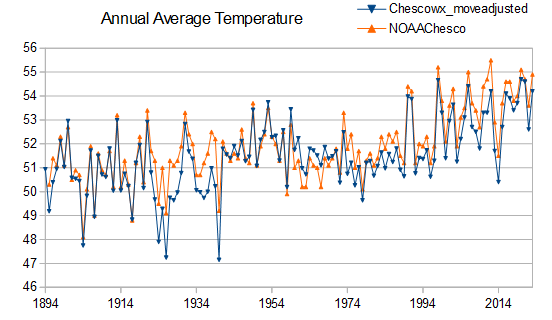
-
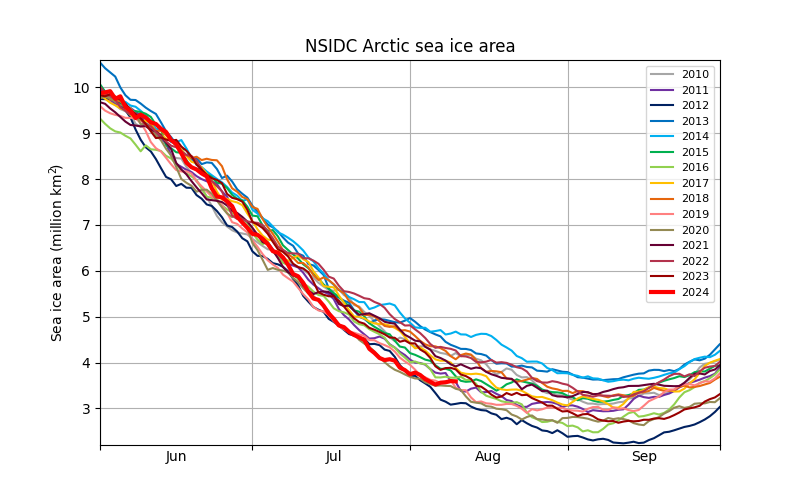
Area losses slowed to a crawl this week. Dropping 2024 to #5 from top 3
-
GISS for July was 1.21 just edging 2023 for the 14'th straight monthly record. The last 2 months have been much warmer than 2016 and any pre-2023 year. The 2023/24 nino was fast to warm last year and is slow to cool down this year.
-
Sorry Paul! I posted the chart below previously. The move-related cooling is readily estimated from nearby stations. West Chester went from being like Phoenixville before the move in 1970, to being like Coatesville after, roughly 2F. The timing matches the station move exactly. Of course NOAA uses many more stations for a more robust estimate of the move's impact. Same story at Coatesville. A fact whether you accept or not.
-
Surprised that a heat island expert like yourself thinks that those town/city sites are representative. The Coatesville and West Chester station moves to more rural sites nearby caused roughly 2F of cooling. Accounting for the moves is why NOAA is spot on and you are way off.
-
And as usual, You've ducked my point. Do you think Phoenixville, the city of Coatesville, and the town of West Chester, are a good representation of Chester County?
-
The data lies if you don't use it properly. You have been putting out misinformation on our local climate for decades.
-
You are the guy who is altering our local climate. Phoenixville, the city of Coatesville, and the town of West Chester are a poor representation of Chester County. Much warmer than the county as a whole. No wonder you are so far off before the Coatesville and West Chester station moves.
-
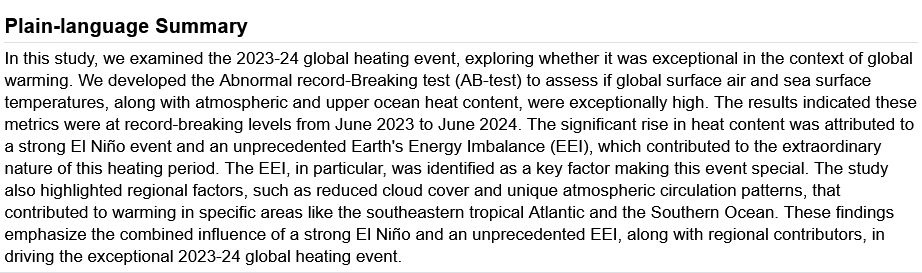
This paper for fall AGU meeting indicates the earth's energy imbalance is the main reason this nino has been so warm. Note the rise in atmospheric heat content in 2024 due mainly to increasing water vapor content. https://agu.confex.com/agu/agu24/meetingapp.cgi/Paper/1553238
-
Amplified warming of North American cold extremes linked to human-induced changes in temperature variability "Here we show that cold extremes over North America have warmed substantially faster than the winter mean temperature since 1980. This amplified warming is linked to both decreasing variance and changes in higher moments of the temperature distributions. Climate model simulations with historical forcings robustly capture the observed trends in extremes and variability " "It is important to note that despite our results, winter cold extremes over North America will continue to occur. Winter tem- peratures over North America in the current climate have the highest variance57 and are some of the most strongly negatively skewed9,21 on Earth. This means that extreme deviations below the mean are expected to continue to occur in the future, even with rising global temperatures. However, because of the increasing mean temperatures, combined with the changes in temperature variability, cold extremes over North America will occur less frequently, and when they do occur, they will be less intense" https://www.nature.com/articles/s41467-024-49734-8.pdf
-
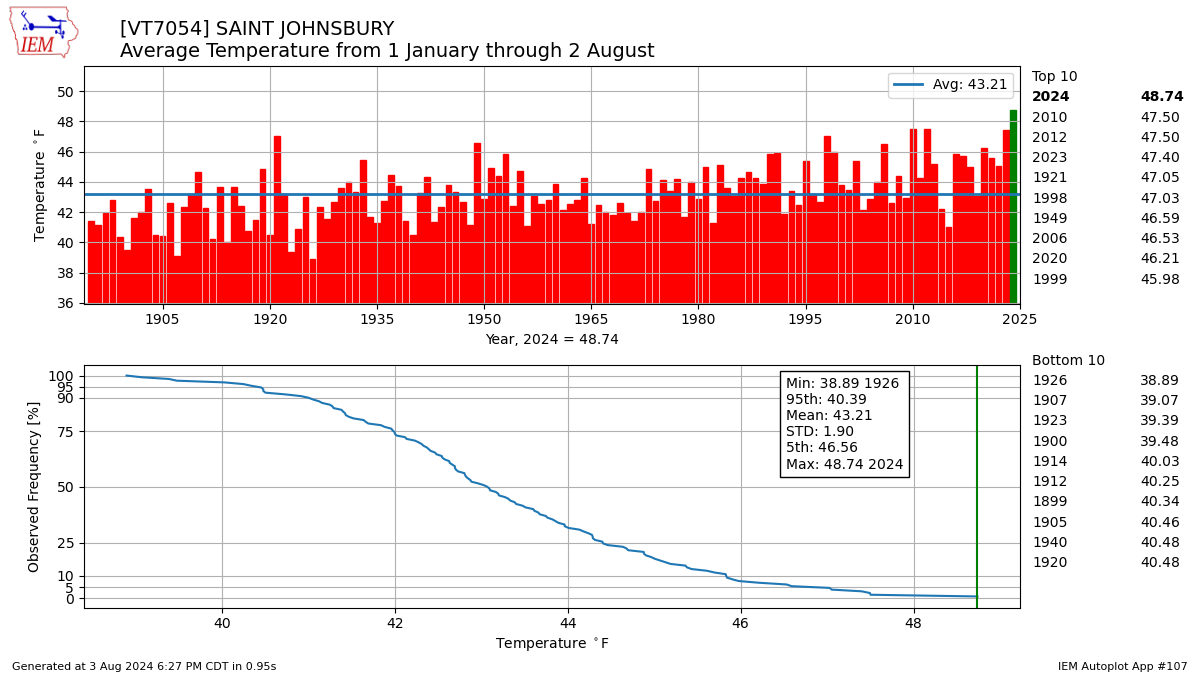
2024 running #1 warmest in Saint Johnsbury. Not unusual for interior northeast this year.

-
Area continues to tumble despite benign weather, as big Pacific losses continue. Clearly a 3 horse race now.
-
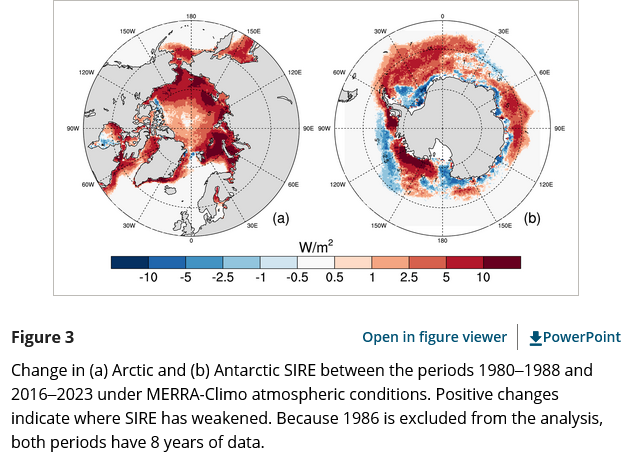
Per linked paper, the reflectivity of sea ice has decreased since 1980. SIRE in Figure below is sea ice radiative effect. The arctic decline has been steady, while the Antarctic experienced a regime change in 2016. "The planetary cooling effects of Arctic and Antarctic sea ice during 2016–2023 were about 20% and 12% less, respectively, than they were during 1980–1988. Disappearing sea ice is therefore amplifying climate change by causing Earth to absorb roughly an additional 0.3 W m−2 of solar power for each degree Celsius of global warming, a feedback that is stronger than that simulated by most climate models." https://agupubs.onlinelibrary.wiley.com/doi/10.1029/2024GL109608
-
Big area drop yesterday leaves 2024 #1. Area is jumpy and there was some flash melting ytday in the Beaufort that may come back to life in the next couple of days. Still this is turning out to be a big melt year. Key metrics like area and volume have been dropping fast since mid-June. Top 3 looking more and more likely.
-
With current spike in global temperatures, looking more and more like Hanson was right about a new record this year. We aren't seeing much of a drop in temperatures yet as we transition away from nino. Still clear of pre-2023 years.
-
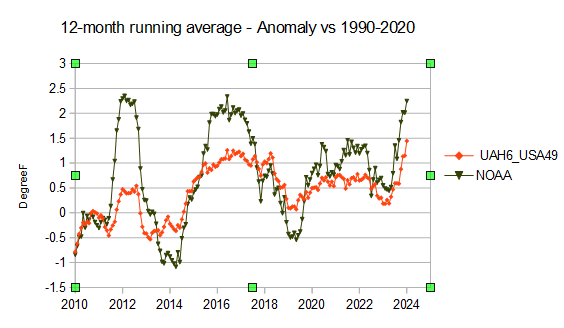
Looks like typical Martz BS. Martz chart doesn't match NOAA or UAH6 satellite data (below). He's missing a lot of warming. Even NOAA is underestimating warming since 2012 if UAH6 is right. Of course there is no info on how Martz calculates the US average temperature. As we've seen with your "county averages", plenty of options for errors or other mischief. Merely averaging the data will skew the results as the US network has shifted in time. Per chart above I doubt that Martz is using a proper station weighting; i.e, 3 stations close together shouldn't get the same weight as one that doesn't have any close neighbors. That will weight populated areas too heavily. Another reason to discount Martz chart: bias adjustments on modern stations are very small, there shouldn't be a big discrepancy between raw and bias adjusted. Bdgwx has posted charts showing how well the recent US station data lines up with rural stations that are carefully selected to track climate changes. Our Chester County deep dive has shown that the Chester County bias adjustments are completely justified. The Chesco COOPs were biased warm and the problems could be easily identified by comparing to nearby sites. Stations were moved out of towns to cooler locations, experienced time of day bias, and ran warm at times probably due to shelter/location issues with non-aspirated thermometers. Finally If Martz has good scientific evidence he should publish in a technical forum. As discussed above I doubt the chart would survive a peer review. In the para above he is using handwaving arguments. His statements on TOBS smack of complete BS. We know that stations experienced TOBS because the observation times are known. The impact of TOBS has already been established in published papers that are linked in this thread. Instead of producing evidence, Martz is using name calling . In short he's following the denier playbook: misleading analysis, faulty logic, no evidence, name calling, etc.