

chubbs
-
Posts
4,157 -
Joined
-
Last visited
Content Type
Profiles
Blogs
Forums
American Weather
Media Demo
Store
Gallery
Everything posted by chubbs
-
More evidence that it hasn't been this warm in at least 120,000 years. Paleoclimatologists can determine how long bedrock beneath a glacier has been covered by ice using measurements of specific isotopes. When rock surfaces are exposed, isotopes such as carbon-14 and beryllium-10 form due to bombardment by cosmic radiation. If, however, the rock is covered by an ice sheet, it is shielded from this radiation, and these unstable isotopes gradually disappear through radioactive decay (with half-lives of 5,700 and 1.4 million years, respectively). This method, known as cosmogenic radionuclide dating, has been well-established for decades. The new study applied this method to examine several glaciers in the tropical Andes. In rock samples collected at the edges of the glaciers, researchers found isotope concentrations close to zero. From this, they conclude that these rocks must have remained covered by ice throughout the entire Holocene, shielding them from cosmic radiation. This indicates that these glaciers are very likely smaller today than at any point in at least the last 11,700 years. The Andes are not an exception: according to current research, global average temperatures today are very likely higher than at any other point during the entire Holocene. Given that an ice age lasted for more than 100,000 years before the Holocene, today’s temperatures are probably the highest experienced in about 120,000 years. https://www.realclimate.org/index.php/archives/2025/03/andean-glaciers-have-shrunk-more-than-ever-before-in-the-holocene https://www.science.org/doi/10.1126/science.adg7546
-
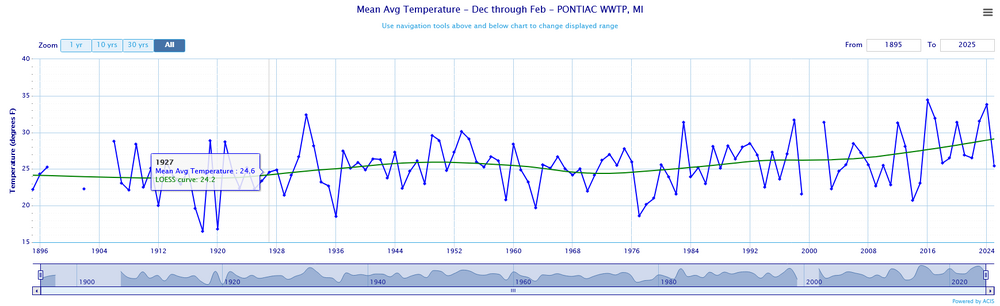
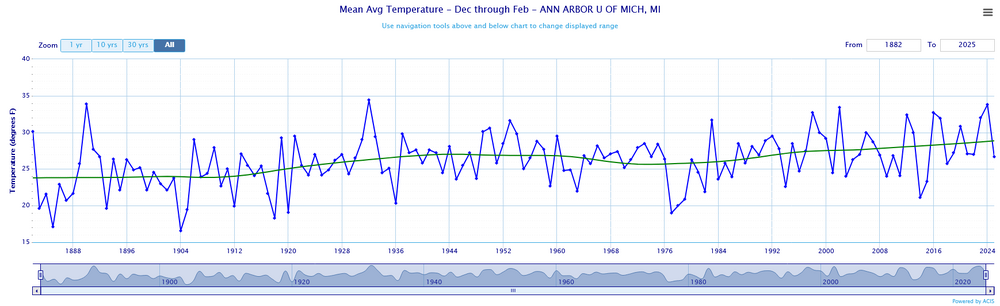
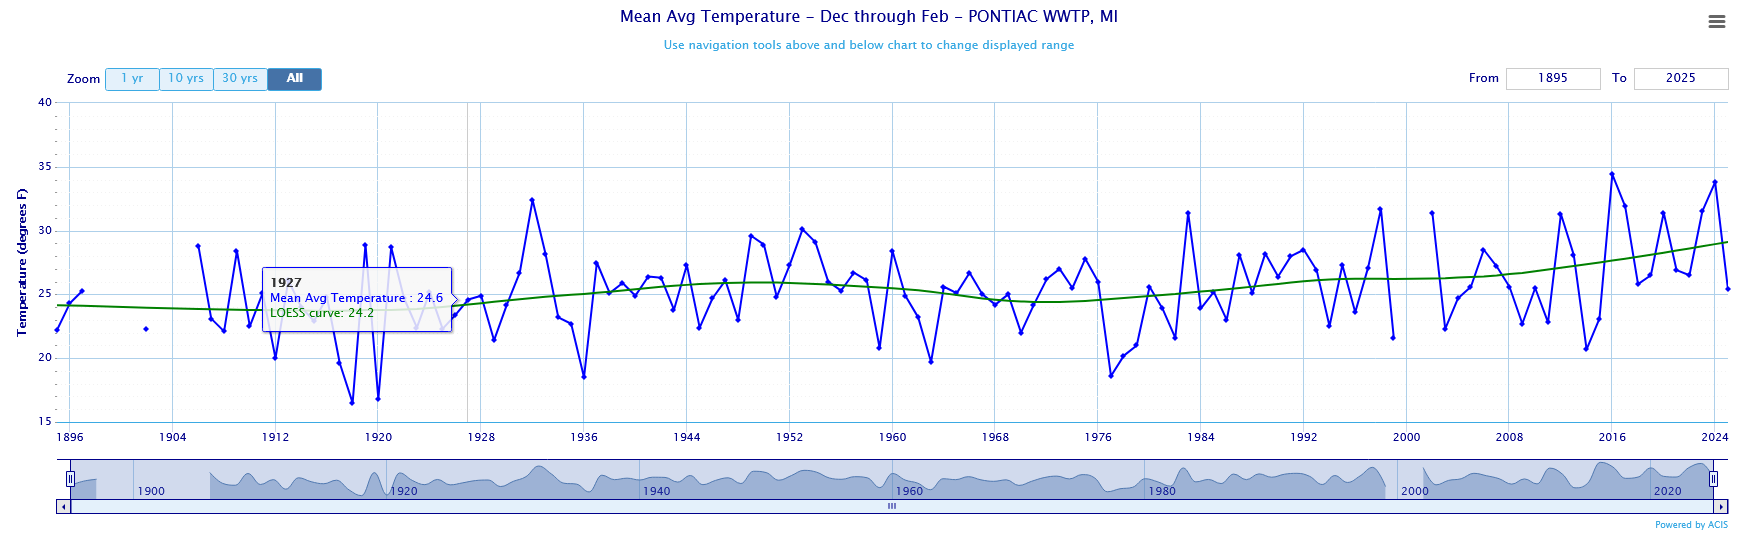
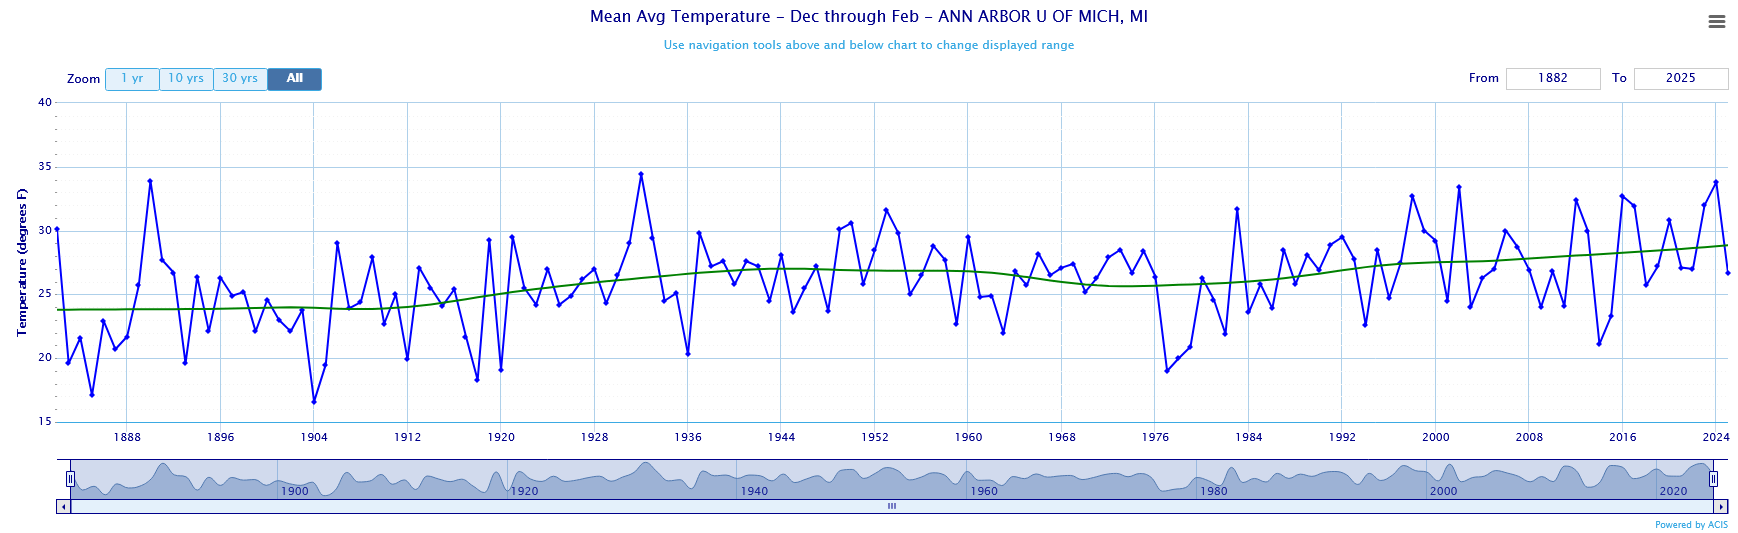
Here's the NOAA link. I choose the lowess fit because, as you noted, there are warm and cool periods before 1970 that aren't fit well by a straight line. The fit only uses the data points plotted in the NOAA series, i.e. 1895 and later. If there was any change before 1895 wouldn't be reflected in the Lowess fit. In a quick search, found 2 local stations with long-term data without the station moves in the Detroit series: UM at Ann Arbor and Pontiac. NOAA used these stations and many more for the Wayne County series. Weather data is correlated for hundreds of miles so stations outside of Wayne County provide useful information. I spent 3 years in NW Ohio 1978-81 so can attest to how cold midwest winters were 45 years ago. https://www.ncei.noaa.gov/access/monitoring/climate-at-a-glance/national/time-series
-
That's why I like NOAA (and other groups), who correct for inconsistency due to: station moves, measurement method changes, heat island, etc. Detroit winter warming looks very similar to other US cities.
.thumb.png.285d72e7c31237502af72478a8d7152d.png)
-
The Metro airport obs only go back to 1958. Prior data probably isn't representative of the airport.
-
Yikes, found this chart in Zeke's thread. Odds of a record this year have increased to 38% from 6% at the start of the year; and, it is possible that we have crossed 1.5C for good on the Berkeley Earth series.
-
Googled up this 2024 study which uses a large dataset of surface and subsurface measurements shown on map below. Greenland is warming rapidly, 0.7C per decade since 1985. The ice surface and subsurface is responding to the warming atmosphere: The observation-based ANN also reveals an underestimation of the subsurface warming trends in climate models for the bare-ice and dry-snow areas. The subsurface warming brings the Greenland ice sheet surface closer to the melting point, reducing the amount of energy input required for melting. https://tc.copernicus.org/articles/18/609/2024/
-
The recent nino jumps are bigger because man-made forcing is increasing more rapidly, mainly because air pollution is going down while greenhouse gases continue to increase.
-
The difference isn't that surprising because there are regional differences and 80N is a small part of the globe. Did take a quick look however. First, my chart is GISS. Found the chart below which compares: global, land and arctic warming. Here the arctic is 67N, not the same as the ar4ctic in your chart. Arctic warming didn't take off till around 1990, so there isn't much difference between global land/ocean and arctic for the 1970-94 period. Note however the much larger year-to-year variability in the arctic. That's one of the benefits of the global average, a good bit of the plus and minus natural variability cancels when averaged over the entire globe. The global land average turns out to be a good proxy for the Northeast US. Global land has warmed by roughly 1.5C since 1970, or 2.8F. Winter is the fastest warming season locally, roughly 50% more than the annual average, so the 5F of winter warming we have experienced is close to what would be expected based on the global land average.
-
Our winter temperatures are well correlated with global temperatures. When global warming accelerated around 1970 our winters followed suit, roughly 1F per decade winter warming in our region since 1970. The last 2 ninos have spiked global temperatures. We had a notable change in our winters after the last nino. It would not surprise me to see another shift after the recent nino. Not sure what the shift will be, given large variability in local winters and our new global temperature range. We pull our winters from a deck of potential outcomes. With each passing year we know less and less about the individual cards in the deck.
-
No I don't think "absolutely no current evidence" is right. First off the model results in the chart are evidence, the best evidence we currently have; and, second as stated in the paper the available limited measurement data supports the model results (quote below): "The remote reaches of the oceans that surround Antarctica are some of the toughest regions to plan and undertake field campaigns. Voyages are long, weather can be brutal, and sea ice limits access for much of the year. This means there are few measurements to track how the Antarctic margin is changing. But where sufficient data exist, we can see clear signs of increased transport of warm waters toward Antarctica, which in turn causes ice melt at key locations. Indeed, the signs of melting around the edges of Antarctica are very clear, with increasingly large volumes of freshwater flowing into the ocean and making nearby waters less salty and therefore less dense. And that’s all that’s needed to slow the overturning circulation. Denser water sinks, lighter water does not."
-
Another news article on the Antarctic Current study. Found this write-up, by the study authors, more insightful. Not good news, study predicts we are on the verge of a slowdown in Antarctic overturning. Also linked the study journal article. We’ve long known the North Atlantic overturning currents are vulnerable, with observations suggesting a slowdown is already well underway, and projections of a tipping point coming soon. Our results suggest Antarctica looks poised to match its northern hemisphere counterpart – and then some. https://theconversation.com/torrents-of-antarctic-meltwater-are-slowing-the-currents-that-drive-our-vital-ocean-overturning-and-threaten-its-collapse-202108 https://www.nature.com/articles/s41586-023-05762-w
-
What we did Advances in ocean modelling allow a more thorough investigation of the potential future changes. We used Australia’s fastest supercomputer and climate simulator in Canberra to study the Antarctic Circumpolar Current. The underlying model, ACCESS-OM2-01, has been developed by Australian researchers from various universities as part of the Consortium for Ocean-Sea Ice Modelling in Australia. The model captures features others often miss, such as eddies. So it’s a far more accurate way to assess how the current’s strength and behaviour will change as the world warms. It picks up the intricate interactions between ice melting and ocean circulation. In this future projection, cold, fresh melt water from Antarctica migrates north, filling the deep ocean as it goes. This causes major changes to the density structure of the ocean. It counteracts the influence of ocean warming, leading to an overall slowdown in the current of as much as 20% by 2050. Far-reaching consequences The consequences of a weaker Antarctic Circumpolar Current are profound and far-reaching. As the main current that circulates nutrient-rich waters around Antarctica, it plays a crucial role in the Antarctic ecosystem. Weakening of the current could reduce biodiversity and decrease the productivity of fisheries that many coastal communities rely on. It could also aid the entry of invasive species such as southern bull kelp to Antarctica, disrupting local ecosystems and food webs. A weaker current may also allow more warm water to penetrate southwards, exacerbating the melting of Antarctic ice shelves and contributing to global sea-level rise. Faster ice melting could then lead to further weakening of the current, commencing a vicious spiral of current slowdown. This disruption could extend to global climate patterns, reducing the ocean’s ability to regulate climate change by absorbing excess heat and carbon in the atmosphere. https://theconversation.com/melting-antarctic-ice-will-slow-the-worlds-strongest-ocean-current-and-the-global-consequences-are-profound-251053
-
Interesting, Berkeley Earth has estimated land temperatures back to 1750. How far back they go in a region depends on the availability of measurements. Below is Pennsylvania where the first available measurement is 1758. Berkeley's estimates for the US as a whole go back to the early 1800s. Berkeley's results are similar to those you obtained from GROK. It has been flat or warming since the 1700s with the bulk of the warming in the past 60 years. The Berkeley uncertainty estimate increases going back in time as the number of available measurements shrinks.
-
Yes ice sheet movement has been well known. This finding concerns the nature of the flow at the very bottom of the ice sheet in an area that is flowing relatively quickly. Impacts how quickly frictional forces increase as flow increases.
-
Of course science isn't settled, but when it comes to climate change most of the new scientific findings aren't positive. Here's a new finding from Greenland. The bottom of the ice sheet isn't frozen in place. Which means there is less resistance to movement, not good news in a warming world. https://www.science.org/content/article/hole-drilled-greenland-s-heart-reveals-ice-ready-slide-sea
-
Didn't know whether to laugh or cry at these 2 para: Paul-Arthur Monerie, lead author of the research at the National Centre for Atmospheric Science at the University of Reading, said, "Until now, hurricane predictions have been like trying to see through a dense fog as we could only make out what was directly ahead of us. "Better forecasting clears that fog away, revealing patterns years into the future. This advancement gives coastal communities precious time to prepare. Our study shows hurricane activity is set to increase through 2030, giving everyone more time to prepare and protect themselves."
-
Arctic sea ice hasn't fully recovered from dip in late Jan/early Feb. A record low maxima looking more and more likely.
-
One problem: we haven't been in the current climate long enough to experience a full range of conditions. We don't know what a normal hurricane season is, or a 100-year flood. All of our experience is from a cooler climate that we don't have any more. Our future climate even more outside our range of experience.
-
Forgot to mention that geothermal heat could be more important regionally. The biggest area of concern is Antarctica, where geothermal heat flow could make portions of the ice sheet more vulnerable to climate change. This is being studied, as described in review article linked below. https://www.nature.com/articles/s43017-022-00348-y
-
Some quick thoughts. This write-up doesn't sound very scientific to me. With no assessment of the geothermal heat flow, there is no proof that geothermal energy had an impact on the points raised. Also geothermal hasn't been ignored. The role of geothermal in climate is an obvious scientific question that was answered a long time ago. I remember a geothermal being assessed as unimportant for climate when I was in school. Below is the geothermal para from the Wikipedia article on the earth's energy balance. It's as I remembered, geothermal is insignificant as a heat source for the earth's surface compared to the sun. Last year man-made forcing was estimated at roughly 3 W/m2 based on atmospheric concentrations of CO2, methane, other GHG, aerosols, etc. This is roughly 35 times all the energy from geothermal. Satellite measurements of the earth's net radiation i.e., what comes in from the sun vs what is radiated out in the infrared, matches the rate at which the oceans and the climate system are warming. So man-made GHG explains all of the warming that we are experiencing. Finally if geothermal energy from mid-ocean was an important source of warming, then the ocean would be warming from the bottom-up; but, instead, the ocean is warming from the top down. The surface is warming the fastest, followed by the mixed layer 0-100m, followed by 100-700m, and so on.
-
The data from Coatesville, near the center of the county, says you are presenting a misleading picture. This decade is the warmest in Coatesville, followed by the last decade. The adjusted values for Coatesville are a close match to the NOAA Chester County series. The adjusted data removes the bias introduced by station changes. By far the most impactful change is the post-WWII move out of the city of Coatesville to a cooler rural location.
-
Re the Mann vs Hanson discussion above, chart below (updated recently through 2024) shows how man-made forcing has increased in past decade or so leading to an increase in human induced warming. Link below has 2023 paper with details. Chart is for a 2024 update to the paper that is being prepared. https://essd.copernicus.org/articles/15/2295/2023/
-
Scientists have been looking at preindustrial climate impacts for a while. Burning, land-use change, and agriculture released GHG and aerosols and changed albedo. Not sure what the latest science says, but post-industrial impacts are much larger. Below is a 2021 write-up I googled up. https://www.globalpolicyjournal.com/blog/24/02/2021/ruddiman-hypothesis-debated-theory-progresses-along-interdisciplinary-lines
-
You make good points but I have a few bones to pick. I don't think silver bullet is the right word. Its never just one thing in weather/climate. Aerosols help explain the acceleration in temperatures in the past 15 years, but other factors had to align to produce a spike in 2023. I would not put much of the blame on science either. They have been ringing the climate alarm bell for a while and have long recognized aerosols as a key uncertainty. The lack of concern/urgency has caused aerosol science to be underfunded. Agree that climate's complexity make it difficult to deal with; but, also think our own human nature is important. We have certain attributes that get in the way of facing climate and certain other problems: short-term focus, self interest, greed, resistance to change, confirmation bias, denial, etc.
-
An interesting question. Stepping back don't think that Team Mann or Hanson are that far apart. They are still on Team Climate Science. Saw a chart recently, but can't recall where, so can't post, that showed that Hanson's yellow cone overlay the CMIP6 projections, i.e., acceleration is expected due to an increase in forcing. However, think that the Mann/IPCC team is losing unfortunately. As I will explain below. Hanson is right that aerosols are key for untangling our recent climate history. The chart below taken from a recent Climate Brink blog (link below) illustrates this. Aerosols have been masking the effects of CO2 and other GHG. There have been 3 broad GHG and aerosol forcing regimes (dates rough): 1) Pre-1970 where aerosols increased at roughly the same pace as GHG and masked almost all GHG warming, 2) 1970-2014 where aerosol emissions stabilized due to increasing clean air regulation allowing a steady rise in net man-made forcing (GHG+aerosols) as GHG continued to increase and 3) The last decade or so with decreasing aerosols which unmasked GHG in the atmosphere causing the rate of forcing to increase. We are now getting the effect of new GHG as they are emitted, plus the old GHG that had been masked. Temperatures have tracked forcing (warming rates and dates rough): 1) Before 1970 - stable, 2) 1970-2014: steady 0.18 increase, 3) Post 2014: 0.25+ per decade. Of course the regimes didn't change as suddenly and other factors have played a role as described in the Hanson paper: sun, volcanoes, shipping rules, etc. Hanson is also right that an increasing aerosol effect implies higher climate sensitivity when using recently observed temperatures to estimate climate sensitivity. However, there are other ways of estimating climate sensitivity, i.e, Hanson is underestimating the uncertainty in ECS. I don't see enough evidence that climate sensitivity is at the high end. What has happened though is the low end has been lost, ECS is not under 3, recent science and the acceleration in temperatures make that clear. My personal range is 3-4C per CO2 doubling. More important than climate sensitivity, it is clear that policy and emissions aren't following any IPCC scenario; and, with the election of Trump aren't likely to in the near future. We've made some progress on CO2 as the economic position of coal and renewables has changed, taking CO2 off the worst case path. However non-CO2 pollutants, aerosols (decreasing too fast), methane and N2O, are all on worst case paths and total net forcing is increasing at about the same rate as RCP85. The only good news is that the rapid increase in forcing is temporary, there are only so many aerosols to be eliminated. So where does that leave us? In a rapidly changing climate unfortunately. The masking effect of aerosols has fooled us and helped put us on a path that maximizes climate shock. We masked GHG warming for a long time while we slowly added GHG to the atmosphere. Now we are unmasking at a relatively rapid rate, without serious emission control. A dangerous policy combination. We are headed toward our climate future at an accelerating rate, while at the same time not preparing for the consequences. Buckle up. https://www.theclimatebrink.com/p/exploring-the-drivers-of-modern-global

.png.c9c7ca1b3ad03736cade59f1e7d72fc9.png)

