
40/70 Benchmark
-
Posts
73,398 -
Joined
-
Last visited
Content Type
Profiles
Blogs
Forums
American Weather
Media Demo
Store
Gallery
Posts posted by 40/70 Benchmark
-
-
3 hours ago, weathafella said:
So let’s harken back to the gtg at Funky Murphy’s in Worcester in early January 2015. I drove pickles to and back. The pattern was progged to change big time but the wx that day was snow eating foggy mild drizzle. There wasn’t much snow to eat but Worcester had a bit. BOS was way down on seasonal snow and futility was on the table-must have been well under 5 inches at that point. I pointedly asked Will what his best guestimate for BOS final seasonal total. Pickles can vouch for this. Will comes up with 53 inches. Pickles and I are talking about what a bold call that was on the ride home. Will was wrong. BOS ended up with 110 and change. Keep hope alive!
I never waivered from my seasonal that year....it was my first one. I was taking some serious shit from scooter when things looked bleak in January...I think I had 80-90" in Boston. I was nervous, but wouldn't budge.
I ended up low.
-
.19" today in the new Straus...up to .47" on the month.
Hi of 43.7, now down to 37.6
-
8 minutes ago, Zeus said:
Good luck up there, boys,
Where are you? YOU are MISSED
-
 1
1
-
-
44 minutes ago, powderfreak said:
You look good on that run. I like being where the QPF gradient is, that's often where mid-level banding finds itself for whatever reason. That QPF map leads one to envision a band paralleling the Maine coastline somewhere on the Plain, and then curling into SNE. Good slug of precip to it's east and a sharper than modeled drop off to its west.
Its bc the model QPF is mainly from low level fronto, as it struggles with mid levels, which is usually what occurs near edge of low level QPF field. But we need the mid levels to get going a touch sooner in order to toss the moisture back there.
-
1
-
-
Just now, ineedsnow said:
GFS increased snow amounts a bit and looked really close to being much better
Will probably jump at 00z
-
1
-
-
10 minutes ago, forkyfork said:
like, why even bother being on a weather board? go stare at a wall and chew on glass or something
Why get a meteorology degree if you're not going to be a meteorologist?
-
 1
1
-
 7
7
-
-
2 minutes ago, forkyfork said:
i don't understand how so many people who have tracked these things for years cannot learn that models change
Emotions can be blinding.
-
3 minutes ago, OceanStWx said:
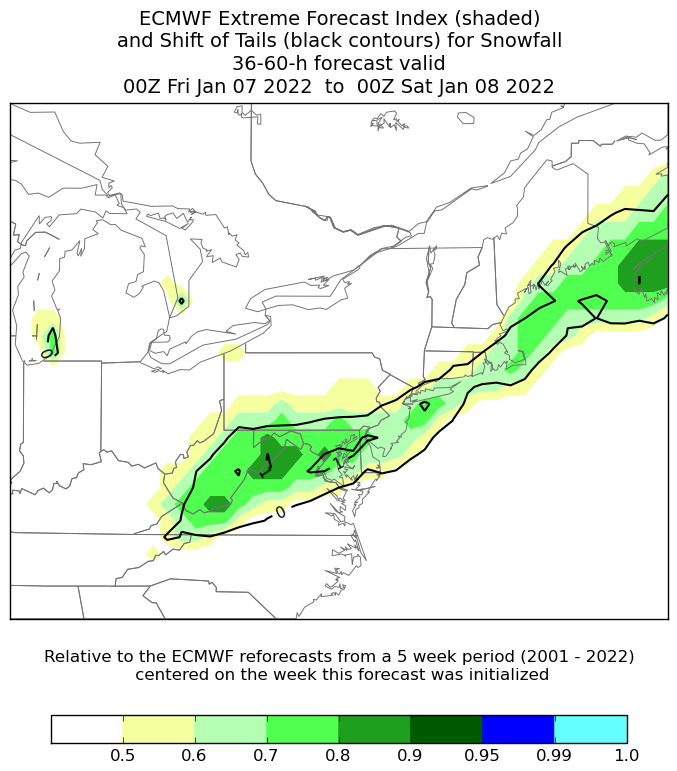
There's some good news I guess. Based on the 00z EPS, the extreme forecast index is okay for the AEMATT crowd.
This index essentially shows how unusual the EPS forecast is based on the last 20 years of the model climate in the 5 weeks centered on the date (the climate built by many model runs, not state of the climate according to the model). Values between 0.5 and 0.8 are unusual, above 0.8 very unusual or extreme. A value of 1 means that every EPS member is more extreme than the model climate.
The thing to keep in mind is that significant snowfall, even in the winter, is unusual. Most days it doesn't snow. But there is a signal for some significant impacts possible according to the EPS.
Also note that this index doesn't say how extreme. It could be a little more extreme than the model climate, or a lot more extreme. That's where the black lines come into play, that's the shift of tails (SOT). A value of 1 indicates that the 90th percentile of the forecast is one times the distance between the 90th and 99th percentile of the model climate. A value of 10 would be ten times. A SOT appears when at least 10% of EPS members are forecasting an event greater than the model climate extreme. Say the model climate extreme is 6 inches and the difference between the model climate 90th and 99th percentile is 1 inch, with a SOT value somewhere between 0 and 1 (call it 0.5) this 90th percentile forecast would be 6.5 inches.
Notice how the SOT values are higher and the EFI higher down around DC. That's because snow is more extreme in that area than New England, and more likely to be an extreme event based on forecasts.
More like se MA.
-
13 minutes ago, Baroclinic Zone said:
52.7F was the high. Currently 50.8F
37.2 for a high IMBY....36.9 now
-
7 minutes ago, 40/70 Benchmark said:
I think the totals on that 3km NAM are underdone from the Berkshires up through the chicken coops...come H7 banding out there that run.

Notice H7 closed off over the upper cape at this point....
-
1
-
-
1 minute ago, Damage In Tolland said:
Hello mate
Lets see after 00z....if we develop a consensus around that look, then I would change my map much tomorrow.
-
That run is 6-12" back to the NY border.....10"+ pretty isolated.
-
3
-
-
I think the totals on that 3km NAM are underdone from the Berkshires up through the chicken coops...come H7 banding out there that run.
-
2
-
-
Just now, Baroclinic Zone said:
3km NAM definitely looks more realistic from ULs to surface.
Totally...perhaps the higher res guidance is more adeptly resolving the intricacies of the convective processes.
-
1
-
-
3km is my 6-12" east, 3-6" west.
-
2
-
-
36.0 at home...nothing to lose.
-
I would hold off of any spiking until we see 00z continue this...off hour runs have been zonked.
-
3
-
1
-
-
1 minute ago, Baroclinic Zone said:
Still a hot mess on the surface though, verbatim
Not sure how this doesn't end up better at the surface

-
1
-
1
-
-
1 minute ago, ORH_wxman said:
It's def better than 12z by 39 hours...the stronger vortmax is offsetting the earlier trend of lower heights over us. It's pulling the system back in closer to the shortwave.
We're getting that curl.
-
Vort looks a bit more negatively tilted, too.
-
Just now, wxsniss said:
I think this comes in better than 12z
Through 36h, vort is more consolidated, looks more similar to 12z RGEM than 12z NAM
Yea, just noticing that.
Cool
-
Just now, HIPPYVALLEY said:
I almost prefer nothing instead of an inch or two because I’m enjoying the bare ground for a number of reasons.
I mean, I’m totally on board with snow if there’s enough for me and the kid to ski or sled on.I got one last rake in on Monday after the last bit of snow had melted.
-
1
-
-
2 minutes ago, ORH_wxman said:
Might be some bridge-jumping this run....it looks even flatter than the clunker 12z solution.
I had my melt when I realized the 6-12" ship had sailed.
I'm shifting to the long range lol
-
1
-
-
3 minutes ago, CoastalWx said:
Long range lookin' nice.
Its harder to fail when its a pacific rooted pattern.
-
1
-


Tracking Jan 7 coastal storm. Lingering compression/flow velocity has not lent to consensus, but it seems at 30 hours out.. finally?
in New England
Posted
Euro, RGEM and uncle have it, too.