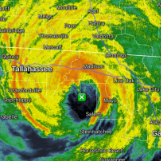
NorthHillsWx Posted 9 hours ago Share Posted 9 hours ago 2 hours ago, NavarreDon said: Prelim write up by MOB. https://x.com/nwsmobile/status/2110188812181860806?s=46&t=0ZvB_AF2VfA6c0SDxf53yA . That inland 118 in Jay is pretty incredible id almost say unbelievable if it wasn’t for the 114 recorded nearby. Not surprisingly the wind damage in those areas is devastating 3 Link to comment Share on other sites More sharing options...
vortex95 Posted 9 hours ago Share Posted 9 hours ago 16 hours ago, PhiEaglesfan712 said: Quite frankly, those things should have been thrown by the wayside after 2005. That decade from 1995-2005, especially the last 3 years (03-05), is a hyperactive stretch that we are unlikely to see again. What to see how much of an outlier 2004 and 2005 were for major HU totals and those that had a CONUS landfall as a major? 3 of 32 hurricanes in the Atlantic had a U.S. major landfall 1995-2003, 7 of 13 2004-2005, and 0 of 29 from 2006-2016. This underscores how recency bias is something not to fall prey to. Recall how after the 2004-05 season, it was widely promoted, "this is the new normal an how it going to be going forward." And then you got the longest major hurricane CONUS landfall gap on record (11.5 years). Did you hear this good news ever promoted in the MSM? Sure, since 2017 it has been very active, but that is normal as well in the big pix. Up and down TC cycles occur in every permutation possible over the long-term. Point being is that using short-term snapshots in wx as climatological avg/mean/changes is severely flawed and should not be done. The cognitive shortcomings present in human psyche are unfortunately often taken advantage of to skew reality. We can all relate to this at one time or another! 2 Link to comment Share on other sites More sharing options...
vortex95 Posted 8 hours ago Share Posted 8 hours ago 16 hours ago, LongBeachSurfFreak said: Next year likely Nina, building OHC with this years lack of activity. Unless the Sahel is entering a new period of enhanced desertification (possible and would explain amount of dust the last few seasons) I fully expect the next two seasons to be hyperactive. . Very strong El Nino does not guarantee a big Atlantic rebound TC season the next. 1983 is the lowest ACE season in the satellite era. 1992 was sig below avg ACE (76) and had only one major HU. Yes, that was Andrew, but one high-impact landfall does not change the overall Atlantic season as to historical avg. Outside of very strong El Nino? 1977 was weak El Nino and ACE of 25 - the 2nd lowest ACE in the satellite era. 1978 ACE (neutral ENSO) was 63. 2013 ACE was only 36 (neutral ENSO) and 2014 ACE (weak El Nino) was 67. Also, very strong El Nino is not always followed by La Nina. 1991 very strong El Nino was followed by weak El Nino 1992. Finally, El Nino and La Nina are not just polar opposites due to the non-linear responses of the ocean. And there are no less than a dozen other atmospheric oscillations going on around the globe at the same time, all interacting and in various states. 2 Link to comment Share on other sites More sharing options...
vortex95 Posted 8 hours ago Share Posted 8 hours ago 2 hours ago, NorthHillsWx said: Isaias (2026) now stands alone in NC history as the largest tornado outbreak in the states history with 13 confirmed tornadoes on Sunday! The early calls for this being a prolific tornado producer were validated Do you mean "largest TC tornado outbreak in the states history? B/c you have non-TC events like this. https://www.spc.noaa.gov/climo/reports/110416_rpts.html I count 14 NC tors from the 2020 Isaias. Link to comment Share on other sites More sharing options...
NavarreDon Posted 7 hours ago Share Posted 7 hours ago That inland 118 in Jay is pretty incredible id almost say unbelievable if it wasn’t for the 114 recorded nearby. Not surprisingly the wind damage in those areas is devastating We just got power back on our street in Navarre. Many in our subdivision (one of the largest in the state) are not as fortunate. Places in the N part of Santa Rosa county will be waiting even longer. . 1 Link to comment Share on other sites More sharing options...
LongBeachSurfFreak Posted 6 hours ago Share Posted 6 hours ago Very strong El Nino does not guarantee a big Atlantic rebound TC season the next. 1983 is the lowest ACE season in the satellite era. 1992 was sig below avg ACE (76) and had only one major HU. Yes, that was Andrew, but one high-impact landfall does not change the overall Atlantic season as to historical avg. Outside of very strong El Nino? 1977 was weak El Nino and ACE of 25 - the 2nd lowest ACE in the satellite era. 1978 ACE (neutral ENSO) was 63. 2013 ACE was only 36 (neutral ENSO) and 2014 ACE (weak El Nino) was 67. Also, very strong El Nino is not always followed by La Nina. 1991 very strong El Nino was followed by weak El Nino 1992. Finally, El Nino and La Nina are not just polar opposites due to the non-linear responses of the ocean. And there are no less than a dozen other atmospheric oscillations going on around the globe at the same time, all interacting and in various states. Allot of the seasons you are referencing were during the low frequency period of the AMO so they really aren’t applicable. Regardless we’ll see, I’ll have high number in my forecast for next season regardless. . Link to comment Share on other sites More sharing options...
LibertyBell Posted 1 hour ago Share Posted 1 hour ago On 10/11/2026 at 11:59 AM, vortex95 said: One historical item concerning sting jets. It likely that HU Edna in Sep 1954 when crossing Cape Cod in a very strong PT/ET transition (110 mph at landfall) had a sting jet. Why? BOS gusted to 101 mph out of the NW -- its highest gust on record! 10 days before HU Carol (115 mph at landfall) produced a gust to 100 mph at BOS out of the SE as the storm passed to the W, which is what you would expect for very high winds. When HUs get to New England, the PT/ET transition is almost always ongoing and the typical cooler/more stable air NW of the center along w/ rapid forward motion that will reduce winds W of the track. I always wondered how such a wind gust occurred in BOS from Edna from that direction. Once the concept of the sting jet became front and center about 20 years ago, that explained it! In the larger TC picture, Isaias in some ways is a watershed event. From strictly a conventional satellite perspective (EIR and Dvorak), that much deep convection not all sheared N and NE of the center near/at landfall, that says it was still more tropical than not, and can be called a HU at landfall. However, the SAR imagery tells a much different story! It's overall elongated wind structure, a string jet present, and the lack of a coherent inner core says it was more PT/ET. Other factors stating it was more PT/ET? That abrupt rise in center pressure in a short time before landfall (something obviously happened at the core here) and the rather cool surface conditions directly ahead of the storm. This shows it was not just a race for cooler/drier air trying to wrap in from the W and NW. This less than favorable TC atmosphere was N and NE as well, and got ingested into the core before landfall. This is an excellent example how new technology reveals things we could never quite detect, or detected/quantify at all prior. SAR gives a very detailed wind profile of a TC when it is over water. And as we know, the wind structure is paramount as to if it is a TC or not (tight or spread out?, symmetrical or asymmetrical?) And it also makes us rethink what we thought we knew well, and adjust accordingly. This is good b/c the science is always evolving. Imagine when SAR-type imagery is available on geostationary satellites? That will revolutionize analysis and modelling for the current data sparse oceans. It is interesting you mention Edna. The greatest hurricane of that period was actually Hazel. How did it keep hurricane force winds all the way to Toronto and even 113 mph to NYC? Looks like 1846 had a similar hurricane to that that occurred on this date? On 10/13/2026 at 7:12 PM, vortex95 said: Yes, also recency bias - the cognitive shortcut that what has happening now or very recently has more significance/importance than what was prior. When you look at wx history and all regions of the world, you can find numerous focused regional wild periods for wx. Just for U.S. HUs? New England had 5 hurricane landfalls 1938-1960, and since 1991, none. People back then in the region would be like, "what the heck is going on?" and people now in the same region would be like "what's a hurricane?" FL is nothing new to wild periods: Hit by 5 category 4 hurricanes 1945-1950, 12 hurricanes 1941-50 w/ 6 major, and a record 13 landfalling hurricanes 1871-80. Or more general: From 1926-1969, 14 category 4/5 hurricanes had U.S. landfalls. For the period 1970-2016, only 4 category 4/5 hurricanes had U.S. landfalls. The 14 yr period 2006-19 had 3 CONUS major hurricane landfalls. This is the least for such a period since 1900. The most is 13 from 1915-28. In June 1886, 3 hurricanes made landfall in the U.S. No other June has had more than 1. The last June CONUS hurricane landfall was in 1986. This is the longest stretch w/o a June CONUS landfall on record. What the devil was going on in 1780 that made it so destructive? What were the water temperatures back then? I know our winters were historic back then because of a big volcano eruption in Iceland. By the way the climate has shifted away from east coast impacts and thats a long term shift . On 10/13/2026 at 8:50 PM, PhiEaglesfan712 said: Quite frankly, those things should have been thrown by the wayside after 2005. That decade from 1995-2005, especially the last 3 years (03-05), is a hyperactive stretch that we are unlikely to see again. And yet very few east coast landfalls. Actually zero. 7 hours ago, vortex95 said: What to see how much of an outlier 2004 and 2005 were for major HU totals and those that had a CONUS landfall as a major? 3 of 32 hurricanes in the Atlantic had a U.S. major landfall 1995-2003, 7 of 13 2004-2005, and 0 of 29 from 2006-2016. This underscores how recency bias is something not to fall prey to. Recall how after the 2004-05 season, it was widely promoted, "this is the new normal an how it going to be going forward." And then you got the longest major hurricane CONUS landfall gap on record (11.5 years). Did you hear this good news ever promoted in the MSM? Sure, since 2017 it has been very active, but that is normal as well in the big pix. Up and down TC cycles occur in every permutation possible over the long-term. Point being is that using short-term snapshots in wx as climatological avg/mean/changes is severely flawed and should not be done. The cognitive shortcomings present in human psyche are unfortunately often taken advantage of to skew reality. We can all relate to this at one time or another! We have seen a shift away from east coast hurricanes though and it's a long term shift that may be ACC related (stronger highs). 5 hours ago, LongBeachSurfFreak said: Allot of the seasons you are referencing were during the low frequency period of the AMO so they really aren’t applicable. Regardless we’ll see, I’ll have high number in my forecast for next season regardless. . How do you know the AMO isn't returning to its cold phase again? The warm phase as already lasted for 30 years. I think the drier years we've had the last two years indicate that change is now beginning. The AMO warm phase started in 1995. Its time is up. Link to comment Share on other sites More sharing options...
LongBeachSurfFreak Posted just now Share Posted just now How do you know the AMO isn't returning to its cold phase again? The warm phase as already lasted for 30 years. I think the drier years we've had the last two years indicate that change is now beginning. The AMO warm phase started in 1995. Its time is up. It’s not hard to research these days. Plus all bets are off with climate change regardless Multidecadal Oscillation (AMO) is not expected to end immediately, though scientists are actively tracking early signals that a shift could begin to take shape over the next few years. Link to comment Share on other sites More sharing options...


Recommended Posts
Create an account or sign in to comment
You need to be a member in order to leave a comment
Create an account
Sign up for a new account in our community. It's easy!
Register a new accountSign in
Already have an account? Sign in here.
Sign In Now