

Typhoon Tip
-
Posts
43,396 -
Joined
-
Last visited
Content Type
Profiles
Blogs
Forums
American Weather
Media Demo
Store
Gallery
Everything posted by Typhoon Tip
-
Feb 28th-March 1st long duration Miller B threat
Typhoon Tip replied to George001's topic in New England
Yeah...these progressive pattern embedded systems seem to do that a lot. They end up a day or so earlier than when they were originally picked up by the models, back when D10s -
Feb 28th-March 1st long duration Miller B threat
Typhoon Tip replied to George001's topic in New England
nyeaaah...it's not that virtuous. There's an ah-seeking affect there. No one in here is racing to make an accuracy report for their livelihood. You're right about the marginal aspect - but that's also evading there's some other fulfillment thing we do in this 'hobby' -
Feb 28th-March 1st long duration Miller B threat
Typhoon Tip replied to George001's topic in New England
In any case, we shouldn't ( imho ) impugn the Euro at all on this system. If may end up on the low end of the results ... but, it was the first to pump the breaks on a full bird Miller B bomb ... entering us into the last 4 days of consistent consternation. It wins for that alone. At least gets an honorable mention. That's not a failure really, when the other guidance also started showing similar hesitations and limitations... even though they are conserving more QPF after having conceded to what the Euro showed first. -
Feb 28th-March 1st long duration Miller B threat
Typhoon Tip replied to George001's topic in New England
You guys are obsessing over details like a carpet surfing crack addict hahaha. -
For what it's worth ... - the 00z GGEM is a subtle S/weak outlier compared to it's GEPs mean, but the whole mean seems - to me - as though it has too much negative interference. Not sure why that is...or if that assessment turns out correct. - the 00z EPS is a classic Miller B, but the low doesn't deepen so well post that commitment. Hmm prooobably owing to the attenuation of the total mechanical manifold of the system, which is a nod to GGEM but it may also be more correct if the GGEM does indeed prove just too heavy handed there. - the GEFs are doing the same thing, but the entire space is massively so much more powerful than either of the two above... it has to conserve that and ends up sufficiently strong enough to imply a major event (despite a weaker post commited Miller B take over) anyway. That's differential aspect has been consistent now for days on this event... Interesting. Just a fun note on that.. the blend of the 00z and 06z is quintessential. It's fast moving ... taking a Miller B from S Jersey to somewhere between Cape Cod and the BM in just 6 hours, but, ...the region's already been in decent front side overrunning for 6-9 hrs at that point. It's like a fast moving large system ...so it's still taking time to evolve thru by virtue of vastness. It just moves an Arklatex low ( meaning pwat rich) along a perfect climo trajectory. Damn, why does that have to be 120 hours, right?
-
Feb 28th-March 1st long duration Miller B threat
Typhoon Tip replied to George001's topic in New England
Showed up big time on the FOUS for Logon. .8” liq equiv -
Feb 28th-March 1st long duration Miller B threat
Typhoon Tip replied to George001's topic in New England
ha.. just call the whole thing 4-10 and be done with it. I guess it's it means there's no defined boundary between intervals but in that case you could have said 4-6 and "-"6-10 haha -
It really can't get more N than Cleveland ~ with what's going on above Lake Superior to W of Nova Scotia. It can't... That's impenetrable as it is modeled. If the models someway somehow veer the mid level circulation mode to the SW, than it could... until that happens, it cannot physically get N that approximate latitude. Which the 18z GFS is coming around to admitting that... but, it's also pressed really against that latitude... Which tells me, the correction vector is pointed more S-E. This run still depicts a major QPF event however, ...only stemmed by the fact that this is somehow a progressive system, despite having at least transitive exertion by the -NAO domain, as is in part evidenced by this... Granted, transitive means indirect and not directly opposing...so therein is wiggle room but jesus - it tries to evac this thing in like 10 hours. I wouldn't be shocked if future runs demo at least some deceleration ... we'll see on that speculation. But until that "barrier" jet gets modeled to not be there...this can only go just about due east from this location you see there. And the consequence of tunneling through the transitive ridge from NE S is with a lot of falling shit from the sky
-
Feb 28th-March 1st long duration Miller B threat
Typhoon Tip replied to George001's topic in New England
I haven't honestly been giving this thing much time... I didn't realize this was elevation dependent? ALB has issued headlines, but their layout is entirely constrained to the ridge lines. -
That may be so... no qualms employing that anticipation. In fact, it's highly likely. How much or how little? But I don't see a phasing source?
-
GEFs has also trended several mb weaker overall ... This isn't gonna be an easy ride. We still have the caveat wrt to the -PNA footprint/fast progressive nature to the flow to contend with. We are all aware that 'past performance doesn't dictate future performance' with these models, but I've never fully agreed with that sentiment. Partially? sure - but only in so far as every situation/scenario has to be considered for its own identity. The problem is... that identity is in the same family and families tend to share behavioral-related genetics. Heh... In this case, the modest transient exertion by the -NAO ...doomed the GFS' fancy wrt to the 28th. It seems reasonable to assume the same exertion will be in place as this thing is approaching - the key difference being, this one is wholesale more powerful upon ejection out of the SW... So how that resolves as it moves closer toward the terminus of the NAO exertion ( roughly where we are in space)... that's a "cloudy" picture. I am noticing the gap between the 3rd/4th principle S/W, and a new injection coming in from the W, is shrinking across the last several cycles. It seems this cycle has crossed a threshold where there is now some destructive interference being introduced into the whole circuitry of affairs, from that introduced source, that was not a part of previous run cycles. So yayyy ...another card player shows up for the deal. This higher error prone progressive pattern could morph all this ...if that gap narrows further and then it becomes dominant and we end up with something no one saw coming. Anyway, this 12z GFS deterministic run is selling less NAO exertion overall, and for that ... tries to make a run at a cutter.. .but ultimately fails - not before it is too late... and this ends up less than appealing to winter enthusiasm. right.
-
Fwiw, the operational GFS is a significant NW outlier compared to the evolution of it's ensemble mean. ...the latter of which, also fwiw, is a fantastic snow event implication from N PA thru NE.
-
Feb 28th-March 1st long duration Miller B threat
Typhoon Tip replied to George001's topic in New England
The NAM is in it's N-NW bias range ... but if it gets other support would naturally arouse confidence -
Seeing a repeating theme of very deep pressures spread around odd locations considering the synoptics … Again, I suspect as is/was the case in the GEFs, this may be owing to the very large latent heat ingest this system had access to when it emerges out of the Arklotex region.
-
I saw that too … a lot of light pillars with snow falling through them. Is that a thing ?
-
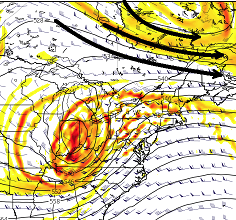
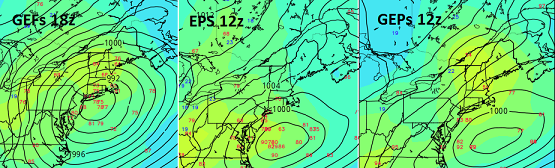
Alright ... let's try a different tact this go around. There is an important signal for the dates in the title, one that I would characterize as a medium impact for now, with both higher and lower correction potential. Firstly, I realize the villagers are bit edgy if not incensed by the debacle that's gone on in the models, wrt the 28th system. I mean I get it. Unfortunately, nature is not going to wait for you to get over it. The language contained is not intended to sell cinema here. It's should be treated as an early awareness, outline some observations for consideration regarding the 3rd/4th event. Technically being inside of 7 days ... (5.5 or so days 18z, and this is in shotgun sites of our region ...), this is not an atypical range to preliminary a threat assessment. That is what this is for. It is important to compartmentalize these recent disappointments as being unrelated to this prospect - because simply put ... they are unrelated to this prospect. I will be happy to come in here and add the operative adjectives should this evolve in a clear and obvious d-drip direction.. --------------------------------------------------------------------------------------------------------------------------------------------- Basic synopsis: A deeper more expansive full latitude trough than has been observed in recent weeks if not months, appears slated to be ejected out of the semi permanent -PNA nadir over the SW... resulting ultimately in a fast moving QPF loaded Miller A type low genesis and track that brings it to our doorstep by the end of the 3rd. It is lifting N out of the Arklotext region, which climatologically that's brought flooding problems in springs, owing to proximity to warm inflow/Gulf of Mexico moisture source, resulting in an enormous PWAT transport. We have ample cold on the N side of this particular low. Presently modeled in both the Euro and GFS operational version ... a cryo sufficiently cold air mass is in place across PA/NY NE England, back built by +PP in Ontario, already as this system is modeled to approach. The cold side of risks a hefty amount of liq equiv in S/IP/ICE over perhaps a 12 to 18 hour period. Models: You are all aware of the 00z, 06z, 12z, and this recent 18z blends of the GFS ... but for the sake of discussion: monster in that particular guidance source. Negatively tilted with over a 100kts of massively loaded jet transport. The exit/lateral/entry regions of this thing are extraordinary, even as it is being force by the antecedent and on-going -PNA footprint, to open up a dish pan trough structure when it cross through - again...as GFS is arranging things. This is the most intense version of this system I can find, moving the low track over central LI to SE Ma ~ targeting deep interior for goodly dose of IP/ZR and snow W_N The Euro made a pretty significant correction N... having about half to 3/4 of the GFS amplitude, targeting DC to NJ for a significant snow event. Perhaps the most use/telling are the ensemble means... The GEFs seem to parrot the operational version, having an impressively large deep solution that varied from SE Ma to the Benchmark over the last several cycles. The EPS has made significant attempt toward more structure, as has the GEPs... Perhaps someone can post those images ? All these are improving over cycles, with the EPS and GEPs making a more convincing lurch today. They also have an interestingly varied spread in intensity, with some of them getting rather exotic - this I feel owes to the incredible diabatic inject this system has as a ( really ...) early spring, deeper latitude origin, riding N into a cold antecedent/seasonal latency in place in our region. Hence the high ceiling potential. The "super blend" of these is almost a perfect scenario ... but that's likely just a present artifact of noise. Caveats emptors and the lower ceiling potential: 1 .. the -PNA footprint is raging through next week, and March 4. System ejected out of the west will need to supply ( most likely...) there own mechanical power to overcome being lift over the negative (NVA) aspect of the SE ridge. 2 ..In reality, I suspect some de-magnification shit will occur. ...I don't believe the GFS is necessarily right with 20" in Albany and 3" of sleet and ZR from Kevin to myself... But, the blend of the GEFS/EPS/GEPs is trending to a much, much more deeper full troposphere ejection through the W. As comparison, that's a much different animal compared to the over-sell that took place with the 28th and is also the biggest mass modality we've seen perhaps since Dec.
-
Feb 28th-March 1st long duration Miller B threat
Typhoon Tip replied to George001's topic in New England
I'm actually a heart full enough to hope NYC gets a band of moderate to heavy for 4 hours. -
Feb 28th-March 1st long duration Miller B threat
Typhoon Tip replied to George001's topic in New England
Y'all might wanna start entertaining the notion that this was just a model canard all along ...and the region may end up in a C-2"er when all's said and done. If you were to draw a trend line starting 3 days ago, ...it seems like such a line would end up down there... In fact, the trailing N/stream is buckling a bit more in the flow behind this ...whatever it is not - looks like a WAA IB that's over QPF populated by American guidance types at this point - looks more like it could be an interesting 2 hour burst... but I suppose to the two just get melded together as one ordeal. -
the 12z Euro closes the gap on the 4th about half way to the GFS' intensity and track. Still misses ...but clocks D.C. to NJ ... It's funny... I could see this coming into a consensus for that event, then... en masse, the same consensus then has to answer to the same destructive interference pattern and ends up wrong anyway? I mean we're not out of that meat grinder pattern then. The difference between it, and this 28th debacle... , is that the latter one is far more powerful as it ejects out of the S/W - which is one of the main problems with the 28th player. ..at this time anyway. The 28th is really teetering. It's on life support but not really dead. If more relays in over the next couple of cycles, then it may take it back into an Adv scaled ordeal.
-
Feb 28th-March 1st long duration Miller B threat
Typhoon Tip replied to George001's topic in New England
aH...that one... I remember that one. 24" forecast at bed time was 4" of grits -
Feb 28th-March 1st long duration Miller B threat
Typhoon Tip replied to George001's topic in New England
Oh my god... don't get me started. There was one... I wanna say 1987, late January. There was a 4th period ( 4th period!! ) blizzard watch issued. 'beep beep b'beep beep - beep beep b'beep beep,' "...THE NATIONAL WEATHER SERVICE, TAUNTON MASSACHUSETTS HAS ISSUES A..." started running along the bottom of the television main networks and TWC, every couple of hours, upgrading to a warning for some kind of dystopian cryo apocalypse. Turns of phrase like, "...RIVALING ANYTHING EXPERIENCED SINCE 1978..." I photo-fuckin'-graphically remember that, man! They had snow approaching 2 feet ... damaging winds ... power outages ... coastal flood where that was applicable... for what would amount to two straight days before hand. The storm was supposed to begin overnight and pretty much render society halted by the next morning ...all over central and eastern Mass/CT/RI... So I was at the gym playing in pick up games, basketball, on the eve of the all-mighty. I kept going out in between games to check the lamp light in the parking lot to see if it was starting. These random flakes began along side these big IP pellets. The sky was glowing that kind of butterscotch hue that you see at night when it's snowing hard, and I even thought at the time, '...better get finished and head home...' Another hour later it's like 9:15 pm and the gym's ( highs school) was emptying.. I left the energy of the gym to walk home, but entered a still eerily calm realm. And not like the 'calm before the storm' vibe, either ...More like 'something's not right,' kind of bad feeling. The glowing hue in they sky became dark around the horizons. I remember that when I was really little in western Michigan...when lake effect was ending ...or perhaps the band just shifted away... that city glow in the sky would remain over overhead, but turn black toward the horizons. I hated that... The snow never started back up once I saw that affect. But...thereupon that faithful walk home I opted to put it out of my mind ... similar ( actually) to how we tend to ignore the writing on the wall to this very day in this pass-time LOL... So I'm home and waiting patiently for Harvey Leonard's 11 pm. I knew he'd be leading the news cast as by then... the storm awareness and coverage was at an all-time fever pitch. Mind you, ... civility was only 9 years out of the Cleveland Super-Bomb, and the infamous Feb 5-7th Blizzard here in New England... It was sensy. As the credit were rolling ... Harvey pops in for the teaser, "Big big changes regarding our storm. I think you'll need to hear this" - I think a shot of raw battery acid must've flooded my tummy upon hearing those words... for I knew. Oh, I knew. Still, I tried to think, 'how can this be an even bigger storm if the horizons turned dark....?' haha So he comes on and the other shoe falls. "Looks to me, after studying the very latest guidance, like the worst of this will be down near the Cape and Islands, with far less impact as you go north west" ... ' I bet that wrong. It can't be ' There was at the time I crawled into bed 10 minutes later, still what amounted to epicosity warnings. Dawn breaks, partly sunny with stiff wind, 9F ...zero snow having fallen. Thank you for playing the 1980s state of the art weather modeling game! yee haw. Went from no school for a week, to get your ass dressed and walk in a gelid 9F face flogging wind, NOW! -
Feb 28th-March 1st long duration Miller B threat
Typhoon Tip replied to George001's topic in New England
You're not getting banned dude ( if you're not kidding..) But the 36 buns you earned on the thread opener ... beyond being a "10 top historic" achievement ... can you finally once and for all learn from that and the journey since? There is nothing wrong with having started thread for this concern. I did too - it was far more conservative, however. Even so...it was a bad call on my part - most likely... I went for a moderate event, with a possibility for more. Most likely, wrong. Anyway, threads should be started for anything that is interesting - the decision to pin this was not yours. That's on moderation... I think others are conflating pinned threads with access/success in storm entertainment - and that then puts them in a situation where they need to blame others... etc. But this isn't about the thread being composed. It's about the exotic hyperbole as though it really happening... I've tried to constructively encourage you with objective reasoning. But then when you reply to it, "...thanks, good advice, but I'll stick to my guns," in the face of the incontrovertible, that sounds like you're ... well, if you got an issue, we'll support you. We're compassionate. But if you don't and this your stubborn election to be cartoon fantasy monger in here - I think collectively most that enjoy this pass-time would rather not It might be time to reign things in a bit. -
Feb 28th-March 1st long duration Miller B threat
Typhoon Tip replied to George001's topic in New England
Today might be the biggest event until ...whatever fails (it feels inevitably) on the 4th. No, I'm in neg head hyperbole mode for fun - hope no one takes this too seriously. I plan to have fun the rest of the afternoon as a coping mechanism for this embarrassing circumstance. I mean, thousands of views, and hundreds over in posts and it just seems we should have known better - And I did. I just lapsed at the time (about 4 days ago) Everything I explained yesterday and today and the day before is true. The 12z Euro spelled it out in cinematic form, perfectly. Like I said, I blundered initially 4 days ago for allowing my self beguiled by that tsunamis of model runs that day. But the scaffolding for this thing was all wrong back then, and still is... And that stuff I've been calling "de-magnification" as a euphemism, was also true, all along. Forget why-for the models do that, they do - I drop the ball on awareness to that, too. Those two failures "constructively interfered" far better than any S/W could for this p.o.s., and I really fell asleep at the wheel. I was asked this morning what I thought this would be, if pistol was given a b.j., ...and I said Adv or less as the upper limit. I'm pretty much now okay with less, period. I just want to see this thing finally come around the bend into the SW and be fully ingested into the denser more physically realized sounding domain before just not coming in this thread any longer... -
Feb 28th-March 1st long duration Miller B threat
Typhoon Tip replied to George001's topic in New England
You know ...at this point, just for mordant humor it'd be funny to see this end up dim sun with dust ... essentially a blank showing, with 50 pages of a thread preceding. That - I think - would have to be the greatest magnitude achievement ever, in thread size to negative return ratio -
Feb 28th-March 1st long duration Miller B threat
Typhoon Tip replied to George001's topic in New England
We've managed to halve the 'Recent Browsing' count ... let's see if we can cricket this f'er by sundown tomorrow LOL


