

GaWx
-
Posts
19,132 -
Joined
Content Type
Profiles
Blogs
Forums
American Weather
Media Demo
Store
Gallery
Everything posted by GaWx
-
Hey Liberty, Don’t forget that Lakepaste is talking about global cooling since a year ago rather than for your area or even the US overall.
-
Hey Liberty, Why are larger crops in the Midwest a bad thing? I’ve never heard anyone say that before. Larger crops means more food for the world and also lower high temperatures there and probably somewhat downwind in summer.
-
“These oceanic heatwaves are not caused by man’s input into the atmosphere as Mr. Gore would like you to believe.” -Joe Bastardi in 7/26/25 Weather Bell free to everyone “Saturday Summary” video I just heard it. He still insists it’s due to undersea volcanic activity. Edit: Later in the same video he showed numbers indicating the planet is 1/4 of a degree C cooler this July vs last July. Is this true?
-
The global avg air and sea surface temps, dew points, and sea level are all at or near record highs. OTOH, I don’t know about “the droughts” being the worst. Actually, widespread droughts in the Midwest have notably lessened in frequency and severity over the last 30 years due to increased crop sizes likely thanks at least partially due to climate change. Avg dewpoints there in summer have increased significantly.
-
In contrast, 1935-6 was one of the coldest for the E 2/3 US as a whole of any since 1895-6:
-
Today’s Euro Weeklies maintained an active Aug 18-24 with ~145% of 2005-24. That translates to ~13 of ACE being progged vs base of ~9. Should that week have ~13, that would imply the likelihood of an H somewhere in the basin. Where does this run imply would be the most likely general location of the track of this H? All highly speculative obviously but fwiw it suggests track may be from at or just N of N Leewards NW to either near Bermuda or W of that between Bermuda and NC and then recurving to between Cape Cod and 1000 miles E of there aiming toward Newfoundland. Midpoint of highest density of tracks starts at 20N, 60W. Then track points NW to 30N, 70W. Then NNE to 40N, 65W. Highest at risk from this prog ~Bermuda:
-
Euro Weeklies ACE for August 18-24 up to 140% of 2005-24 avg. Edit: Also note the green box in ATL is now larger than even the WPAC green box:
-
OHC plunge continues:
-
Absolutely horrible forecast for my area:GAZ118-260500- INLAND CHATHAM- INCLUDING THE CITIES OF GARDEN CITY, POOLER, AND SAVANNAH 549 PM EDT FRI JUL 25 2025 ...HEAT ADVISORY IN EFFECT FROM 10 AM SATURDAY TO 10 AM EDT SUNDAY... ...EXTREME HEAT WATCH IN EFFECT FROM SUNDAY MORNING THROUGH MONDAY EVENING... TONIGHT MOSTLY CLEAR. LOWS IN THE UPPER 70S. SOUTH WINDS 5 TO 10 MPH, BECOMING SOUTHWEST AFTER MIDNIGHT. SATURDAY SUNNY. HIGHS IN THE UPPER 90S. HEAT INDEX VALUES UP TO 112. WEST WINDS AROUND 5 MPH.SATURDAY NIGHT MOSTLY CLEAR. LOWS IN THE UPPER 70S. SOUTHWEST WINDS AROUND 5 MPH. SUNDAY SUNNY, HOT WITH HIGHS AROUND 101. NORTHWEST WINDS AROUND 5 MPH. HEAT INDEX VALUES UP TO 113. SUNDAY NIGHT MOSTLY CLEAR. LOWS AROUND 80. SOUTHWEST WINDS AROUND 5 MPH. HEAT INDEX VALUES UP TO 106 EARLY IN THE EVENING. MONDAY SUNNY WITH A SLIGHT CHANCE OF SHOWERS AND THUNDERSTORMS. HOT WITH HIGHS AROUND 100. CHANCE OF RAIN 20 PERCENT. HEAT INDEX VALUES UP TO 115. MONDAY NIGHT PARTLY CLOUDY WITH A SLIGHT CHANCE OF SHOWERS AND THUNDERSTORMS. LOWS IN THE UPPER 70S. CHANCE OF RAIN 20 PERCENT. HEAT INDEX VALUES UP TO 105 EARLY IN THE EVENING. TUESDAY MOSTLY SUNNY WITH A CHANCE OF SHOWERS AND THUNDERSTORMS. HIGHS IN THE MID 90S. CHANCE OF RAIN 50 PERCENT. HEAT INDEX VALUES UP TO 115.
-
Currently, the equivalent NOAA version of the PDO based on recent relationship to WCS is likely not far from -4. The record low monthly NOAA PDO through June of 2025 is ~-3.8.
-
2025 through July 21st in N Hem had third lowest ACE for the date back to 1971 with it behind only 1977 and 1998.
-
Report: Another Year of Record Heat for the Oceans
GaWx replied to donsutherland1's topic in Climate Change
Compared to the terrible 2023 near the FL Keys (red line), when there was a terrible record breaking longlasting (mid June to early Sept) coral bleaching, 2025 (black line) has been much tamer with barely any bleaching hours so far. It’s also been a good bit cooler than 2024. The reason 2023 SSTs were so hot there was a drought along with wall to wall sunshine to add to the background warming from GW: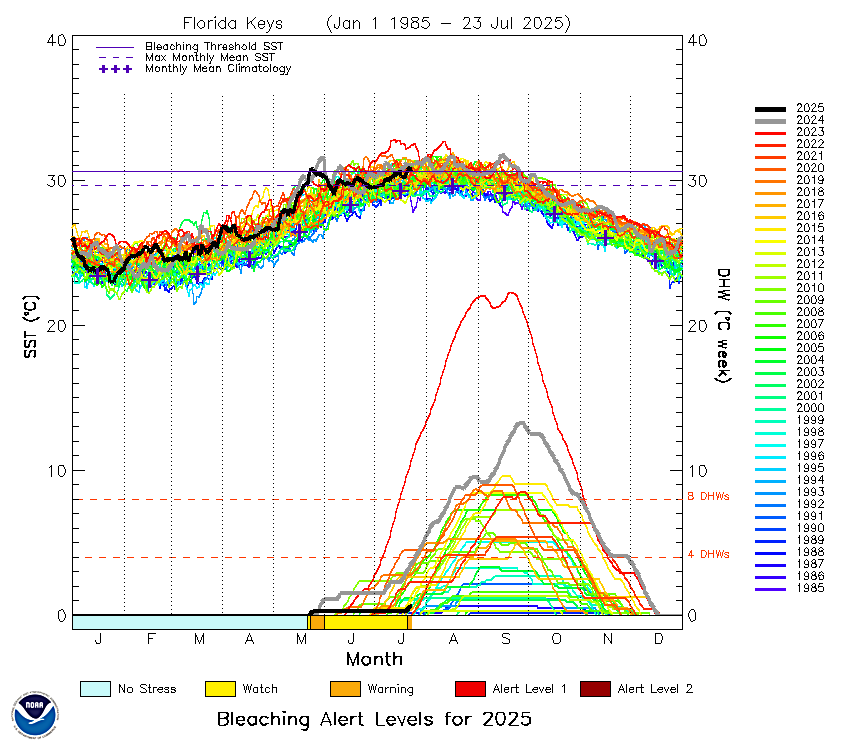
-
The OHC steep cooling over the last couple of weeks continues:
-
Absolute brutality will be coming early next week from Mother Nature if this forecast for my area verifies well:SUNDAY SUNNY, HOT WITH HIGHS AROUND 100. HEAT INDEX VALUES UP TO 110. SUNDAY NIGHT MOSTLY CLEAR. LOWS AROUND 80. HEAT INDEX VALUES UP TO 110 EARLY IN THE EVENING. MONDAY SUNNY WITH A CHANCE OF SHOWERS AND THUNDERSTORMS. HOT WITH HIGHS AROUND 100. CHANCE OF RAIN 30 PERCENT. HEAT INDEX VALUES UP TO 115. MONDAY NIGHT PARTLY CLOUDY WITH A SLIGHT CHANCE OF SHOWERS AND THUNDERSTORMS. LOWS IN THE UPPER 70S. CHANCE OF RAIN 20 PERCENT. HEAT INDEX VALUES UP TO 110 EARLY IN THE EVENING. TUESDAY SUNNY WITH A CHANCE OF SHOWERS AND THUNDERSTORMS. HIGHS IN THE UPPER 90S. CHANCE OF RAIN 40 PERCENT. HEAT INDEX VALUES UP TO 115.
-
From JB today fwiw: he likes to look at Euro AI ensemble members (ever since that product became available earlier this summer) vs EPS/GEFS and he’s also considering EPS’ MJO forecast: this period is before the increasingly active week that yesterday’s Euro Weeklies showed Day 15 06 z AI ends like this with a trough in the Tennessee Valley. and a spray of cyclones suggesting an east coast impact threat AI VV patterns in the 10-15 are bullish for the tropics which would mean a stronger rotation into phases 8,1,2,3 more so than the euro ensemble
-
Today’s Euro Weeklies had a large increase vs yesterday for the week covering 8/18-24. Yesterday’s run for 8/18-24: Today’s run:
-
Just some light rain, mainly this morning, so far today. Only about 1/10” today so far. Showers were moving in a somewhat unusual WSW direction from offshore.
-
I don’t think it’s accurate to say there’s no climate crisis from GW. The combo of the melting of land based ice flowing into the oceans as well as expansion of ocean water has been causing an accelerating rise of sea level. Also, higher dewpoint air being able to hold more moisture as well as a slight reduction of avg steering flow due to a reduced temp. contrast between the rapidly warming Arctic and the significantly slower warming of the tropics have combined to cause a notable increase in flooding rainfall events. That being said, not everything about GW has been bad. One great thing is that global food supply has increased markedly due to larger crops. This is due to longer growing seasons (longer period between freezes) accompanied by increased moisture and the ability to grow crops further north. In addition, plants have more CO2 to take in for photosynthesis. I’ll reiterate that had we instead of GW had the same amount of cooling, global food supply would be much, much smaller thus likely leading to starvation of at least hundreds of millions. Another mini-ice age would have been terrible.
-
It wasn’t Irene because that one didn’t occur til mid Oct. Sept. 27-30 definitely wasn’t from a TC per the NHC archives for 1999. There also was no TD then. However, with heavy rainfall like that, there likely was ample tropical moisture in the mix.
-
Hey John, Though this is very sad to hear, we thank you for taking the time to let us know. May your father rest in peace. Hopefully he’s now in a better place and that that hope gives you comfort during this difficult time. He was an extremely proud father for what you stood for as a NC Rep. His mainly clean, witty jokes made many of us laugh. He’ll be long remembered by many here for those and his love of following the weather among other things. He was til only very recently still moderating, a position he took seriously til the very end. For example, we could always depend on him as needed to pin a new thread and unpin an old one in a timely fashion. Sadly, he’s not here to pin this thread. @buckeyefan1 @stormtracker @Mr Bob @ORH_wxman @Wow
-
I had no rain during the daytime, but I’ve had light rain falling the last couple of hours along with some mainly CTC lightning/rumbling thunder. Total rainfall for today has been only ~0.05”.
-
This is referring to some of the remnants of Invest 93L coming over the Gulf again: Tropical Weather Outlook NWS National Hurricane Center Miami FL 800 PM EDT Tue Jul 22 2025 For the North Atlantic...Caribbean Sea and the Gulf of America: North-Central Gulf: A trough of low pressure on the southern end of a frontal boundary is currently located just offshore of the Southeastern U.S. coast. Over the next few days, this system is forecast to move west-southwestward into the north-central portion of the Gulf, where environmental conditions could allow for some slow development if the system remains far enough offshore. By this weekend, the system is likely to move inland, ending its chances for development. Regardless of formation, heavy rainfall could be possible for portions of the northern Gulf coast through this weekend. * Formation chance through 48 hours...low...10 percent. * Formation chance through 7 days...low...10 percent. $$ Forecaster Papin
-
Nino OHC plunging in mid July!
-
yes
-
I voted cooling. To this point extreme cold has killed more than extreme heat though heat related deaths are increasing. -4C cooling would be devastating to food supply, among other things, which could easily kill hundreds of millions. GW has lead to increased crop sizes to this point.


