GaWx
-
Posts
19,894 -
Joined
Content Type
Profiles
Blogs
Forums
American Weather
Media Demo
Store
Gallery
Everything posted by GaWx
-
Some good news. Compared to the 5AM NHC forecast, it has weakened quite a bit more quickly than forecasted then. The 5AM had Idalia still with winds of 100 mph as of 2PM. But as of 1PM, winds were already down to 80. The 11AM had adjusted for this quicker weakening because it was already down to 90 then. This updated forecast had it weakening from 90 at 11AM to 75 at 8PM. But with it already down to 80 at 1PM, it appears that it is weakening even more quickly than the 11AM NHC forecast. Edit: down to 75 at 2PM vs the 11AM still having 75 at 8PM
-
Hurricane Idalia Tropical Cyclone Update NWS National Hurricane Center Miami FL AL102023 1000 AM EDT Wed Aug 30 2023 ...DAMAGING WINDS SPREADING INTO SOUTHERN GEORGIA... ...1000 AM POSITION UPDATE... NOAA radar data indicate that the maximum sustained winds are now near 105 mph (165 km/h) with higher gusts. The estimated minimum pressure based on surface observations is 964 mb (28.47 inches). A sustained wind of 39 mph (63 km/h) with a wind gust to 63 mph (102 km/h) was recently reported at the airport in Valdosta, Georgia. An unofficial automated observing site at Madison High School in Madison, Florida, reported a wind gust to 67 mph (108 km/h). SUMMARY OF 1000 AM EDT...1400 UTC...INFORMATION ---------------------------------------------- LOCATION...30.5N 83.3W ABOUT 5 MI...10 KM ENE OF MADISON FLORIDA ABOUT 25 MI...40 KM S OF VALDOSTA GEORGIA MAXIMUM SUSTAINED WINDS...105 MPH...165 KM/H PRESENT MOVEMENT...NNE OR 20 DEGREES AT 18 MPH...30 KM/H MINIMUM CENTRAL PRESSURE...964 MB...28.47 INCHES $$ Forecaster Brown/Stevenson
-
Hurricane Idalia Tropical Cyclone Update NWS National Hurricane Center Miami FL AL102023 900 AM EDT Wed Aug 30 2023 ...CATASTROPHIC STORM SURGE OCCURING ALONG THE COAST OF THE FLORIDA BIG BEND AND DAMAGING WINDS SPREADING INLAND OVER NORTHERN FLORIDA... ...900 AM POSITION UPDATE... NOAA radar data indicate that the maximum sustained winds are now near 110 mph (175 km/h) with higher gusts. The estimated minimum pressure based on surface observations is 957 mb (28.26 inches). An automated weather station at Perry Airport recently reported a sustained wind of 62 mph (100 km/h) with a gust to 85 mph (137 km/h) within the past hour. A Florida Coastal Monitoring Program tower located near Perry, Florida, recently reported a wind gust of 81 mph (130 km/h). A NOAA National Ocean Service tide gauge at Cedar Key, Florida, recently reported a water level of 6.8 feet above mean higher high water, which is an approximation of inundation in that area
-
If not there, Perry has gotten close. CNN has been showing major live oak tree damage, including whole trees being knocked down. Some of these huge trees are likely at least several hundred years old.
-
Yes, this is a good point that I'm aware of. So, I realize that getting close to +2 for OHC would be best to get really good OHC support for a super Nino. So, do I think we have a decent chance to get close to +2 by, say, November? Yes, I do. Look how fast it has rewarmed over the last month! And there appears to be much more warming to come over the next ~3 months.
-
It likely will be THE worst in recorded history for Valdosta and nearby areas in a SW to NE corridor. Whereas it won't be the worst on record closer to the GA coast for wind, rain, or surge, it could very well end up being one of the worst on record there for winds for a storm coming up over land from the Gulf. That's why I'm concerned about what's to come here, especially ~3PM through 10PM. At a minimum, I expect to lose power for an extended period. I'm concerned about large branches and possibly whole trees coming down. Edit: I'm also concerned about isolated tornadoes from the outer feeder bands as they come ashore.
-
With a Keaton Beach landfall (south central Taylor County), the winners from the 0Z runs are the UKMET and ICON (just about perfect). The Euro was ~10 miles too far left/NW. The GFS and CMC were ~30 miles too far left/NW.
-
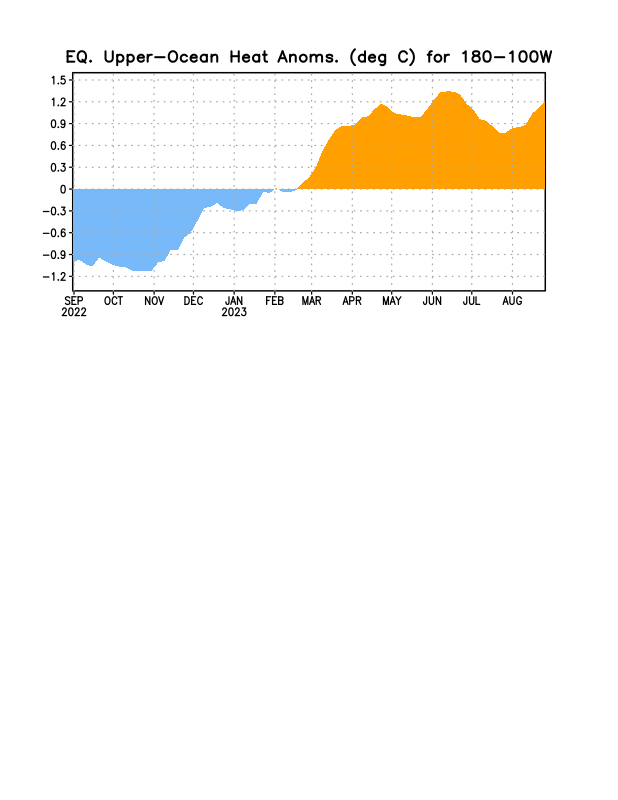
Right on cue the OHC is now rapidly bouncing back with it already approaching +1.20! This map is as of ~August 25th. It wouldn't take a heck of a lot to reach a new high in Sept. On average in a one year Nino, the OHC doesn't peak til November. So, there's plenty of time for OHC warming to continue. This rise would help to support the super Nino peak I've been expecting since the JMA went that warm on its most recent run earlier this month:
-
The 0Z UKMET has a new TC forming in the far SE MDR at hour 78. This is for the AEW following the current E MDR orange. What's notable about it is that it is quite aggressive considering how conservative it usually is. It has it down to 999 mb at 168 hours at 12.9N, 40.7W, moving steadily WNW. That means it could threaten the LAs in 10 days. What should be concerning to the LAs is that the Euro has something similar along with notable members on the last several EPS runs. In addition, the GFS, CMC, and ICON have it though it looks to recurve on those: 0Z UKMET NEW TROPICAL CYCLONE FORECAST TO DEVELOP AFTER 78 HOURS FORECAST POSITION AT T+ 78 : 9.7N 15.4W LEAD CENTRAL MAXIMUM WIND VERIFYING TIME TIME POSITION PRESSURE (MB) SPEED (KNOTS) -------------- ---- -------- ------------- ------------- 1200UTC 02.09.2023 84 10.3N 17.7W 1007 46 0000UTC 03.09.2023 96 10.9N 19.0W 1007 34 1200UTC 03.09.2023 108 12.1N 22.9W 1008 30 0000UTC 04.09.2023 120 11.6N 26.7W 1008 28 1200UTC 04.09.2023 132 11.7N 30.9W 1007 35 0000UTC 05.09.2023 144 11.7N 34.9W 1004 36 1200UTC 05.09.2023 156 12.2N 38.1W 1001 38 0000UTC 06.09.2023 168 12.9N 40.7W 999 46
-
-0Z CMC as expected in correction mode shifted vs the 12Z to the right significantly (~50 miles) to far NW Taylor County -0Z ICON vs 18Z shifted very slightly left (~5 miles) to SE Taylor County -0Z GFS vs 18Z shifted left 15 miles into far NW Taylor County -0Z UKMET about same as 18Z in south central Taylor County -0Z Euro vs 12Z shifted 20 miles right to C Taylor County *Edited to add Euro
-
The more reliable models are pretty tightly centered on Taylor County, FL, landfall centered on ~9AM EDT. Then tracks go mainly just inland from Savannah, which is about the worst possible track regarding winds. Also, high tide there, which is an astronomical high tide due to perigee and full moon, is at 8:30PM, which is near the time of the center being closest.
-
Taylor County is best bet per models. But it has ~45 miles on the Gulf. So, pretty large. And a lot of swamp/marsh. Good luck with that!
-
Nearly unanimous Taylor County landfall centered on ~9AM EDT. Then it tracks go mainly just inland from Savannah, which is about the worst possible track in terms of winds. Also, high tide there is an astronomical high tide due to perigee and full moon and it's at 8:30PM, which is near the time of the center being closest.
-
18z UKMET has like the 18Z Euro shifted its landfall 15 miles SE along with the remaining SE US track. The 12Z UK landfall was in C Taylor Cty and the 18Z is in S Taylor Cty. Also, 18Z landfalls 2.5 hours sooner (7:30AM) vs 10AM on 12Z.
-
~15 mile SE change in track vs 12Z Euro. Landfall still in Taylor county but central rather than NW. Entire track inland is similarly shifted slightly SE.
-
ACE has risen to 39, slightly higher than the 30 year average for the date. Aside: As the tropics get very active, you know who gets quiet. Same pattern most every time. That strategy helps make him/her effective.
-
I see 1896 and 1950 but not 1985 for Cedar Key landfall: https://www.nhc.noaa.gov/data/tracks/tracks-at-1985.png
-
Idalia is forecasted to heavily affect a large portion of the SE. In some areas even away from the FL Big Bend that are near the track, it will very likely end up as the most impactful wx event in many years. Moderators, please pin this. Thanks
-
-Only 6 (14%) of the last 44 winters had a -NAO vs 12 (27%) neutral and 26 (59%) +NAO. Also, only one of the last 12 winters was -NAO. However, a good portion of neutral and even some of the +NAO winters had a solid -NAO month. That's the better hope if you want -NAO. -So, for whatever reason, we're in a +NAO winter era of sorts. Until we get passed it, it won't be easy to have -NAO dominate in any one winter. - Average monthly sunspots for these six -NAO winters were all low to very low: 20, 6, 12, 22, 33, and 14 for an average of only 18. This 18 compares to the longtime average monthly sunspots of 85 (based on 1900-2022 data). So, none of these six low sunspot #s are anywhere near the quite high 150+ that we're likely headed toward this winter and they're not even close to the 85 average. -All six -NAO winters were within two years of a solar min whereas we're going to be much closer to a solar max than min this winter. -So, I'm betting pretty heavily on either a +NAO or neutral NAO averaged over this winter with the hope for one solid -NAO month. I'd take that one month and run.
-
From 5PM NHC discussion: "This has resulted in a westward shift of about 20-25 n mi compared to the previous forecast" This makes sense based on 12Z model consensus.
-
Ouch! Hurricane watch GA and lower SC coast. Hope this is overdone but it has been a worry. Hopefully the struggles of the storm that have been mentioned here are actually going to keep it from reaching major status. But it isn't looking good right now.
-
Maybe this won't end up as a major H landfall. Fingers crossed! Perhaps their climo says that there are geographic factors that make it extremely difficult and that that will come into play for Idalia. Thoughts?
-
1. Indeed, the 12Z CMC is outside the cone although for the record it's ~50 rather than 100 miles outside of it. The 12Z CMC is at Apalachicola while left side of cone is at Alligator Point, 50 miles E. But it is notable that it's outside the cone. 2. One of the issues is that Idalia's cone is rather narrow (~100 miles wide at FL coast). To compare, here was Ian's cone then, which was a bit wider: https://www.nhc.noaa.gov/archive/2022/IAN_graphics.php?product=3day_cone_with_line_and_wind 2. Now I'll address the CMC's horrible left bias regarding Ian, which made landfall near Port Charlotte at 19Z on 9/28/22. Here were the 12Z 9/27 runs for Ian: ICON Port Charlotte CMC Tampa GFS just N of Port Charlotte Euro Port Charlotte UKMET 20 miles S of Ft. Myers Note that CMC was still up at Tampa, which is 70 miles to the north/left of the actual Ian landfall that occurred just 31 hours later. IF Idalia were to make landfall 70 miles to the right of today's 12Z CMC, that would be well within the cone. Also, keep in mind that the prior CMC run (0Z 9/27) was way up in the Big Bend, or ~200 miles away from actual landfall! So, the CMC appears to have a severe left bias. 3. The 12Z GFS is on the left edge of cone (Alligator Point). The 12Z Euro is in W Taylor County or ~25 miles E of the GFS/~25 miles W of the cone's center. The 12Z ICON/UKMET are in mid Taylor Count ~15 miles E of Euro or ~10 miles left of mid-cone. To summarize the 12Z runs: -CMC 50 mi left of cone's left edge -GFS left cone edge/50 mi left of cone center -Euro 25 mi left of cone center -UKMET/ICON 10 mi left of cone center -So, all five left of cone center -So, 12Z runs favor moving cone a bit to the left at 5PM advisory.
-
Isn't it more like 32 hours from now til landfall rather than 48 hours?
-
0Z UKMET: after the 12Z UKMET had a 65 mile NW shift to Apalachee Bay, the 0Z is similar with no more than a slight E adjustment. So, most of the 12Z 65 mile NW shift is retained on the 0Z: TROPICAL STORM IDALIA ANALYSED POSITION : 21.8N 85.1W ATCF IDENTIFIER : AL102023 LEAD CENTRAL MAXIMUM WIND VERIFYING TIME TIME POSITION PRESSURE (MB) SPEED (KNOTS) -------------- ---- -------- ------------- ------------- 0000UTC 29.08.2023 0 21.8N 85.1W 994 50 1200UTC 29.08.2023 12 23.6N 84.8W 993 51 0000UTC 30.08.2023 24 26.4N 85.1W 991 43 1200UTC 30.08.2023 36 29.2N 84.4W 987 47 0000UTC 31.08.2023 48 32.1N 82.5W 989 41 1200UTC 31.08.2023 60 34.0N 79.7W 994 40 0000UTC 01.09.2023 72 34.4N 76.0W 999 38 1200UTC 01.09.2023 84 34.2N 73.4W 1003 43 0000UTC 02.09.2023 96 33.4N 71.2W 1006 37 1200UTC 02.09.2023 108 30.8N 71.2W 1007 34 0000UTC 03.09.2023 120 30.9N 70.6W 1007 30 1200UTC 03.09.2023 132 30.3N 71.6W 1008 27 0000UTC 04.09.2023 144 30.2N 72.0W 1008 26 1200UTC 04.09.2023 156 CEASED TRACKING