GaWx
-
Posts
17,857 -
Joined
Content Type
Profiles
Blogs
Forums
American Weather
Media Demo
Store
Gallery
Everything posted by GaWx
-
The 1/1 Euro Weeklies have an even stronger SPV late Jan/early Feb with the ensemble mean right at climo then (see below). (Look in my quoted post to see how much weaker was the SPV on the 12/26 run.) The last two weeks of the run, 1/29-2/5 and 2/5-12, warmed notably in the E US vs yesterday’s run (connection to stronger SPV??). OTOH before that, the week of 1/15-22 on the 1/1 Weeklies got even colder in the E US with BN temps nearly everywhere (see below). This is now the coldest week of the run in the E US as a whole! Also, keep in mind that this is during about the coldest climo of the winter for many. Interestingly, the models are suggesting that the MJO will then be in the MC though hopefully weak. Last winter’s coldest E US was when it was in the MC. Though it appears there might then be a moderate -PNA, there looks to then be a strong -NAO/-AO largely running the show. The run for 1/15-22 from just 6 days earlier (12/26 run posted in my quoted post) had AN temps for most of the E US!
-
The final week of the 12/31/23 run, which is for 2/5-12.
-
1. Yesterday’s OISST 3.4 is making a good case for a super El Niño (+2.00+ ONI peak): 2. OTOH, the Dec OHC came in at only +1.11: https://www.cpc.ncep.noaa.gov/products/analysis_monitoring/ocean/index/heat_content_index.txt
-
The latest Euro Weeklies (12/31 run) has normal or BN temps in the SE US throughout the run, including a strong signal for cold in its final week fwiw (not easy to do that far out on a 101 member run).
-
I’m still amazed at how the EPS went from this on 12/26/23 run (mean down to -3 and highest rest of run only +16): To this just 5 days later (12/31 run) (mean down only to +10 and lowest Jan 9th through end up at +17): However, despite that, the 12/31 run overall is a significantly colder run for much of the US, including the E US, especially for this week: Week of 1/15-22: 12/26/23 run: 12/31/23 run: Also, look at how cold on the 12/31/23 run is the week of 2/5-12, the coldest by a good margin in the E US of the four runs extending that far:
-
This EPS map for Jan 12th, should it verify closely, would be more typical of La Niña than El Niño with the -PNA/Aleutian High/SE ridge. This is something that I recall seeing very little of so far this winter. I’m assuming that this would be quite transient due to the El Niño, especially once the MJO gets past phases 4-6. Also, note that the SER (which I obviously hate to see) would be pretty stout then despite the coexisting strong -NAO/moderate -AO. I certainly hope the SE ridge would be temporary. In the meantime, I’ll be enjoying the cold that is going to dominate over the next 6 or so days:
-
1. OTOH, a major SSW is the gold standard for determining the likelihood of a SPV warming later translating down into the troposphere and then very often, especially during El Niño resulting on its own in a cold E US starting a couple of weeks later. With one no longer being imminent in early Jan like appeared to be the case just 4 days ago, it certainly is disappointing to me (as one who doesn’t like to sugarcoat in an effort to come across as objective as possible) since I prefer a long-lasting cold dominated pattern. I’ll still be hunting for one later in the season though I hope it wouldn’t have to wait til mid Feb like last year since that would delay the most likely start of the strong effects til early March. Otherwise, there are other factors that affect our wx (like El Niño, itself, +PNA, -AO, -NAO, -EPO, weak MJO, etc) that often lead to a cold E US pattern on their own. In the meantime here it has been cold the last couple of days and is expected to be cold dominated next week, which I’m loving. That would mean through early Jan a near normal winter to that point for much of the SE US, which I’m content about because it has been hard to get in recent years. 2. Updated GLAAM: fwiw this latest CFS run has it shifting to a La Niña pattern favoring -GLAAM in mid Jan, which is consistent with MC MJO phases being projected for then:
-
The warming is still strong/impressive but the wind reversal hasn’t held. So, headed for a minor SSW it appears. It doesn’t matter how much warming there is. I don’t think models are preprogrammed to predict/biased toward a major SSW based on past cases like 2/16/23..
-
I agree. I assumed he was asking about a major SSW. The chance for that in early Jan has gone from very likely per EPS/GEPS to only slight on all 3 major ens.
-
No, they’re showing unlikely now.
-
I'd agree with your post if you changed one word, "no". I wouldn't at all say "no" value. That is simply not true. Your overall point of not relying on model output is understood but saying no value is hyperbole. Thus I still see plenty of value and thus will continue to follow and post model output.
-
I’m still amazed at how the Euro weeklies went from this trend, which covers through the 12/24 run: followed by the strongest signal for an early Jan major SSW (the 12/26 run), to the weakest signal for an early Jan major, the 12/28 run as noted in my post earlier this morning. Simply astounding!

-
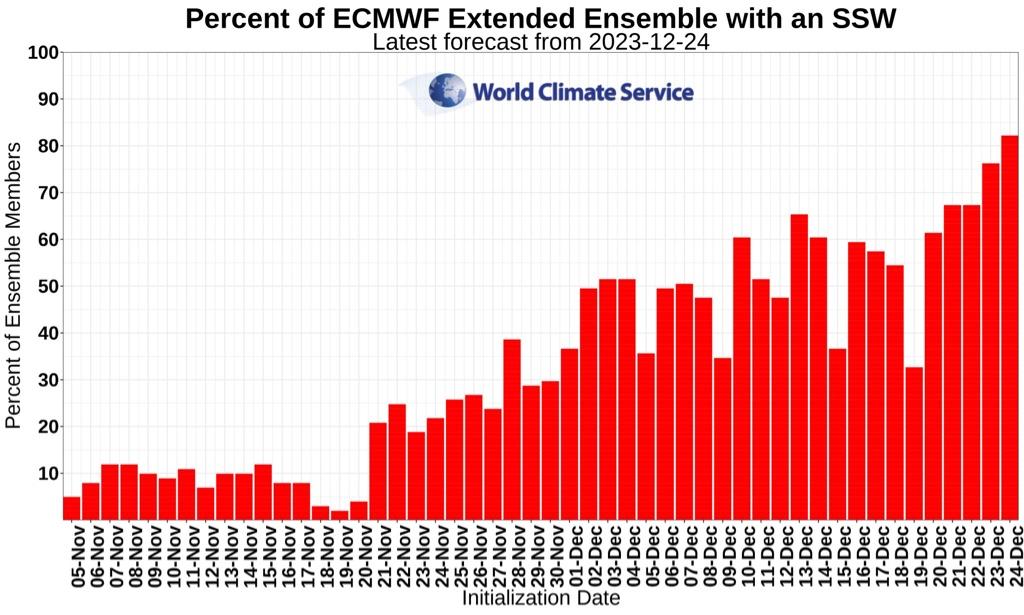
Yesterday’s 0Z EPS mean (0Z 12/28/23 run, latest available as of now on these graphs) went even further from the expectation of a major SSW in early Jan with only 4 members (8%) having one vs 20% on the 0Z 12/27 run per Allan. This 8% is only two days after the most impressively weak SPV for any 0Z run in early Jan, the 0Z 12/26 run (see 2nd of two graphs just above this in quoted post), a most unexpected turn of events!
-
Based on the tweet from Allan saying only 20% major SSWs on today’s 0Z EPS, here’s what some of us have been waiting for to see if it agreed: it seems to be in agreement in being much less impressive in early Jan! The mean dips down only to +5 on Jan 6th vs yesterday’s -3: Compare that to the very impressive run from yesterday at 0Z, what then was about the most impressive yet with a dip of the mean to -3 on Jan 6th: So, that means that today’s 0Z EPS, GEFS, GEPS, FNMOC ens, and GFS are all less impressive than 24 hours ago. Will we now get a @mitchnickstyle reversal tomorrow? Stay tuned!
-
I think that the subsurface already peaked in Nov.
-
Here are the 0Z 12/27 model means for the 60N 10 mb wind low point for the GEFS, GEPS, FNMOC ens, and the GFS along with the respective comparisons to the 4 prior days’ 0Z: 1. GEFS: 12/27 +11 vs 12/26’s +8, 12/25’s +6, 12/24’s +18, and 12/23’s +17 2. GEPS: 12/27 -4 vs 12/26’s -9, 12/25’s -16, 12/24’s -2, and 12/23’s -5 3. FNMOC ens: 12/27 0 vs 12/26’s -3, 12/25’s -2, 12/24’s -2, and 12/23’s +7 4. GFS: 12/27 +8 vs 12/26’s -1, 12/25’s 0, 12/24’s 0, and 12/23’s +32 All four dipped to lows 12/25-6 followed by a rise today. Despite today’s rises, the runs are still significantly lower than the 12/23 runs except for the GEPS being ~same. GEFS has been the highest overall while GEPS has been the lowest. Keep in mind that we’re still ~9-10 days out from a potential crossing of the 0 line, still a fair ways out to allow the details to be pinned down yet. If the low were to turn out, say, +2 vs -2, I don’t think it would make much difference as far as potential effects on the troposphere in the US, whether significant or not. Now comparing something like, say, +5 vs -5 would likely be a different story obviously. Being that lows were hit just 1-2 days ago and it is still ~9-10 days out, another reverse downward could easily happen as per @40/70 Benchmark 's post from two hours ago:
-
Per Allan’s same source, the % on the EPS fell a little more from the 25% (13) he showed per yesterday’s 12Z to only 20% (10) on today’s 0Z. We’ll be able to compare this with the Euro Weeklies output this afternoon to make sure they agree:
-
Based on comparing the GEFS runs of 0Z 12/25 and 0Z 12/26, the main reason for the small rise in the mean wind from the ensemble mean was not the % of members with a major SSW but rather the average intensity of the majors was a little softer on the 12/26 run. But in terms of frequency, the 12/26 run is still one of the most bullish for the lagging GEFS for Jan 5-11 with 10 (32%) majors vs 11 (35%) on the 12/25 run.
-
I wonder where he gets these graphs from. Something doesn’t seem right.
-
OHC continues to plunge:
-
Also, 1986-7 and 2015-6 El Nino winters had both under an inch through Dec and 20”+ Jan+. So, there have been four and all four had 11.6”+ in January, alone. Since 1939-40, there have been 10 El Niños with <1” through Dec. That’s out of 28 total El Ninos. So, 36% of them had <1” meaning not highly unusual. Thus out of those 10, four (40%) had 20”+ Jan+. That’s not that low of a %. I’ll now compare to non-Nino winters. Regarding non-Nino winters since 1939-40, I count 13 with <1” through Dec. That’s 13 out of 56 non-Nino or 23% of them. So, having <1” through Dec has been significantly more unusual during non-Nino (23%) than during Nino (36%). Out of those 13 during non-Nino, only 4 (31%) ended up with 20” Jan+ vs the 40% for El Niño. So, being in El Niño helped some for the slow starters. Out of all 84 winters since 1939-40, 41 of them (49%) had <20” Jan+. So, not getting 20”+ Jan+ is nearly a coin flip for all winters. Out of the 23 total winters with <1” through Dec, 15 (65%) had <20” Jan+. That means that out of the 61 total winters with 1”+ through Dec, 26 (43%) had <20” Jan+ vs the 65% for winters with 1”+ through Dec. So, having <1” through Dec does increase the chance somewhat for Jan+ to have <20”.
-
The # of members with a major during just Jan 5-12 went from the 0Z 12/24 GEFS’ one (3%) to the 0Z 12/25 GEFS’ 11 (36%)! I’m getting very close to the @40/70 Benchmarklevel of confidence that there will be one in early Jan.
-
So, the 12Z EPS is implying a most likely major SSW (when winds reverse) centered on Jan 6th. Per the 0Z, the most likely reversal dates appear to be for Jan 5th-8th. The 0Z was the first 0Z EPS with the mean touching 0 m/s. The lowest prior to that had been yesterday’s +2.5. And now this 12Z drops it to -5! A Jan 5-8 SSW date would suggest the period of greatest potential cooling from it on the E US would start ~Jan 20th and go at least well into Feb meaning covering a large portion of the best climo period for E US winter storms, especially.
-
1. That looks like a major SSW (with a split) on the 12Z GFS. The 0Z was right at 0. 2. The 0Z CDN ens mean dropped way down to -16 vs -3 yesterday (see below). A -16 for an ensemble mean 14 days out is extremely impressive! Anything -15 or under would be a record breaker for late Dec through mid Jan and there have been many in early Jan, alone. 3. The 0Z GEFS mean dropped way down to +7 vs +17 yesterday (see below):
-
That Atlanta to Carolinas major snowstorm was on Jan 2-3 and the SSW was on Jan 2nd. So, it’s likely that the snowstorm occurring had little to do with the SSW.