GaWx
-
Posts
19,612 -
Joined
Content Type
Profiles
Blogs
Forums
American Weather
Media Demo
Store
Gallery
Everything posted by GaWx
-
AAM looks solidly Ninoish starting in ~1 week as of this CFS run of 2 days ago fwiw. Will this verify? Warning: these graphs are from the very unreliable 4 member CFS ensemble (you know, the model with the very unrealistic record obliterating plunge in Nino 3.4 by next month) and they are very jumpy/fickle! Look how much they changed from just 4 days prior (2nd image). So, be careful not to read too much into this: Prior run wasn’t as solidly Ninoish:
-
Here’s a better illustration of a main reason why NG has been up this evening, which is interesting: it is because the 12Z 11/17 EPS (purple) is coldest at the end, Dec 1st, with 20.4 HDD and rising. However, keep in mind that 11/23-7 total HDD are down to only 71 vs 89.5 on the Thu 11/14 0Z run, when NG was about where it has been this evening. Check out 11/26: it’s only at 12 on the 11/17 12Z, which is a whopping 6 BN and the normal for 11/10, 16 days earlier. On the 11/14 0Z, it was way up at 18.1 or near normal! This is the nature of these cold biases. They’ll often be too cold late in week 2 and then get back to reality and warm up as those days get closer. Back on 11/14, 11/23-27 were out 9-13 days. Now that these days are only out 6-10, they’ve warmed substantially. They don’t always do that, of course. But they tend to do that more than the opposite (nature of cold bias). If I were a betting man, I’d bet based on the cold bias that Dec 1st will end up verifying lower than 20 HDD. Of course it may not but the odds favor that. Also, even though I’m not trading commodities, I’m guessing that NG will be lower than it is now by morning. That’s partially because 11/23-7 are so much warmer than they were as of 3 days ago. But that’s just a guess. If the overnight GEFS/EPS runs turn out cold enough especially late, NG probably wouldn’t turn down in the morning and may even rise further.
-
The last few advisories have been saying isolated total amounts in N Honduras up to 40”!! RAINFALL: Additional rainfall amounts of 1 to 3 inches are expected over northern Honduras, with storm total amounts locally as high as 40 inches. The risk of catastrophic and life-threatening flooding impacts will continue, especially along and near the Sierra La Esperanza.
-
Dan, why? All mkts are manipulated and NG is no exception. However, despite this, I’ve found NG current price trends to be a good barometer of days 10-15 of ensemble model E US temperature trends.
-
NG price this evening is up 4% likely due to the end of the 12Z GEFS and EPS being colder than how the late in the run 12Z runs looked Fri/BN in the E US, where NG is most heavily used in cold season. This negates the price drop of Thursday that was largely due to warmer models that day.
-
1. Neither should be considered anywhere near gospel out at hour 360 of even the ensemble means as they are typically of pretty low confidence though they’re much better than their respective operationals. 2. Due to cold bias of ensemble means that has existed for years, especially that far out, quite possibly due to the very warm W Pacific, warm solutions have a somewhat better chance to verify closely than cold solutions. 3. As I assume you and many of the members know, cold bias doesn’t at all mean always too cold or anywhere near always. Sometimes they can be either too warm or about right. But overall, too cold is typically more common than too warm (definition of cold bias). 4. Be that as it may, I’ve also noticed the model trend for the start of Dec has turned colder. But again, it remains to be seen whether or not these colder solutions will actually verify closely. Keep in mind that much earlier in the forecast period (11/23-7) that the EPS warmed considerably from an avg of +0.5 AN HDD per US pop weights to 2.5 HDD BN.
-
Thanks for posting. I hope your hunches are wrong and that we get a much quieter season. Interestingly, I saw this exact post at another BB but I don’t see it anymore for some reason.
-
For the period Sept 1st through Nov 14th back to 1948, 2024 is tied with 2021 for the fewest -EPO (sub -50) days with just 3: Lowest # of sub -50 EPO days 9/1-11/14 back to 1948 (7 or fewer): 2024: 3 2021: 3 2011: 4 1994: 4 1958: 4 1948: 4 1968: 5 I didn’t see any notable correlation to # of sub -50 days one way or the other in the subsequent respective winters, however. https://downloads.psl.noaa.gov/Public/map/teleconnections/epo.reanalysis.t10trunc.1948-present.txt
-
How are the autumn leaves looking in N GA and the W Carolinas? Are they running way behind? Have they hit peak yet?
-
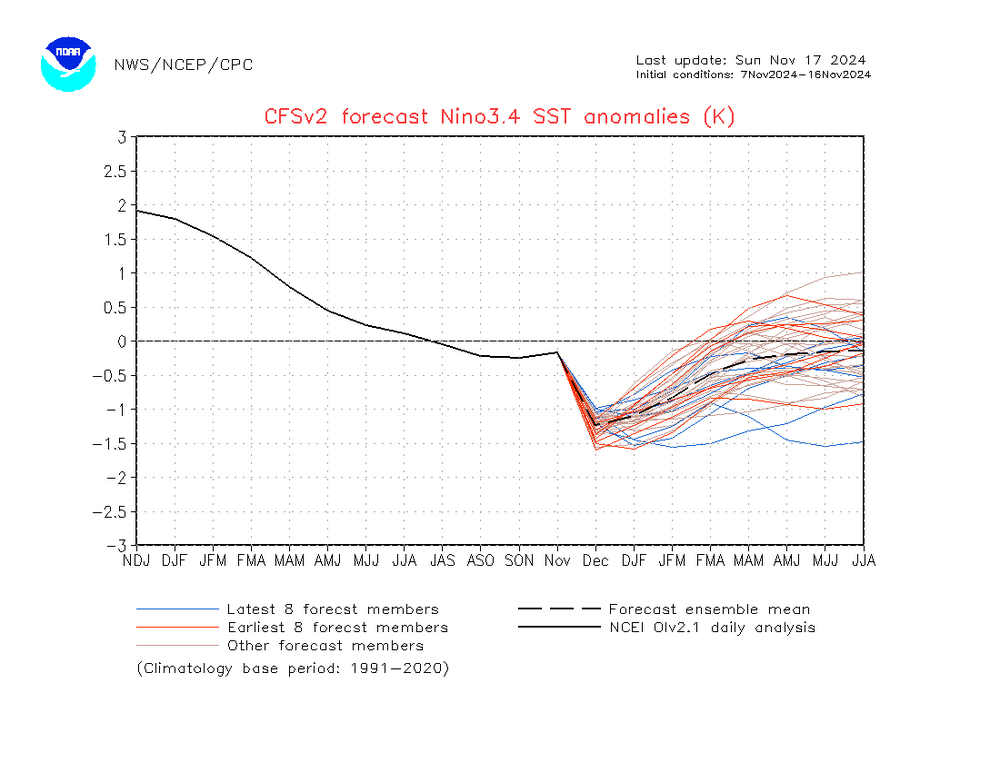
So based on my prior post: IF the CFS cooling in Nino 3.4 from Nov to Dec were to somehow verify closely, it would more than double the old record cooling from Nov to Dec back to 1950 and more than triple the strongest forecasted cooling of any other model (JMA’s 0.3)! For some reason I feel CFS will bust very badly but we’ll see. In light of this likely upcoming huge bust in Nino 3.4, how much weight should be put on the CFS current winter forecast for the E US?
-
What’s the deal with the latest CFS forecasted record rate of cooling from Nov to Dec in Nino 3.4? The latest CFS mean is forecasting a record shattering cooling of 1.0 to -1.2: Compare the CFS to these latest runs for Nov to Dec: -BoM: no cooling/remain at -0.2 -Euro: 0.25 cooling to -0.5 -JMA: 0.3 cooling to -0.6 -MeteoFrance: 0.2 cooling to -0.45 -UKMET: 0.2 cooling to -0.8 So, CFS’ cooling of 1.0 from Nov to Dec compares to a range of only 0.0 to 0.3 for the latest run of the other five models. The record ONI based cooling from Nov to Dec back to 1950 is only 0.45 (1951) followed by 0.41 (1954) and 0.40 (2008 and 2012)! The record warming from Nov to Dec is only 0.43 (1991). https://www.cpc.ncep.noaa.gov/products/analysis_monitoring/ensostuff/detrend.nino34.ascii.txt
-
I don’t know. It’s way too early for any forecaster to even try to determine that.
-
Yes, 2004 and 1969 were both weak El Niño with active Atlantic hurricane seasons.
-
In general terms El Niño is correlated with less ACE than non-Nino. But if it’s weak, there’s typically less of a reduction. Furthermore, this is only a tendency. For example, look at 2023 for a major exception due to record high Atlantic SSTs.
-
1. On RONI basis, which is much more telling of late, 2023 peaked at only +1.50 vs 2015-6 at +2.37, 1997-8 at +2.38, 1982-3 at +2.53, 1972-3 at +2.27, and 1965-6 at +2.04. So, on that basis, 2023 doesn’t belong with the other 5. 2. Per RONI 1963-4 peaked at +1.25, not that much weaker than 2023, and went Nino, Niña, Nino. 3. Per Webb, 1902-3 peaked a bit stronger than 2023 (+1.8) and went Nino, Niña, Nino. 4. Per Webb 1885-6 peaked at +1.3, not that much weaker than 2023 and went Nino, Niña, Nino. So, I maintain that a Nino in 2025-6 wouldn’t be an all that rare occurrence. I think the previously stated rareness is being overblown.
-
Regarding the bolded: -2004,5,6 was Nino, Niña, Nino -1963,4,5 was the same -1923,4,5 “ “ -1902,3,4 “ “ -1885,6,7 “ “ -Since 1851 there were 19 cases of Nino to Niña. Out of these 19, 5 ended up Nino to Niña to Nino. -So, they’re not as rare as one might think. -Last 3 runs of CANSIPS have been showing Modoki Nino next summer fwiw.
-
1. If this leads to <3” of SN in Dec at NYC, look for Jan+ SN to likely be solidly BN per bluewave’s stats. 2. I just looked at the comparison of US HDDs for 11/23-27 on the 0Z 11/14 EPS and the same on both the 12Z 11/15 and 0Z 11/16 runs. The warming was strong as it went from an average of 0.5 AN HDDs to 3+ BN HDDs! Whereas the 0Z 11/14 run had 4 days with AN HDDs, the last 2 runs had no days like that! Is this a sign of what’s to come this winter on the EPS? Are the various ensembles going to once again be cold biased much of the time like has been the case for much of the last 7-8 years?
-
Euro Weeklies mean over last couple of days has reverted back to a strong SPV throughout Dec: today’s is as strong as any run yet
-
-
Flooding in Honduras from Tropical Storm Sara on November 15, 2024 (CREDIT: CNN) https://www.kadn.com/weather/hurricane/tropical-storm-sara-meanders-near-northern-honduras-after-landfall/article_365d0808-9dbc-51d7-90af-7c76b565b5c9.html
-
Assuming this story by CNN is accurate, this is very bad news for much of N Honduras being that heavy rains are forecasted to continue for parts of that area the next 24-48 hours: “Tropical Storm Sara is unleashing heavy rainfall in northeastern Honduras, with life-threatening flash flooding and mudslides anticipated through the weekend. Nearly 20 inches of rain had already fallen in parts of Honduras as of Friday morning with more to come.” https://amp.cnn.com/cnn/2024/11/14/weather/tropical-storm-sara-florida-hurricane-season-climate The following from NHC is regarding ADDITIONAL rainfall expected: this when combined with what’s already fallen (mainly in NE Honduras) is unfortunately probably just about as bad as it can get in general for that area due mainly to very slow movement but also warmer than normal SSTs allowing more moisture to be held via higher dewpoints: Here’s the latest NHC storm total forecast: RAINFALL: Through early next week, rainfall amounts of 15 to 25 inches with isolated storm totals around 35 inches area expected over northern Honduras. This rainfall will lead to widespread areas of life-threatening and potentially catastrophic flash flooding and mudslides, especially along and near the Sierra La Esperanza. Compare that to the prior storm total rainfall forecast: RAINFALL: Through early next week, rainfall amounts of 10 to 20 inches with isolated storm totals around 30 inches area expected over northern Honduras.
-
1. Colder phases outside the circle in winter averaged colder than inside the circle for warm phases in my own studies, especially in or near midwinter. But I found amplitude of 0.5 to 1.5 left side to be colder in the means than 1.5+ left side. 2. The following is from that same outside study (that I found after doing my own analyses) but just for winter: just outside circle and inside the circle MJO (amp of <1.5) averaged colder than stronger (>1.5):
-
I found in my multidecadal analyses for winter that stronger amplitude of MJO hasn’t correlated to colder in the E US in the means. I actually found the opposite: weaker tended to be colder (in the means). After doing my own analyses, I then found this (for all seasons), which agrees with my findings that cold in the E US correlates best with weak MJO rather than strong:
-
I agree with the bolded. Thus due to Euro ensemble often being too weak going into the right side of the diagram, I’ve found the GEFS to be about the most accurate of the models going into the right side. Currently the EPS is much weaker as you stated.
-
Overall trends since 0Z today in EPS/GEFS have been milder for late in the runs (last few days of Nov) resulting in a drop in HDDs. This helped NG prices close down 6% since yesterday. NG prices are an excellent barometer of the latest tendencies in the week 2 trend, often especially days 10-15, in E US modeled temperatures. We’ll see what tomorrow brings. Regardless, a refreshingly chilly (NN to BN) period looks to be on the way for much of 11/21-6 in the bulk of the E US. Enjoy!