

GaWx
-
Posts
18,240 -
Joined
Content Type
Profiles
Blogs
Forums
American Weather
Media Demo
Store
Gallery
Everything posted by GaWx
-
It would be such a relief if this is going to form and hit the CONUS if it would actually hit as a TS instead of a H as that would be the first of the season as you know. I saw the words “mess” and “broad” used in this forum and elsewhere early on for Helene. Hopefully this time that verifies! Of course, I am not trying to minimize the effects of a TS, especially the rainfall. Hoping it will be moving fast enough to keep that under control.
-
Yep, way up the last few days. Aug was at 215 while Sep had sharply dropped to 141. Despite the big increase of SSN back to above 200, the Euro Weeklies mean is forecasting by a large margin the busiest Oct 7-13 in the Atlantic basin at least back to 1991 with ACE well into the 30s, which is more than twice the mean for the peak climo week of a month earlier! We have Kirk, TD 13, and possibly a Gulf low that are all projected to go well into the 10/7-13 week. It will undoubtedly drop sharply afterward but climo favors that, too, in the 2nd half of Oct.
-
1. The QBO is not out yet on any source I look at 2. The dead-cat bounce has been another impressive one in Nino 3.4:
-
Would y’all please discuss this further in the Helene banter thread? That’s the perfect thread for this subject. Thanks in advance. The Atlantic is quite busy and is expected to continue that way.
-
Yesterday’s Euro Weeklies went even higher than the prior 5.0 times climo for 10/7-13 for ACE. It went to 6.3 climo, which is well into the 30s or more than double peak climo week of 4 weeks earlier! Thankfully, the bulk of this is progged to not threaten people although a Gulf TC is progged. The current highest back to 1991 for that week is ~24 and second highest is ~18. Nowhere close: -2018’s ~24 due mainly to Leslie and Michael -2016’s ~18 due to Matthew and Nicole
-
If yesterday’s Euro Weeklies prog of ~30 ACE for 10/7-13 were to verify closely, it would easily be the most active ACE for 10/7-13 since at the very least 1991! Fortunately the bulk is well out to sea. Going back to 1991, the highest ACE I could find for Oct 7-13 were these: -2018’s ~24 due mainly to Leslie and Michael -2016’s ~18 due to Matthew and Nicole Avg ACE for 10/7-13 during 2004-2023 was no more than 6.
-
He’s right because the seasonal model progs have sucked up at H5, too. 500 mb hts have tended to miss too low in E US just like H85, 2 meters, etc…..pretty much the entire troposphere. When trough shows up at H5 in E US, that often has not verified closely. Can even end up as ridge easily. Look at last winter, when models had strong Aleutian trough at H5. They were way off. So, you can’t even trust the H5 “pattern” on them. CANSIPS is showing Modoki El Niño starting next summer. Am I betting on it? Heck no even though these are SST anoms rather than H5. Of course I’m hopeful and will keep posting about it if it persists but not trusting by any means. I don’t trust long range models for anything though E US warmth has seemingly been verifying more closely.
-
Keep in mind that you’re in a location more much less apt (if apt at all) to be warmer than normal in La Niña. Many of us are concentrating more on closer to the E coast. In my case, I naturally also like to talk about my area, which is more highly impacted to the mild side by a dominant SE ridge. I’ve yet to see a seasonal model for this winter not calling for a mild winter and warmer winter than 23-24 in the SE US overall, which is what I’d expect with a strong -PDO and Niña. That’s the main reason I keep looking ahead to 25-6 for a potentially much colder winter down here with the CANSIPS again literally showing a Modoki El Niño.
-
I ended up with ~6.75” of rainfall this month, with ~5.25” of that just before and during Helene (9/25-7). The other 1.5” fell Sep 5-8, which at the time was the first measurable rainfall since Aug 20th. Highest temperature inside this month has been ~83 with high RH and calm winds due to the still ongoing power outage caused by Helene.
-
Hoping for cooler and less humid as we go later into met. Autumn. Starting off here with dewpoints near 70, more like summer than fall.
-
Extended summer stormlover74 future snow hole banter thread 23
GaWx replied to BxEngine's topic in New York City Metro
This is consistent with the JB playbook: despite predicting an AN temperature winter, emphasize BN potential early based on extreme speculation as well as keep showing cold WB CFS winter maps as they appear, which are much colder than the model is really showing. (He probably doesn’t realize that though.) Shy away from showing CFS maps when the runs aren’t cold. Keep “monkey wrenching” to sew doubt in folks’ minds about a mild winter. Consider cooling the winter forecast by November just like was done for 2020-1. In all fairness that cooling actually ended up closer to reality but that’s bedside the point. Got to keep people clicking. -
For the 2nd month in a row the CANSIPS fwiw has a developing Modoki El Niño (centered near 150-155W in Sept and drifting further W) next summer with it peaking in Sept 2025 or later. It is a little stronger on this run vs last month’s with my rough estimate of +1.0 in Sep in Nino 3.4. On a relative basis, it would probably be more like +0.7. Just food for thought for the winter after next and a reason I’ve been more excited about 2025-6 than 2024-5 for my area’s potential. Now if only the core of the WPAC marine heatwave could migrate E (one can always dream):
-
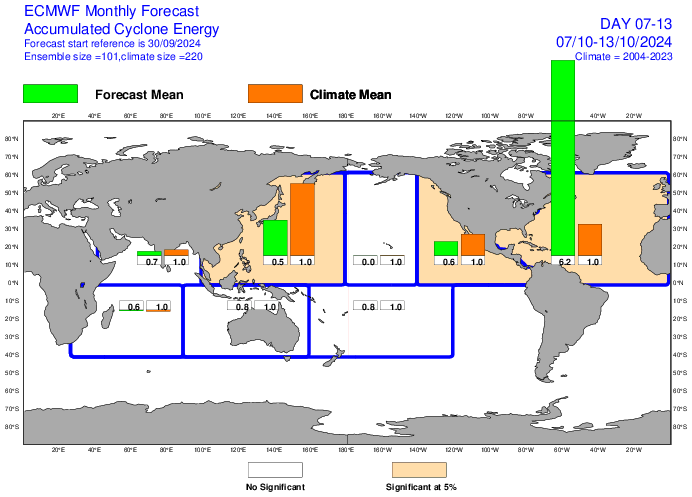
Holy Moses, check out the most recent Euro Weeklies mean prog for ACE for 10/7-13: way off the charts (5 times the 2004-23 mean for that week)! This is ~30, which is nearly double the mean for the peak week 4 weeks earlier and is by far the highest prog for any run this season for any week to date! Fortunately, the bulk of this very high ACE looks to be well out into the open Atlantic though not all of it as that potential Gulf low will need to watched:
-
Extended summer stormlover74 future snow hole banter thread 23
GaWx replied to BxEngine's topic in New York City Metro
The comparison of this top left WB Feb map (avg of 10 days of runs) and the NCEP lower left Feb (again 10 days of runs) is very telling: -WB CFS has Chicago ~-6F and W TX NN -In stark contrast, NCEP CFS has Chicago only -1 to -1.5F and W TX +4 to +5F -This is further confirmation that WB CFS maps tend to be much colder than what the actual model output shows. This is a big problem because it’s misrepresenting what the CFS is actually predicting. -
Close Niña orientation and QBO notwithstanding: 1. Dec of 2010 barely missed having the strongest Dec -NAO since 1950 with only 1963 and 2009 slightly stronger. In contrast and though it of course is possible, there’s currently no indication that Dec of 2024 will have a -NAO (sub -0.25) at all. This shows the opposite, a very strong +NAO fwiw: 2. With the exact opposite SSN vs 2010, this strong +NAO prog for Dec is very believable.
-
Hopefully nowhere near 1,000 dead!! Of course one dead is too many and already far too many have been confirmed dead. Deadliest include Galveston 1900 (~6,000-12,000), GA/SC 1893 (2,000++ mainly African Americans), and Katrina (1,400).
-
Extended summer stormlover74 future snow hole banter thread 23
GaWx replied to BxEngine's topic in New York City Metro
Don and others, Like often is the case, these WB CFS maps almost always have S Lake Michigan about the coldest on the map and N Lake Mich/N Mich (only ~250 miles N) about the warmest. Then they get much colder to the north of that into S Canada. That right there’s a warning that WB CFS maps are highly flawed in addition to tending to be too cold. -
RE: Big ACE producers, wiith background mean SSTs still quite above normal across the MDR, we could see some late records fall. I believe Lorenzo holds the record for furthest east Category 4 or greater after September 28th. But you would think it would be very rare for an MDR system to reach the CONUS with ridging giving way to a more typical Fall pattern / October troughs over the central Atlantic. The only one I can think of in recent decades is Matthew. Yeah, but Matthew didn’t become a TS until almost to 60W. There are several others that formed after 9/25 between 50 and 60W and that hit CONUS. So, hopefully any remaining MDR TCs form E of there and then recurve safely. -Hazel (1954) formed at 58W on Oct 5 -1898: formed at 58W on 9/25
-
Good news is that this late in the season it would be unprecedented in the records for anything becoming a TS E of 50W in the MDR to make it to the CONUS. The latest for that is 9/25 (in 1893). But these could be big ACE producers. Kudos to the Euro Weeklies going back several weeks seeing this big increase in ACE for late Sep through 1st 1/2 of Oct! So, hopefully any TCGs out in the MDR occur E of 50W. The CONUS is not safe though as the next one progged to form in the Caribbean/Gulf is a concern. Hoping it won’t be strong or better yet never be a TC. But the 12Z GEFS is fairly bullish for something forming late week unfortunately. And the 12Z EPS is rather bullish for this a few days later.
-
That appears to be a new record low for your area per the map. Based on the map, much of ATL area’s low was from 1/25/1978 (in blue). The map shows KATL’s record to be 981.4 mb from that. Their lowest hourly from Helene was 983.7 (29.08”) at 6AM. So, it appears KATL just missed the record as I don’t think it got much lower between hourlies since the center was well east of there.
-
Storm total here including indirect in advance: ~5.25” over ~48 hour period. Just under half the 11” from Debby. No damage/trees down here but there are a good number of trees down in the Savannah area, some on houses. Just the typical debris/only a couple of larger branches in yard. Still no power (out for 60 hrs). ~70% were w/o power at highest but ~1/3 of those have it back. So, ~half still have no power. Not difficult for me to handle power outage when considering comparison to much worse hit areas in/near FL Big Bend, Valdosta, Alma, Augusta, SC upstate, W NC, E TN, W VA, and any other areas hit hard. Prayers for those especially in the hard hit areas. And hopefully that’s it for hard hits not only this year but for years to come in the SE and all over.
-
When comparing to the pre-Helene low SLP records of all time for any month and from any kind of system (see below), it looks like new all-time record low SLPs have likely been established by Helene in/near the corridor from the FL Big Bend through the GA cities of Valdosta, Warner Robbins, Macon, Milledgeville, and Athens. Helen, GA, probably just missed its record. The prior records were Idalia of 2023 (1049 mb) in the FL Big Bend and mainly from the 3/13/1993 “Storm of the Century” for the listed GA cities. Record low SLPs (pre-Helene)(map will change once Helene is incorporated): Dates of record low SLPs (pre-Helene): (3/13/1993 in green) (map will change once Helene is incorporated):
-
Mainly because Helene was moving at near record speed for this area, 30 mph! That along with its big size, which slows down weakening, and that it was still strengthening almost until landfall near guaranteed it would be very strong far inland though I was sorry to see it happen. Still no power here (longest outage since Matthew of 2016) but can easily handle as it pales in comparison to what the folks in the FL Big Bend, in/near Alma (GA), Valdosta, Augusta, and especially the W Carolinas have gone/are going through. Prayers to all who have been badly affected. Hoping this is it for anything significant in the SE US this season. Enough is enough!
-
I think that regarding decreasing stability that the much lower SSN should be considered as a possible contributor. Keep in mind that Aug was way up at 215 and that it still was quite high into early Sep: 2024 09 01 2024.668 182 14.2 29 37 2024 09 02 2024.671 195 20.7 26 33 2024 09 03 2024.673 180 21.2 20 23 2024 09 04 2024.676 174 26.1 21 26 2024 09 05 2024.679 182 13.4 16 21 2024 09 06 2024.682 189 13.3 20 25 2024 09 07 2024.684 168 17.5 25 30 2024 09 08 2024.687 171 18.7 20 26 2024 09 09 2024.690 157 19.2 24 27 2024 09 10 2024.693 149 12.9 25 31 2024 09 11 2024.695 153 15.4 29 34 2024 09 12 2024.698 145 11.8 25 29 2024 09 13 2024.701 118 12.8 27 32 2024 09 14 2024.704 116 11.4 25 32 2024 09 15 2024.706 102 14.7 26 31 2024 09 16 2024.709 142 16.2 22 27 2024 09 17 2024.712 141 13.0 30 38 2024 09 18 2024.714 110 8.6 28 33 2024 09 19 2024.717 109 12.1 34 42 2024 09 20 2024.720 126 13.0 29 35 2024 09 21 2024.723 131 9.6 20 26 2024 09 22 2024.725 144 13.7 13 17 2024 09 23 2024.728 130 7.4 20 26 2024 09 24 2024.731 141 12.2 20 24 2024 09 25 2024.734 141 9.0 20 25 2024 09 26 2024.736 145 15.8 18 22
-
From NHC at 4AM: A University of Georgia weather station in Vidalia, Georgia recently reported a wind gust of 77 mph (124 km/h). An ASOS station at The Savannah International Airport in Georgia recently reported a sustained wind of 49 mph (79 km/h) with a gust to 76 mph (122 km/h).


