calm_days
-
Posts
284 -
Joined
-
Last visited
Content Type
Profiles
Blogs
Forums
American Weather
Media Demo
Store
Gallery
Everything posted by calm_days
-

January 30th- Feb 1st ULL and coastal storm obs
calm_days replied to JoshM's topic in Southeastern States
A full moon will hopefully be quite visible Sunnday night above all the new snow !! Of course also the days following will have a mostly full waning gibbous lighting up the snow cover to see before sleeping or when waking up in the middle of the night. -
most of today's radar !!
-
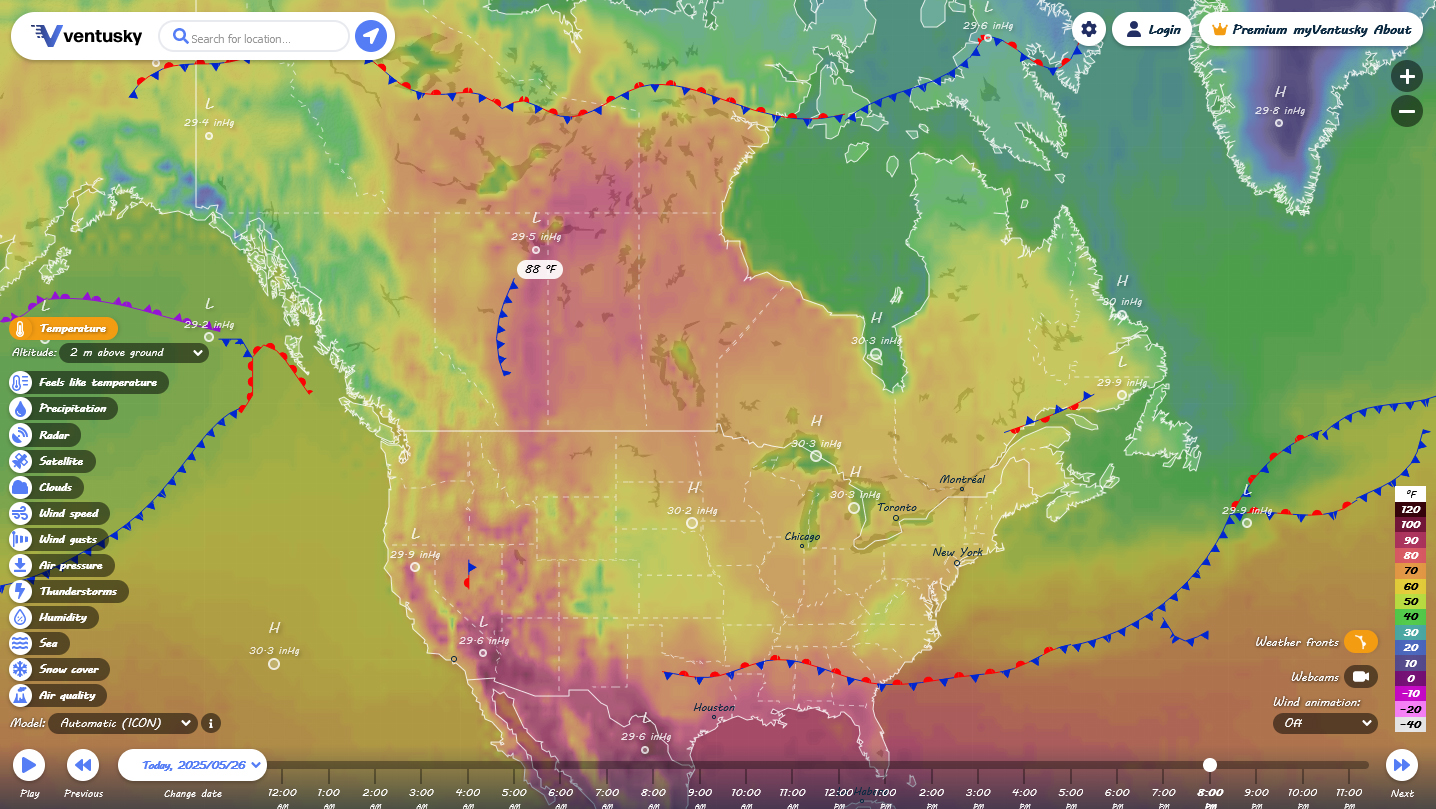
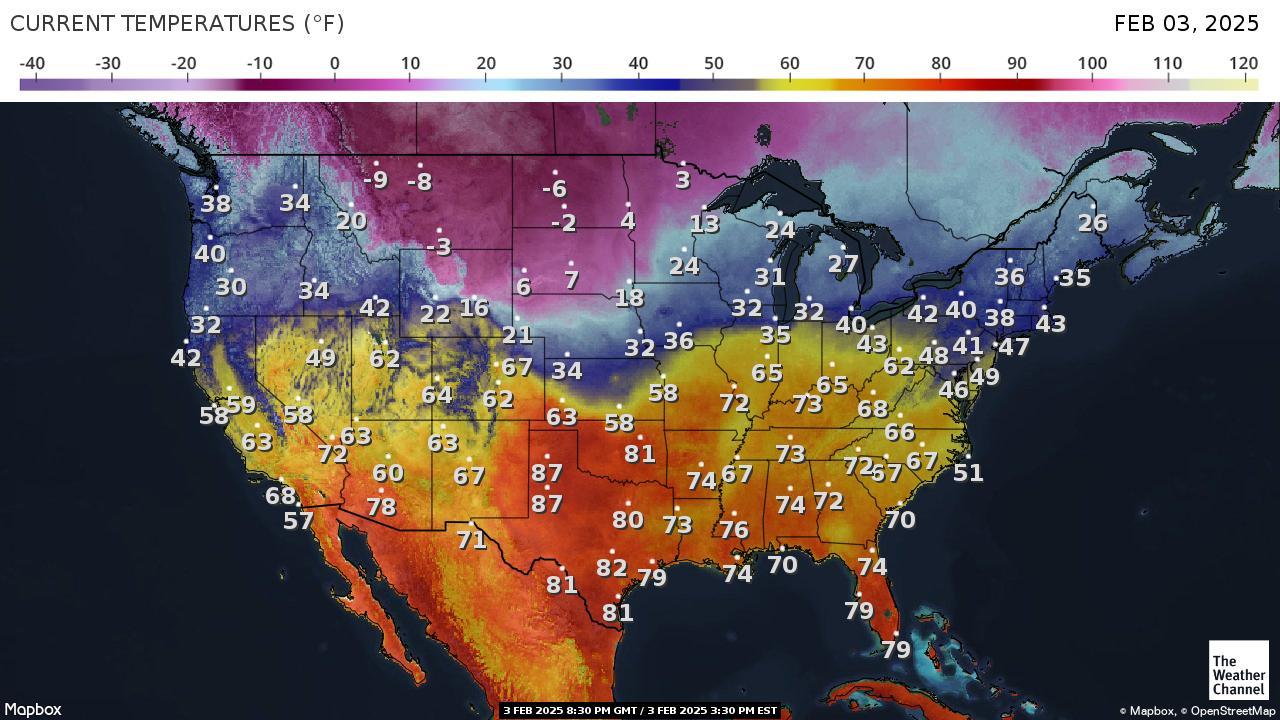
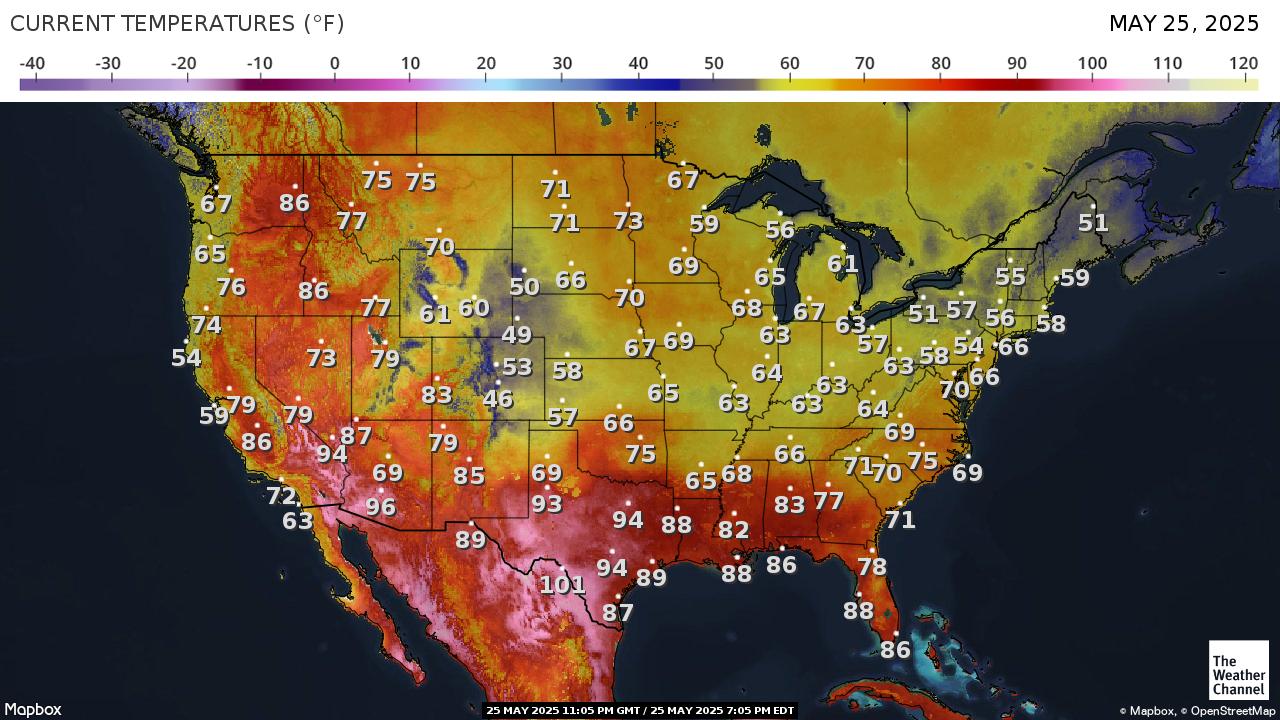
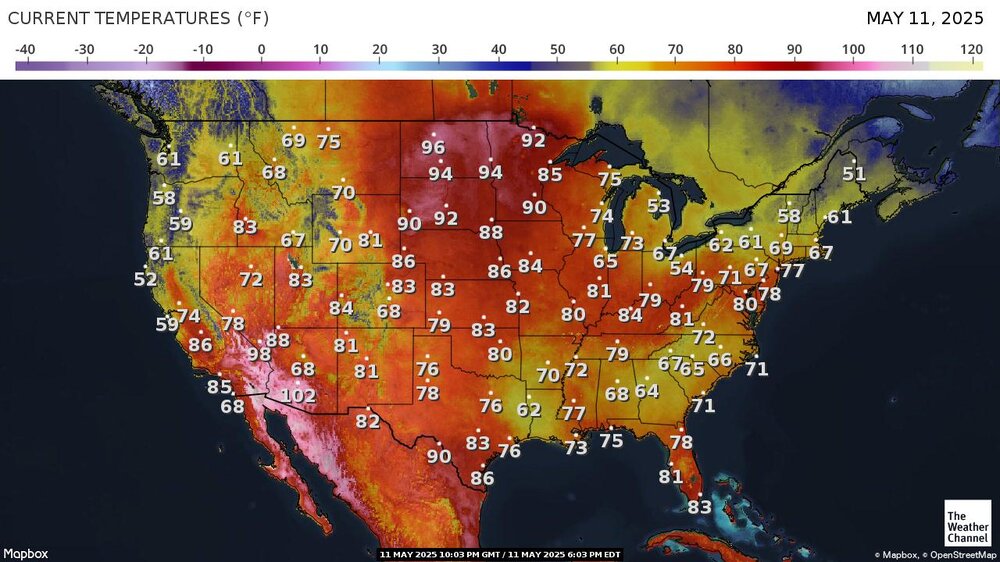
here is a new example of what we were writing about a few weeks ago, that is, the ULL approaching brings quite a lot of warmer air with it to wherever it is located. Here also are two examples of unique temperature dynamics from this year. February 3rd this year ^^ May 25 this year


-
it is always surprising to see very hot temperatures occurring next to the warm front, regardless of it being a warm front. I have enough memories from being younger that thermal behavior was not like this, but i don't want to assume anything. For many years now there have been so many instances of the hottest thermal activity existing in ways that appear isolated, at higher latitude due to strong warm fronts. But did this actually used to happen as well ??
-
very dynamic banding today !! i wasn't sure if the power or network would stay on long enough to post this but so far it has.
-
Yes, i don't know how long it will take this broader pattern to change . but that seems to be more of a positive sign than not.
-
i didn't realize that Mack hadn't posted for a few years now, i just knew that he moved to the midwest!! hopefully he is doing really well !! Anyway this is a good time to honor him as an oldschool snow loving member of the SE forum!! @mackerel_sky speaking of mackerel, holy mackerel this pattern really stands out in the imagery too!!
-
very astonishing to see the pattern like this !!
-
^^ current ^^ yesterday it's an impressive pattern, you can really see it !! We may end up with a seasonal entire month, but maybe more than just one.

-
Have you tried pressing CTRL and the '+' key while on this site ?? it is possible based on the proportions of a cat standing/walking and weight of paws that if they stood on the ' - ' key and one of the ctrl keys at the same time it would have zoomed out the resolution for amwx specificially!! otherwise somewhere in your browser menu ( sometimes it's called ' view ' ) and there would be a zoom setting in there??
-
HRRR showing surprising trough interaction; whether it is just the computation or it will actually happen it seems good to post in here.
-
this would definitely not fit in other threads, but, HRRR is showing, a structure more similar to PTC 8 for the current situation. a lot of interaction with the trough to the north is visible. i feel like that itself is likely to happen but i'm not sure if the actual cyclonic structure will change. Debby and PTC 8 were really different structurally though. If it does merge with the trough and low system early it may become more of a southeaster as was PTC 8. updated 9/24 , for banter's interest's sake. it is again indicating a structural transition.
-
2024 Atlantic Hurricane Season
calm_days replied to Stormchaserchuck1's topic in Tropical Headquarters
yes, it is a very interesting overall picture !!
-
Potential Tropical Cyclone Eight—50mph/1006mb
calm_days replied to WxWatcher007's topic in Tropical Headquarters
-
Potential Tropical Cyclone Eight—50mph/1006mb
calm_days replied to WxWatcher007's topic in Tropical Headquarters
Sort of but moreso in that it's a coastal storm than how it generated. This is a very good post from storm2k from yesterday, -
Potential Tropical Cyclone Eight—50mph/1006mb
calm_days replied to WxWatcher007's topic in Tropical Headquarters
mid morning through to now !! -
Potential Tropical Cyclone Eight—50mph/1006mb
calm_days replied to WxWatcher007's topic in Tropical Headquarters
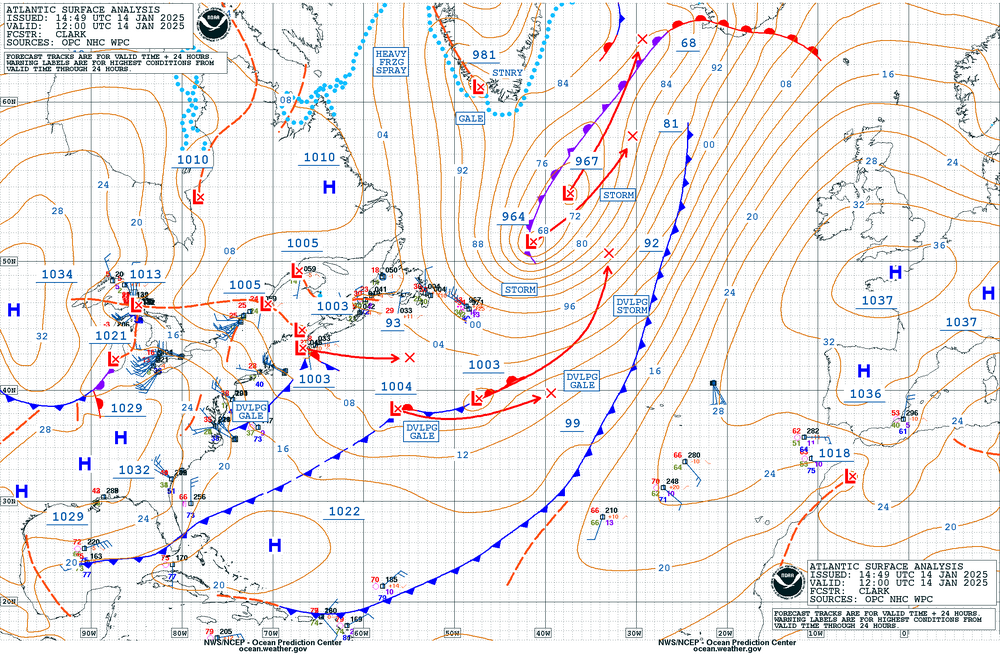
.SHORT TERM /SUNDAY THROUGH TUESDAY/... Key messages: *Confidence in a low pressure system developing (potentially with a band of heavy rain and wind around at least part of the center) has increased somewhat. *Questions remain as to where this system may cross the coast. *Wherever this system tracks, heavy rainfall is likely mainly near and north through east of the center (with peak amounts in the 2-5 inch range possible) and much lighter rain expected on its western and southern sides. Discussion: [...] Meanwhile, surface low pressure is expected to develop and gradually deepen along a stalled front well offshore on Sunday and Sunday night while being steered by a combination of high pressure to its north, a coastal trough extending north of the surface low, and a broad and weak mid-level low over the Deep South. These steering factors continue to yield considerable uncertainty in the forecast timing and track of this low, which results in a range of differences in the location of impacts between Monday and Tuesday. Although the latest guidance suite is coming into somewhat better agreement than we have seen over the last few days that a low pressure system will develop and track towards the coast, considerable differences remain in where the rain associated with this system will fall. In short, wherever this low happens to cross the coast, heavy rainfall peaking in the 2-5 inch range will be possible generally on the northeastern side of the low with lesser amounts to its west and south. Therefore, if the low tracks more north towards Cape Lookout or Cape Hatteras, then most or all of the area should see little rainfall. NHC has raised the probability of this system acquiring tropical characteristics to 50% within the next few days before it potentially reaches the coast. Thus, while gusty winds are expected generally to the north of the low due to high pressure over New England causing a tightened pressure gradient, a band of enhanced wind and rain near the center of the low may develop as well. -
Potential Tropical Cyclone Eight—50mph/1006mb
calm_days replied to WxWatcher007's topic in Tropical Headquarters
-
Potential Tropical Cyclone Eight—50mph/1006mb
calm_days replied to WxWatcher007's topic in Tropical Headquarters
i was surprised that long range HRRR was uniquely accurate for both Ian (2022) and Debby this year and i have seen people saying over the years that it often can have some functional purpose alongside the ensembles. i will take your advice nonetheless!! -
Potential Tropical Cyclone Eight—50mph/1006mb
calm_days replied to WxWatcher007's topic in Tropical Headquarters
Yes , here it is in terms of radar. 18z was of course somewhat different in terms of timing and area. -
2024 Atlantic Hurricane Season
calm_days replied to Stormchaserchuck1's topic in Tropical Headquarters
HRRR was accurate with, even the unusual shape and timing of Debby this year and some of the other Mid Atlantic development in earlier years. That does not mean it is accurate this time but so far it looks like whatever this is. -
Yes; it's somewhat similar to this too https://en.wikipedia.org/wiki/Tropical_Storm_Lee_(2011)
-
Ok!! good news @Stormchaserchuck1 it does work, but, not via the 'img' code. It does work via the Other Media menu at the lower right corner of the new post module
-
2024 Atlantic Hurricane Season
calm_days replied to Stormchaserchuck1's topic in Tropical Headquarters
Yes; there are even currently two west-to-east lows in the region with trough structure. That is a contintent-sized anomalous heat so maybe it is generating a more continental weather pattern??
-
I think that freeimage host or img bb will work for you !! Upload there and then in the new post area click on "other media" and paste the address once you click "insert image from URL". i think with both sites you have to click on your uploaded image to link to the full size image.