

cbmclean
-
Posts
2,591 -
Joined
-
Last visited
Content Type
Profiles
Blogs
Forums
American Weather
Media Demo
Store
Gallery
Posts posted by cbmclean
-
-
3 minutes ago, MN Transplant said:

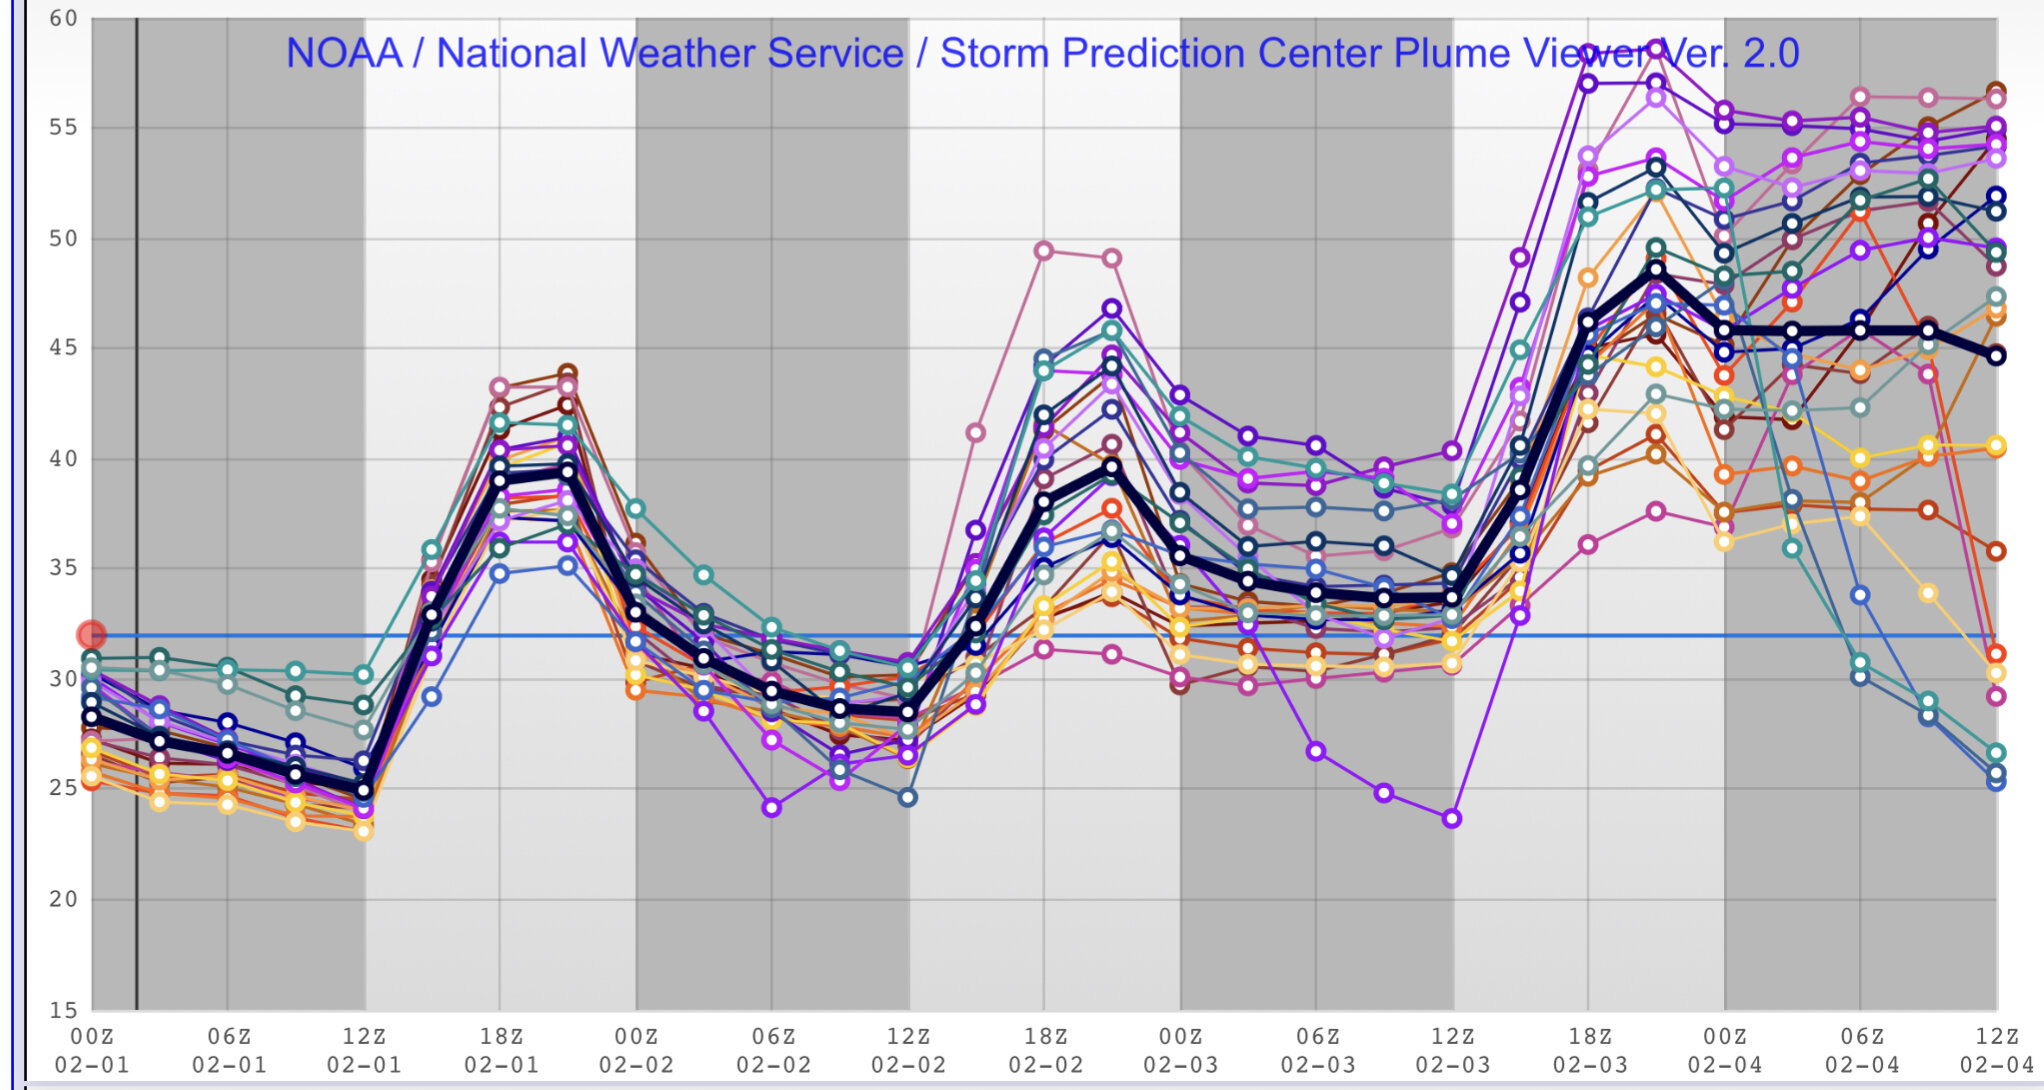
Question: what is a "plume"?
-
Just now, Ji said:2 minutes ago, stormtracker said:Basically same as 18z through 90..again..sfc is a hair more progressive, nothing remarkable
Icon hates us. A new dr no
Doctor Nein?
-
 1
1
-
-
Someone in the NE thread just claimed that Bos just hit its all time one day snow record. Not sure if that is accurate or not. if so that would be impressive.
-
31 minutes ago, NorthArlington101 said:
Pretty impressive 24hr mean -- especially compared to 12z.
Wow is the same storm that was supposed to be a cutter or is this different energy?
-
12 minutes ago, TARHEELPROGRAMMER88 said:
The average is 6 inches period.
The average is somewhere between 5.1 and 5.2 inches, depending on whether or not you include years that just have a trace.
12 minutes ago, TARHEELPROGRAMMER88 said:If we get no more snow this winter it will be 3 years in a row below the average.
That's true but that isn't really that extraordinary. Looking at the period 1990- 2020, we had
- Five years in a row below average (1990-1991 through 1994-1995)
- Four years in a row below average (2004-2005 through 2007 - 2008)
- Three years in a row below average (1996-1997 through 1998 - 1999)
- Of the 1990's 8 out of 10 years were below average
-
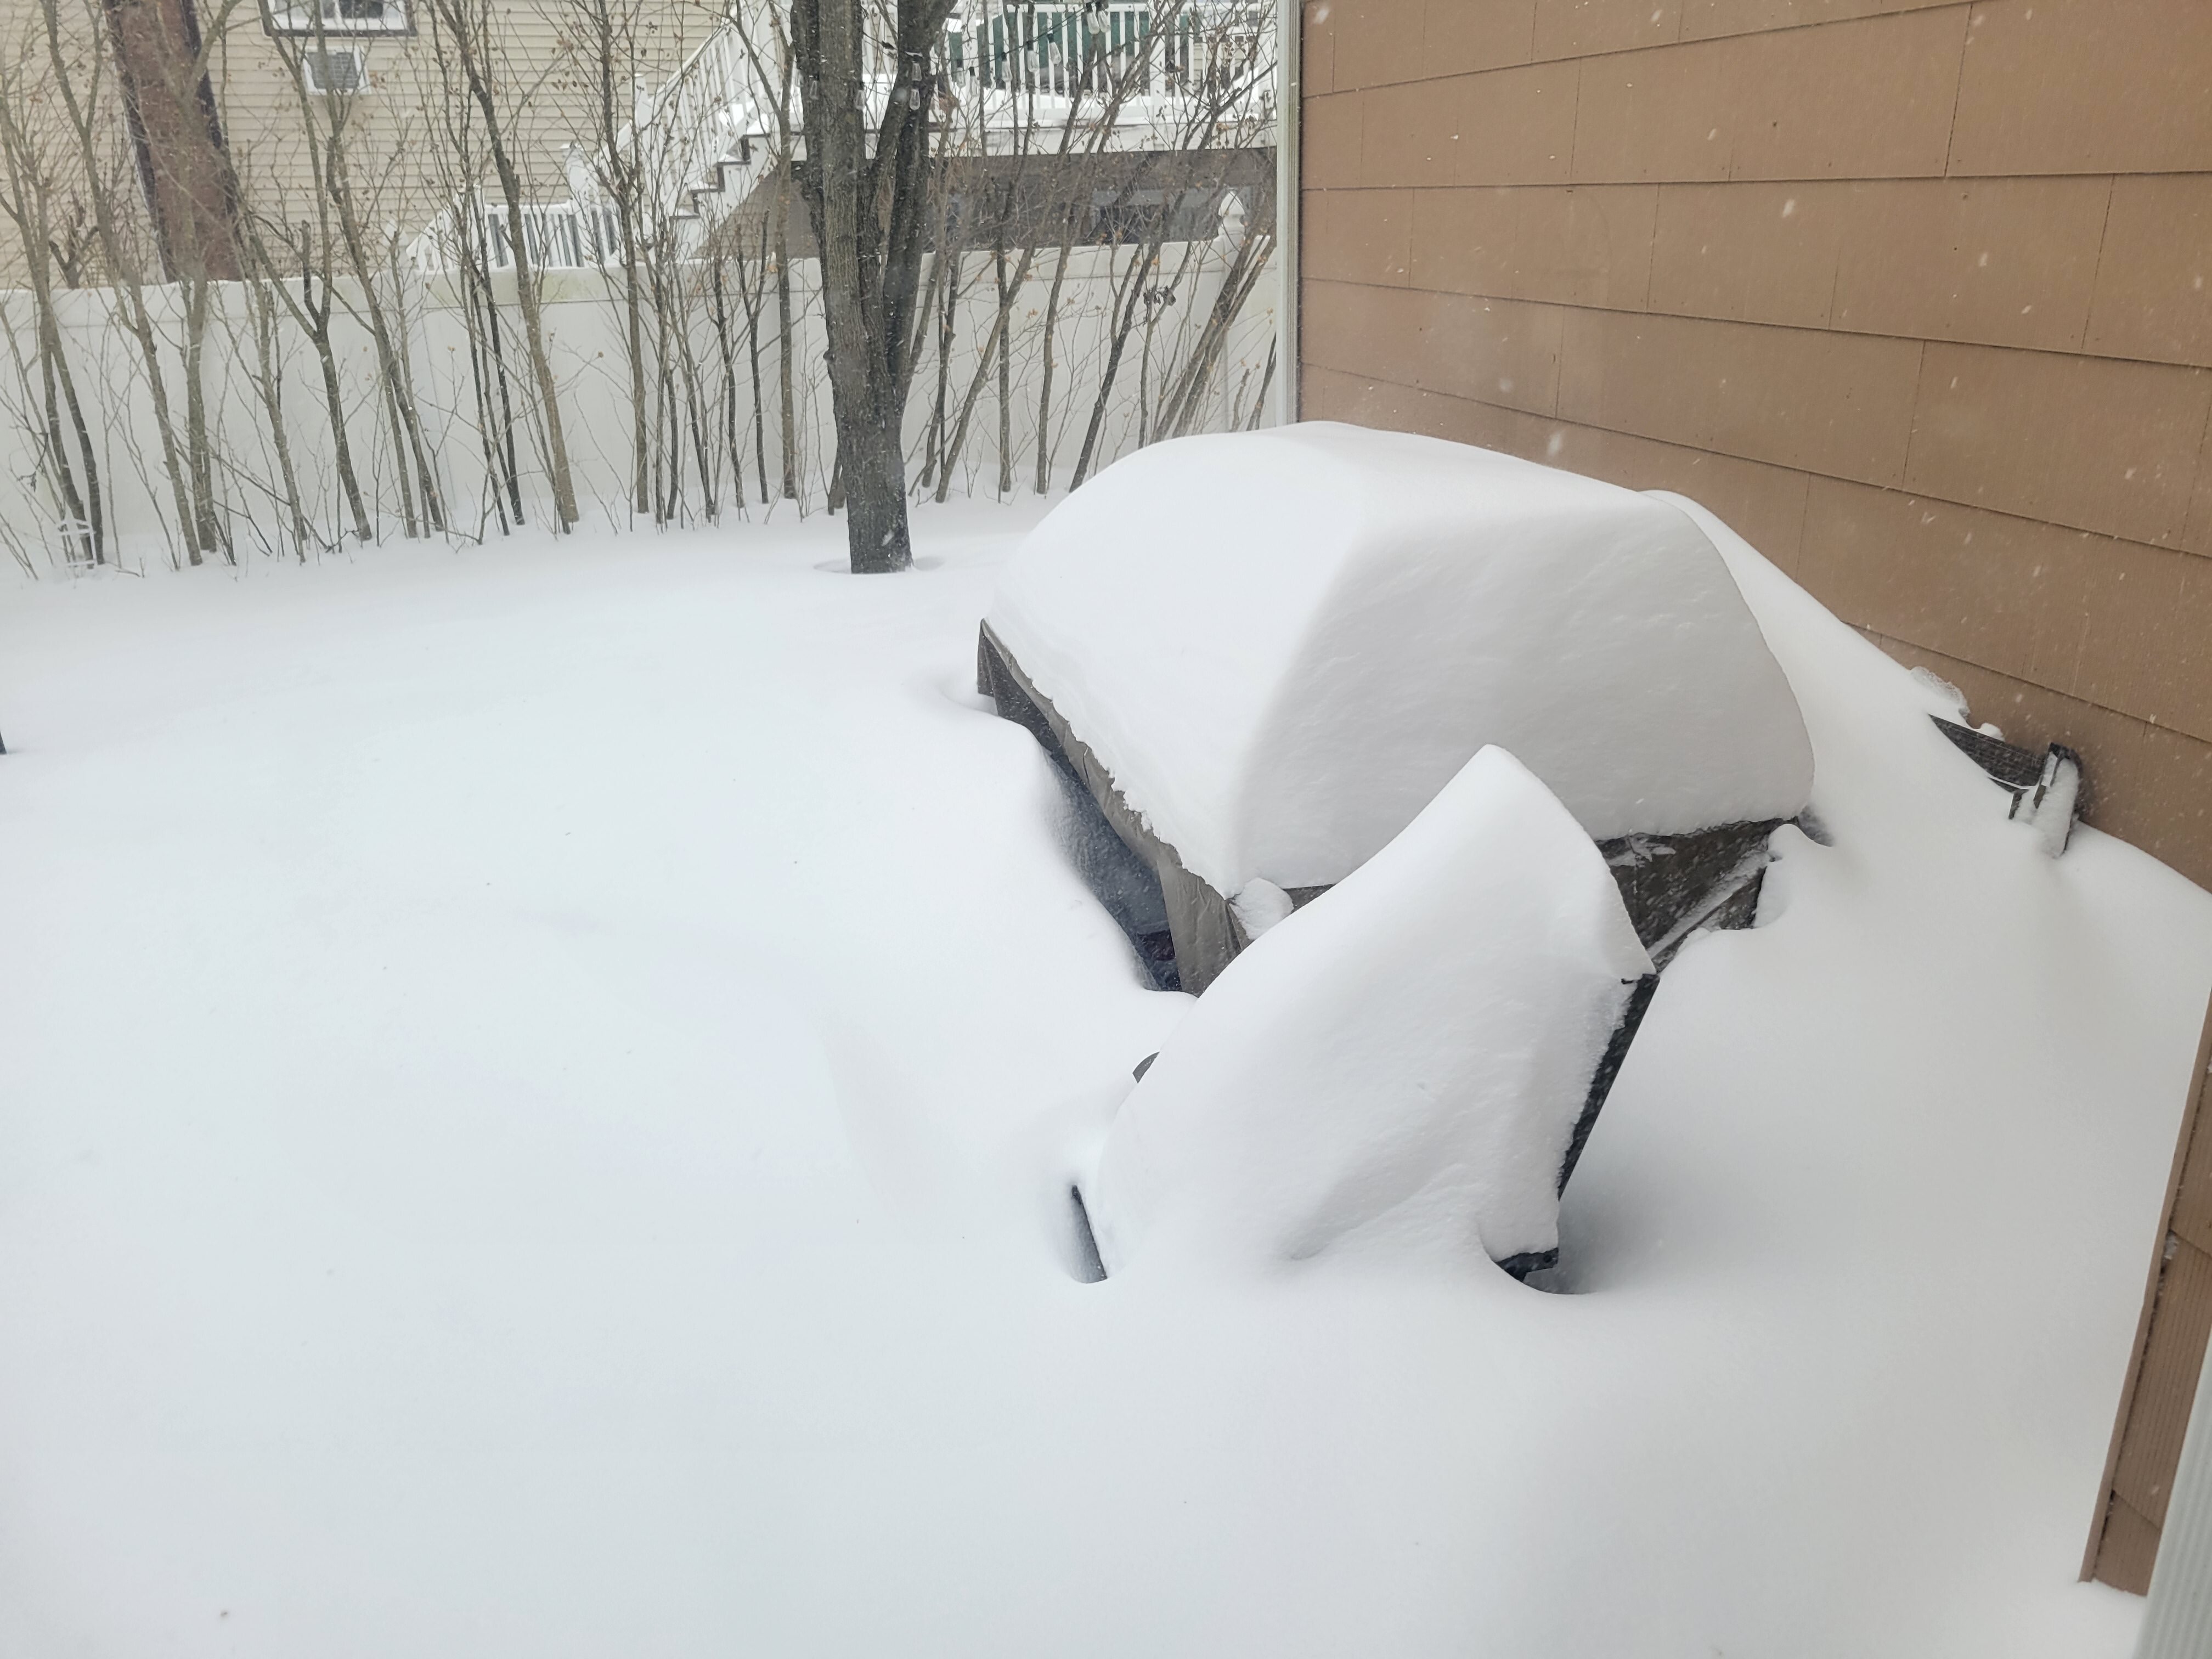
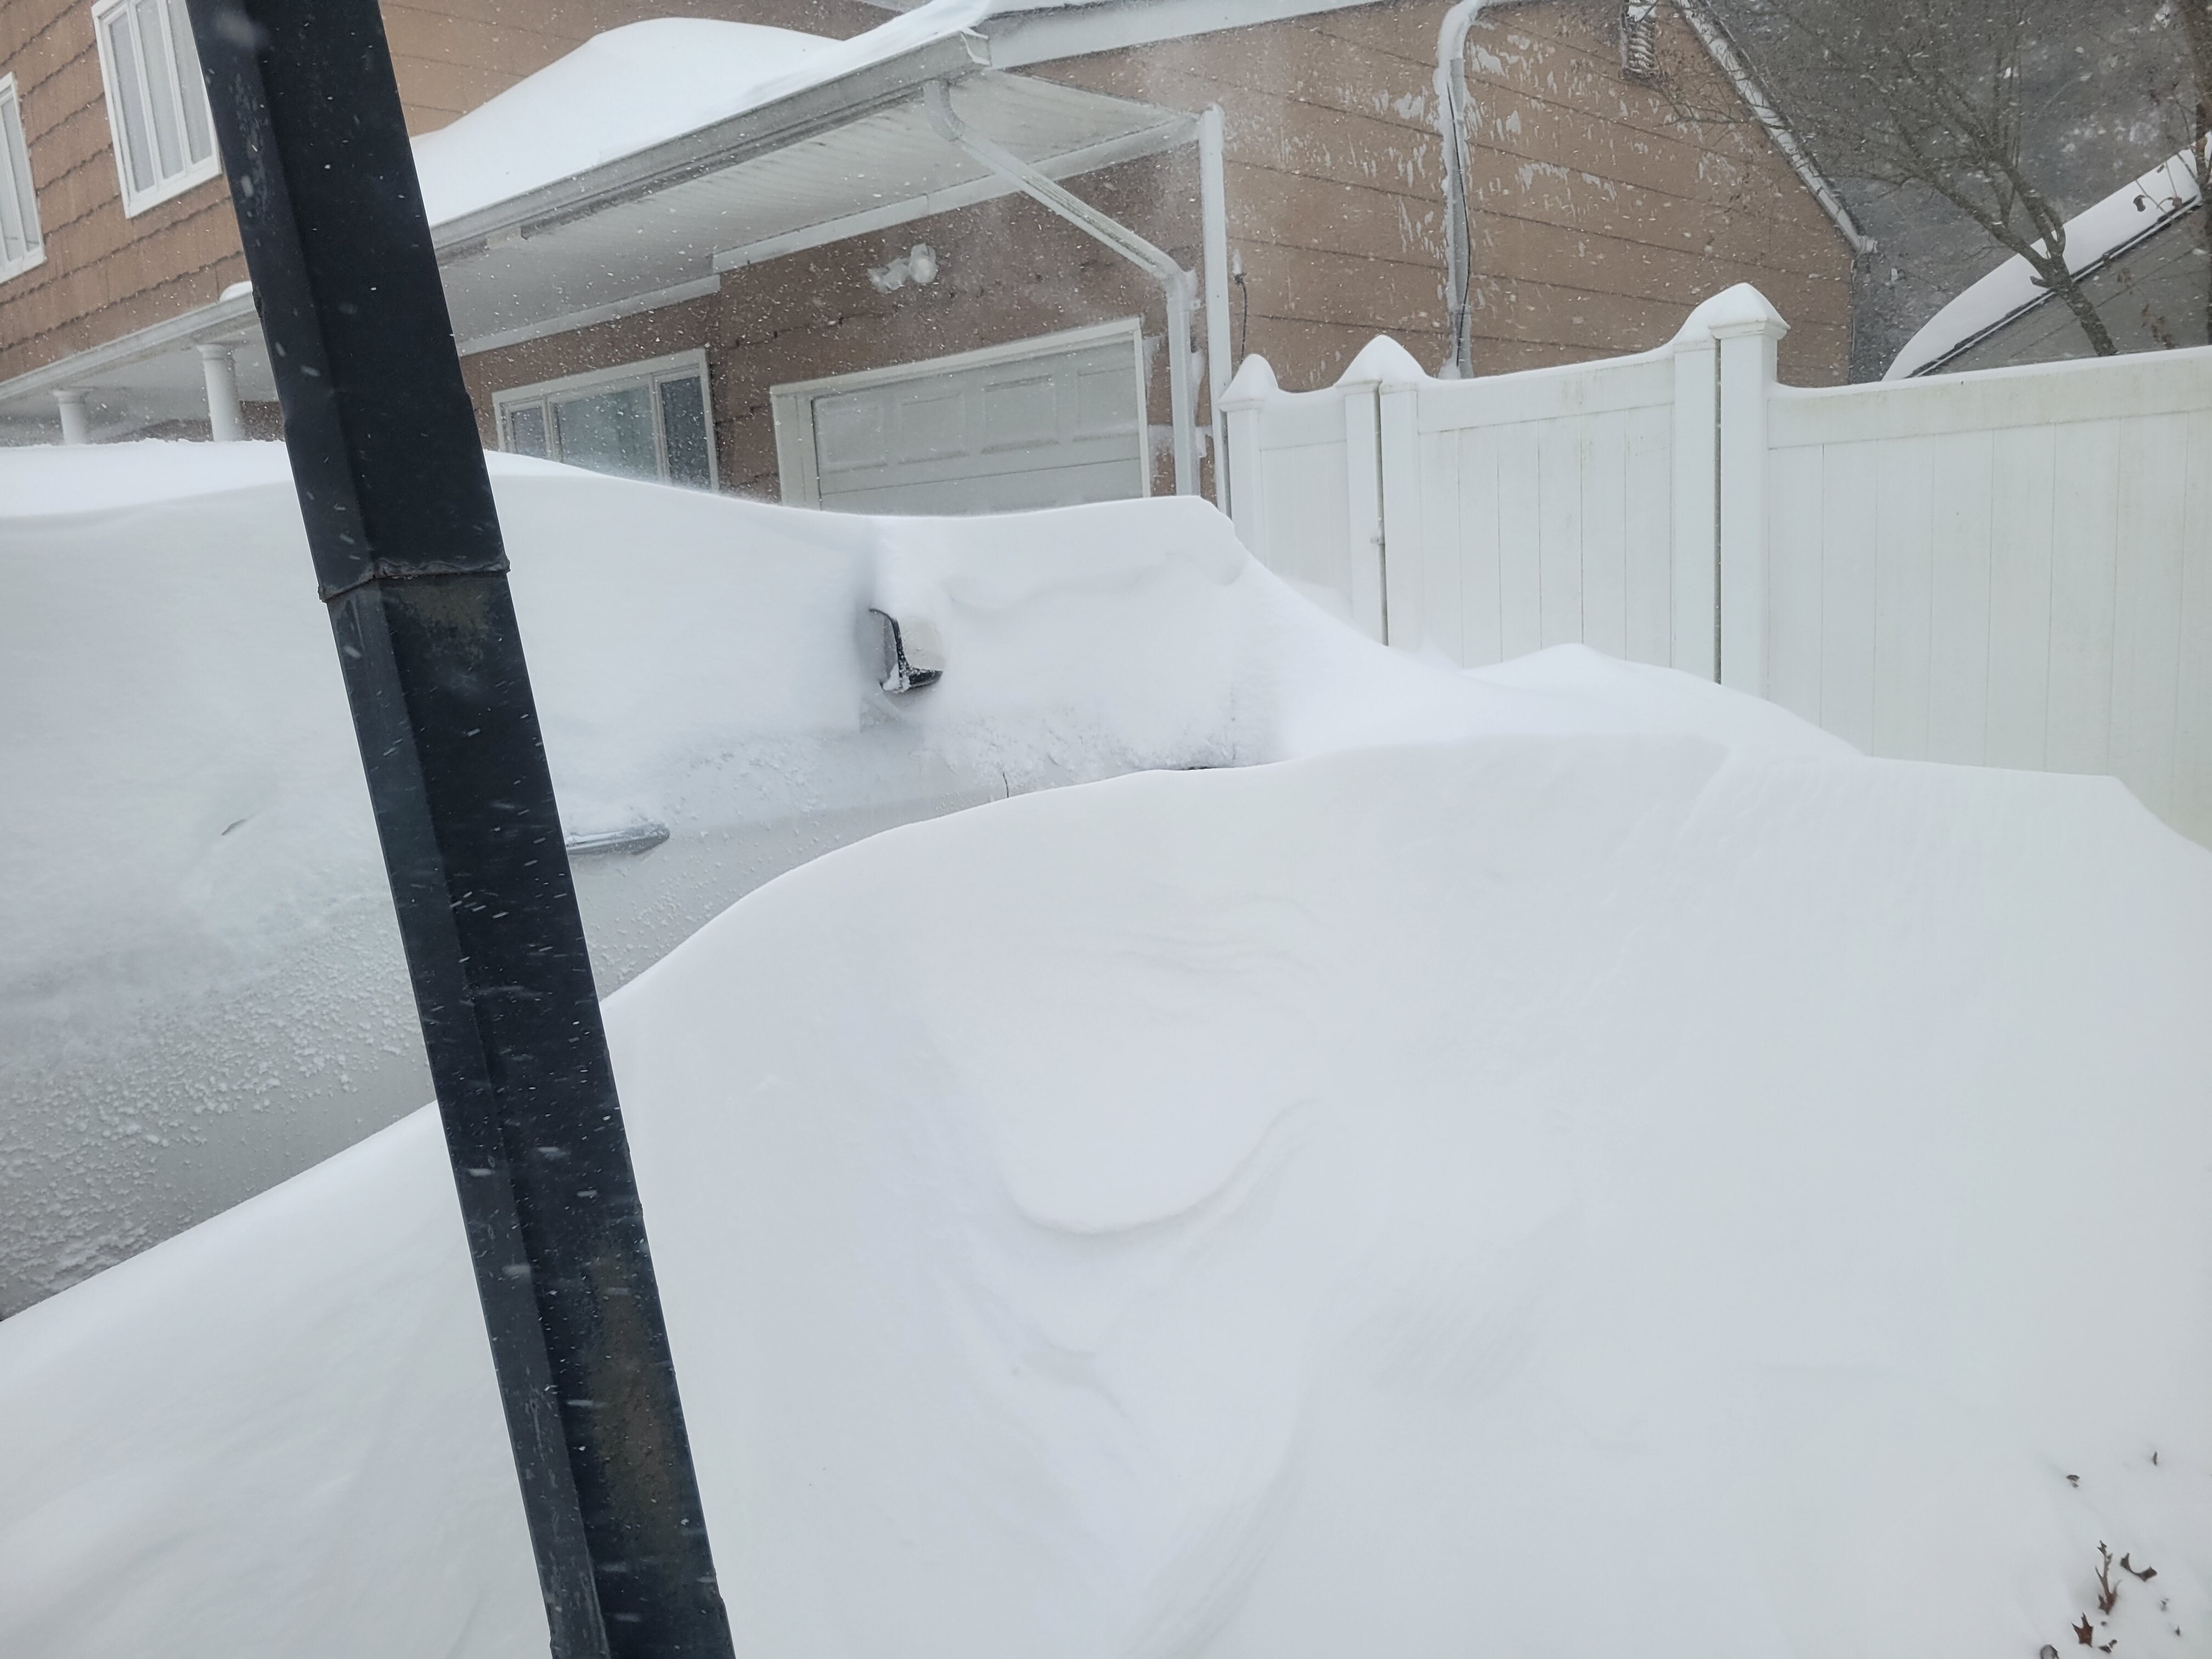
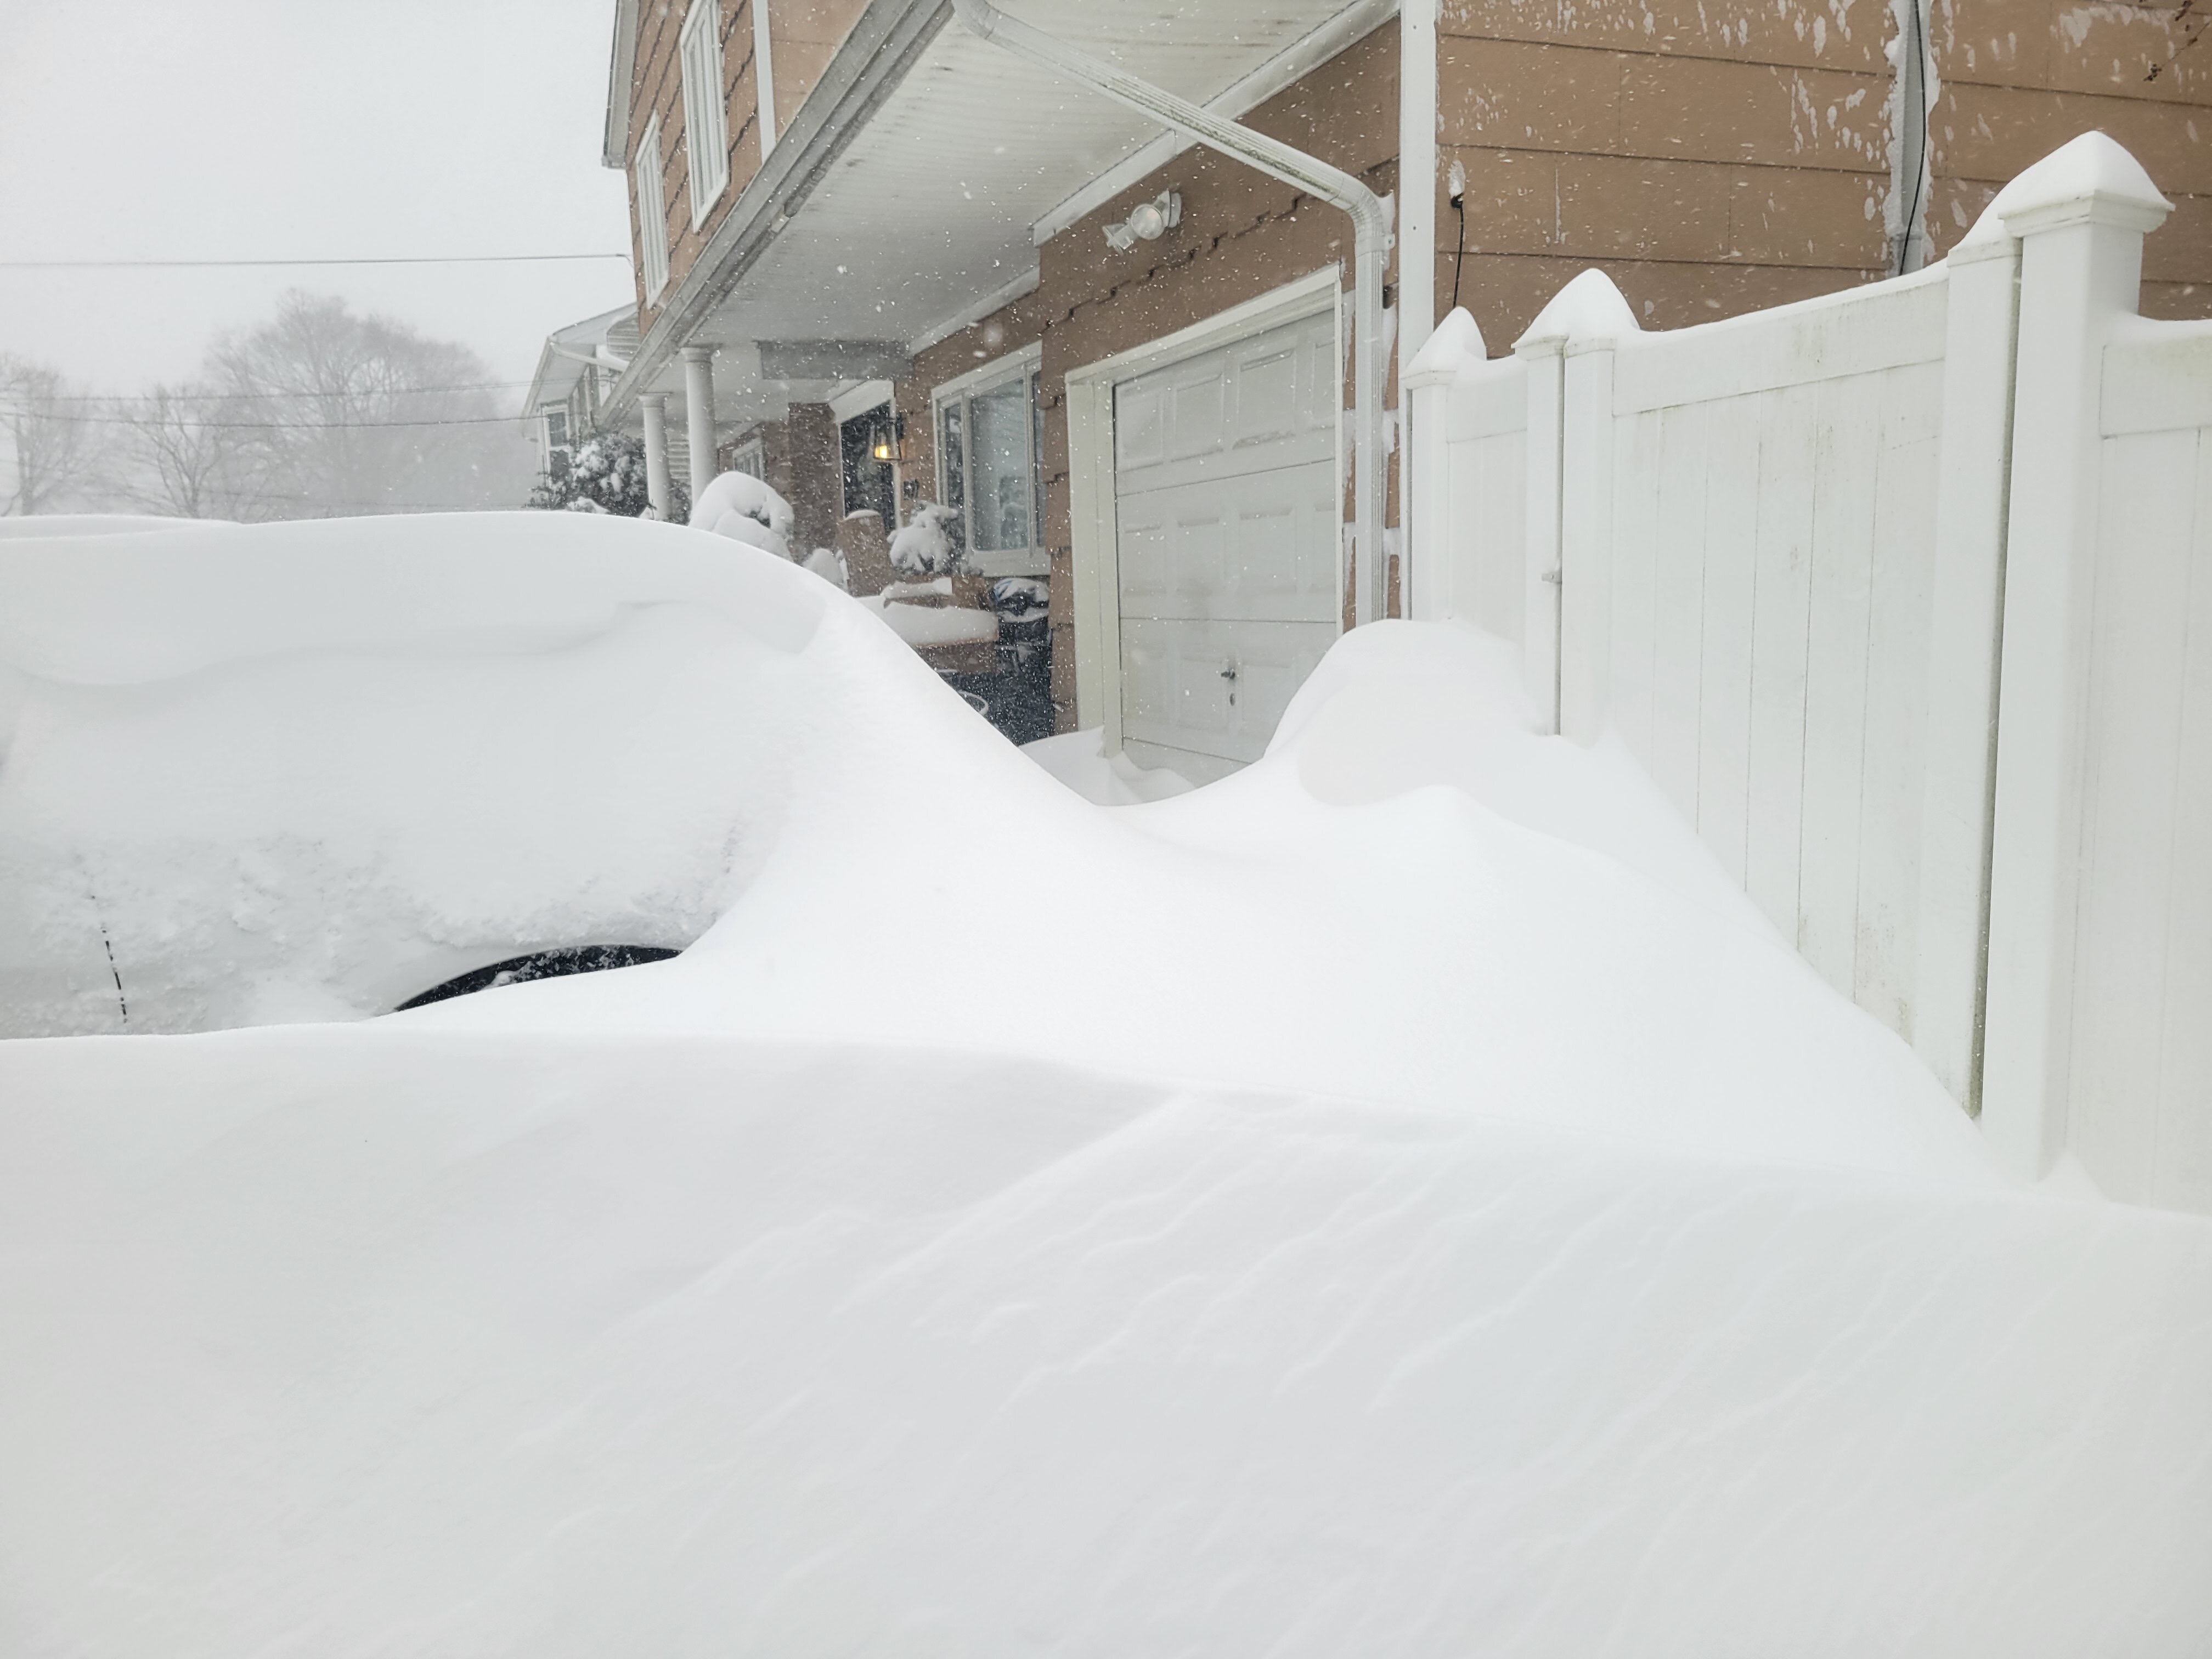
2 hours ago, Rjay said:
Buried
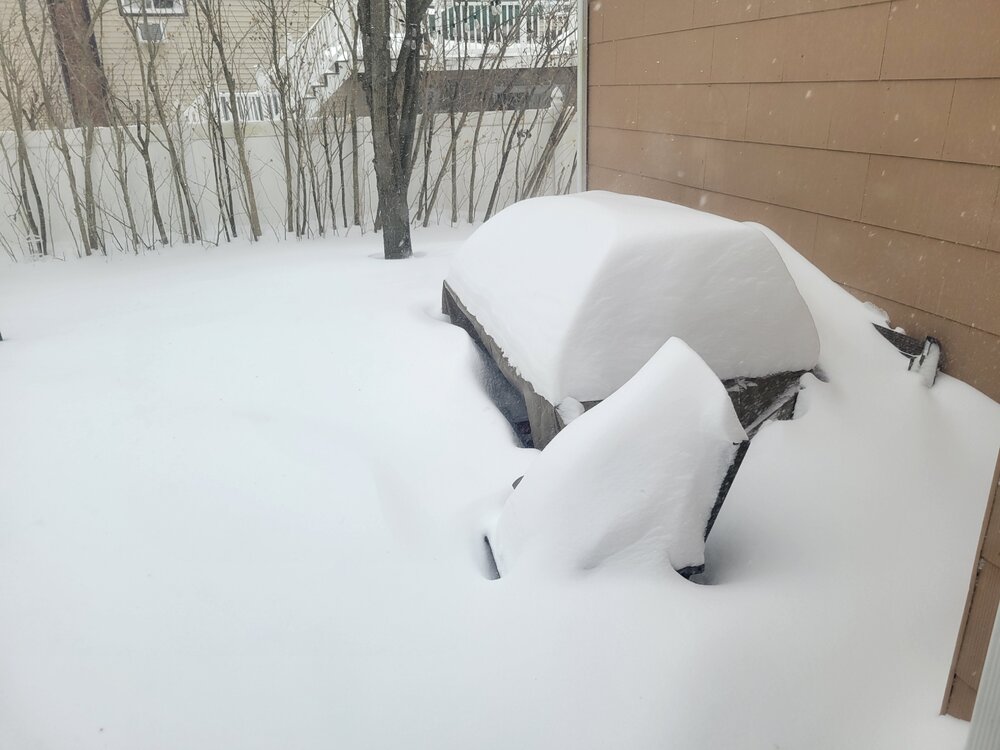


That is truly beautiful.
-
 1
1
-
-
17 hours ago, Avdave said:
Your infatuation with New England getting screwed is really bizarre. Not sure why all the hate for a region because they are in a much colder climo and in a good location for snows.
Some people seem to get as much or maybe more more joy from others failing to get snow than from their own successes. It is actually quote a common attitude I have found, although I don't understand it myself.
-
2
-
-
17 hours ago, TARHEELPROGRAMMER88 said:
4 in a row?
I found the numbers and crunched them. The RDU 30 mean for snow is 5.13 inches. The median is only 2.5 inches. So we are already above the median.
60% of years (18 of 30) during this period were below the mean. And if we didn't get any more snow it would only be the third consecutive year below the mean. 2018 - 2019 was well above the mean: 8.9 "
-
 1
1
-
-
Just now, olafminesaw said:
I know RDU Climo sucks, but crazy that 3"+ storms only occur about every 2-3 years.
Question: how did you compile the data for multi day storms? I've been meaning to do a similar analysis for Greensboro, but only find day snowfall data out there.
I just grabbed the monthly data from here
https://www.weather.gov/wrh/climate?wfo=RAH
You can also get the GSO data from there as well.
-
2
-
-
7 minutes ago, clskinsfan said:
No doubt Brady is the GOAT. But the cool thing is we got to watch the future of the NFL in that Bills/Chiefs game last weekend. Best football game I have ever watched in my life. And that is saying something when you are as old as me.
I personally find the shotgun/spread revolution less aesthetically pleasing than say the 1990's with fullbacks. The game has swung too much to the offense for my personal taste. Please note that I am just talking about my personal preference. I hate it when people try to argue that their personal likes are objectively superior and their personal dislikes are objectively inferior.
-
6 minutes ago, WinstonSalemArlington said:
Dang , the 00s were the glory days
Conversely, the 1990s were a dark time.
-
2
-
-
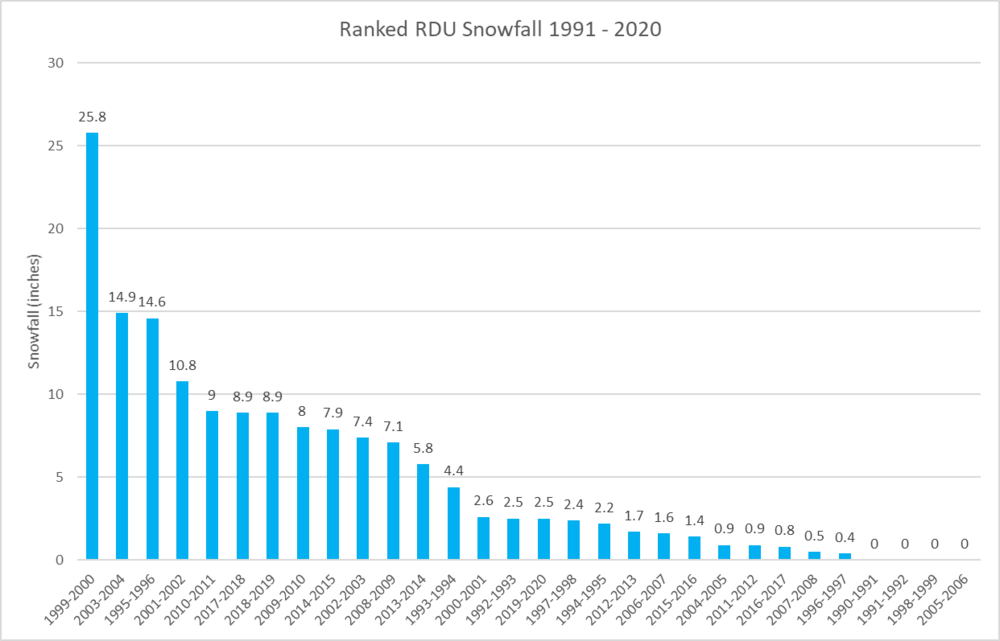
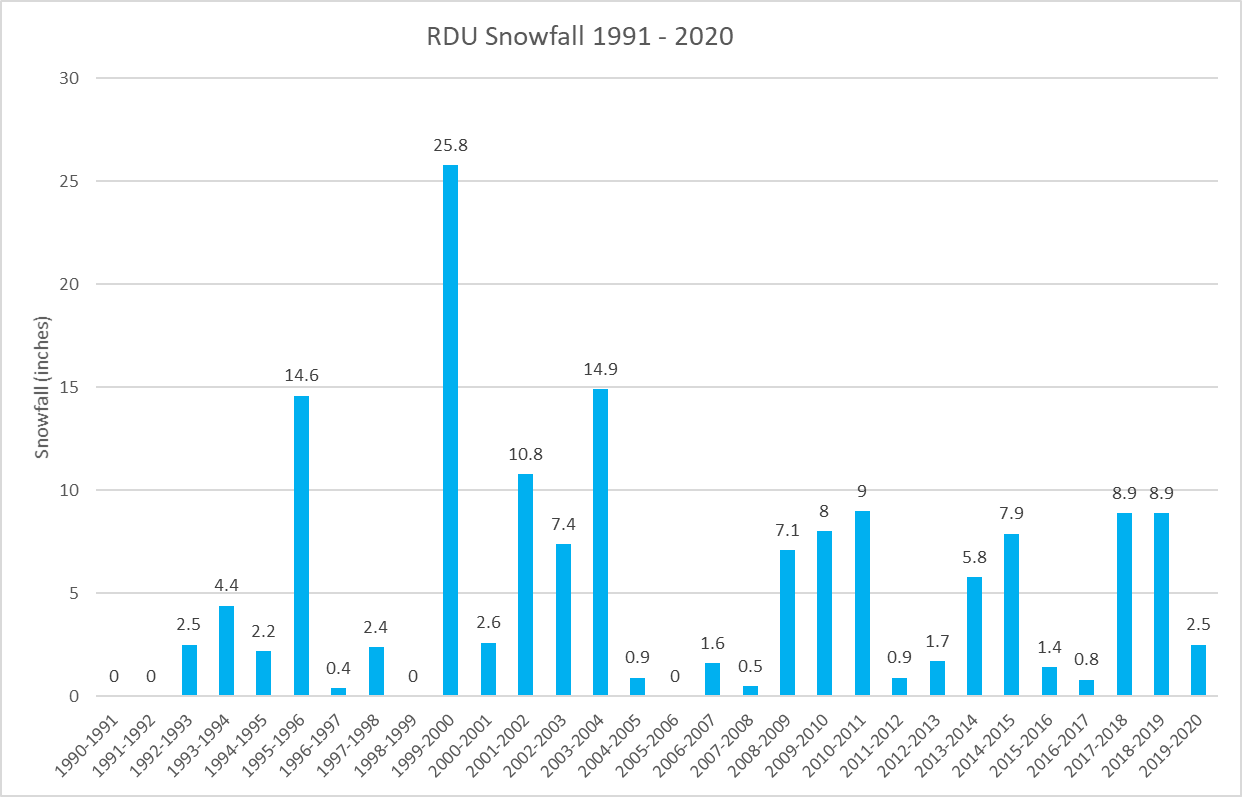
Here is a ranked graph of RDU snowfall from 1991-2020. Note the Carolina crusher sticks out like a beautiful sore thumb.
-
2
-
2
-
-
9 minutes ago, WinstonSalemArlington said:
Do you know what the normal was for the previous 30 year period?
For RDU, the mean for 1981 - 2010 was 6.75 " so when we lost the 1980's our mean went down a good bit. Our median plummeted though. It was 4.25".
-
1
-
-
4 minutes ago, WinstonSalemArlington said:
Do you know what the normal was for the previous 30 year period?
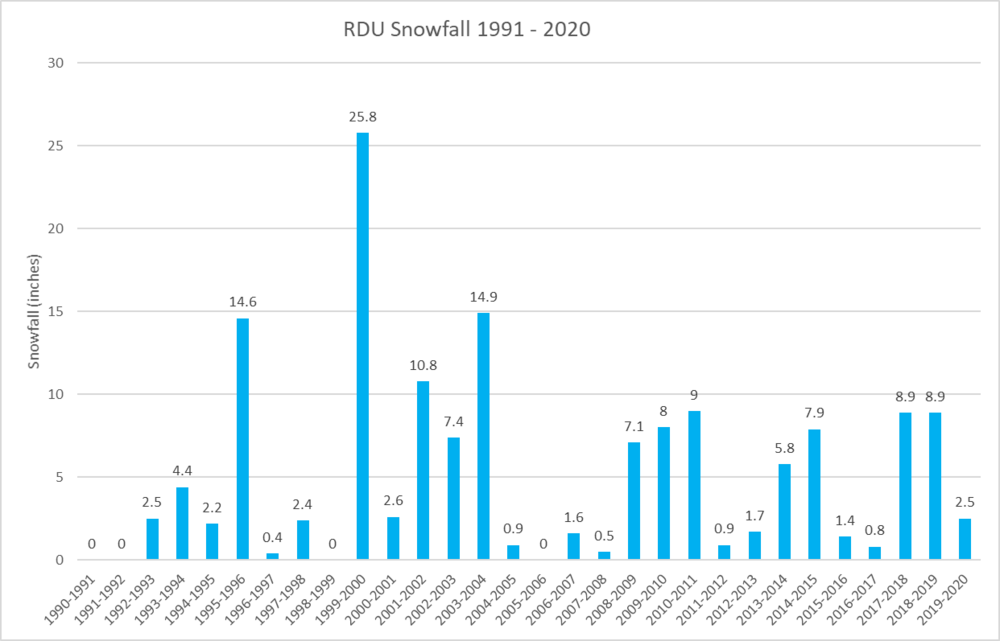
I will look in a minute, but first I have obtained the yearly snowfall amounts from 1991 - 2020. The median snowfall is......2.5 inches, less than half the mean! So RDU has already exceed its real "normal" snowfall for the year. Congratulations for us all. (note, I treat "T" as zeros in my calculations
Here is the yearly data
1990-1991 0 1991-1992 0 1992-1993 2.5 1993-1994 4.4 1994-1995 2.2 1995-1996 14.6 1996-1997 0.4 1997-1998 2.4 1998-1999 0 1999-2000 25.8 2000-2001 2.6 2001-2002 10.8 2002-2003 7.4 2003-2004 14.9 2004-2005 0.9 2005-2006 0 2006-2007 1.6 2007-2008 0.5 2008-2009 7.1 2009-2010 8 2010-2011 9 2011-2012 0.9 2012-2013 1.7 2013-2014 5.8 2014-2015 7.9 2015-2016 1.4 2016-2017 0.8 2017-2018 8.9 2018-2019 8.9 2019-2020 2.5 -
1
-
-
3 hours ago, eyewall said:
It would take another 3 incher to get us to normal.
What do you define as normal? For the 1991 - 2020 period, RDU "normal" (mean) is 5.2 inches: 2.6 in Jan, 1.4 in Feb, 0.3 in March, 0.1 in Nov, and 0.8 in December. I haven't been able to find the yearly numbers to calculate a median but I am certain it is significantly less than the mean.
-
30 minutes ago, Bob Chill said:
We've wasted a few great ones since but that was the last classic hit. Last year had some great blocking. Upper air looked great plenty but when you opened up the 850 temp panels... ooof.... what a disaster. Lol
Last year was very frustrating in that regard. It started in November, which was a ++++++AO nightmare which torched our source regions. That broke down but was instantly replaced with weeks-long Pac puke in December. By January even with great blocking there was no cold to be had in the entire hemisphere. By mid February that finally changed, but by then our blocking went "poof" and the cold dumped into the southern plains leading to historic events there. C'est la vie.
-
Just now, cbmclean said:
Because good results are much more probable in good patterns and bad results are much more probable in bad patterns.
To clarify, it might be better to say "good results are much less improbable in good patterns". Good results are still unlikely at our latitudes. Obviously in my neck of the woods that is even more true.
-
1 hour ago, Maestrobjwa said:
So if we can't expect anything...what good are LR discussions, then? Good patterns can mean nothing, bad patterns can mean nothing...so what's the point?
Because good results are much more probable in good patterns and bad results are much more probable in bad patterns.
-
5 minutes ago, TARHEELPROGRAMMER88 said:
4 in a row?
Any one have the 1999-2020 raw data easily accessible for RDU? I am curious to compare the mean vs the median. I am guessing that at least 2 out of 3 years are below the 30 year mean.
-
1
-
-
2 minutes ago, TARHEELPROGRAMMER88 said:
Another winter with RDU below average in snowfall?
The majority of years are below average at RDU when it comes to snow.
-
Just now, Always in Zugzwang said:
Ding, ding, ding!! We have a winna!! Correct! And a good movie, to be sure.
Its so safe you wouldn't believe!!!
-
1
-
-
8 minutes ago, Always in Zugzwang said:
"Is it safe?" (extra bonus points for anyone who knows what that is from!!)
The marathon man.
-
Just when I thought I was out...
-
Just now, Maestrobjwa said:
If this doesn't encapsulate our collective snow psychosis I don't know what does, lol
Is it unhealthy that I attempted to hire some guys to break that SWs knees? But then I realized that that would just make it fall behind more.
-
1
-

January Banter 2022
in Mid Atlantic
Posted
@psuhoffman sure has been pretty quiet lately. Pretty rude of him to let family and work responsibilities get in the way of posting to keep me informed.